NAB 2015 First Quarter Trading Update

NAB released its trading update today. Overall cash profit was a little below expectations, and loss provisions were up. Looking in more detail, revenue rose approximately 4%, but after excluding gains on the UK Commercial Real Estate (CRE) loan portfolio sale and SGA asset sales, on a like for like basis, increased approximately 2% thanks to higher markets income and growth in lending balances over the quarter. Group net interest margin (NIM) was flat, but after excluding Markets and Treasury, was slightly lower. Expenses increased approximately 4% after excluding specified items in the September 2014 Half Year. The main drivers include timing of enterprise bargain agreement-related salary increases, normalisation of performance based incentives and investment in the core franchise. The charge for Bad and Doubtful Debts for the quarter rose 30% to $227 million, but was stable excluding releases from the Group Economic Cycle Adjustment (ECA) and UK CRE overlay in the September 2014 Half Year.

The Australian business appears to be settling now, with business banking losses easing despite intense competition. Mortgage lending is still strong. No further comments were made on the UK exit strategy.  The Group’s Basel III Common Equity Tier 1 (CET1) ratio was 8.74% as at 31 December 2014, an increase of 11 basis points from 30 September 2014. As previously announced, the Group will target a CET1 ratio of 8.75% – 9.25% from 1 January 2016, based on current regulatory requirements.

First Time Loans Now 25% Higher – ABS

The ABS published revised First Time Buyer data to try and iron out some data issues. As a result in November 2014 an extra 1,566 loans (25.8%) were found. This means First Time Buyer Loans were 14.6% of new loans in November, as opposed to 11.6% reported previously. Still a low number, compared with the peak of 30.6% in April 2009.

FTB-Nov-2014-RevisedThis does not count First Time Buyers going direct to the investment sector, which we have highlighted before. The ABS explanation follows.

The First Home Owner Grant (FHOG), introduced on 1 July 2000, is a national scheme funded and administered by the states and territories http://www.firsthome.gov.au. Under the scheme, a one-off grant is payable to eligible first home owners. Until October 2012, all first home buyers were eligible for the grant regardless of whether they bought a new or an established home.

Gradually, States and Territories restricted grants to new homes only so that first home buyers who were buying established homes were no longer eligible for the grant. APRA reporting instructions state that a First Home Buyer is a borrower entering the home ownership market for the first time as an owner-occupier. The instructions do not make any distinction between first home buyers who are eligible for a First Home Owner Grant and those who are not. Nonetheless, some lenders’ reporting systems only record first home buyers if they are eligible for a grant which may cause under-reporting of first home buyers.

This under-reporting has progressively impacted on first home buyer statistics from October 2012 as individual States and Territories have changed the eligibility of their First Home Owner Grants, generally to cover only the purchase of newly constructed homes.

States and Territories restricted grants to new homes from different dates – New South Wales and Queensland from October 2012; Victoria from July 2013; the Australian Capital Territory from September 2013; South Australia and Tasmania from July 2014. Loans to first home buyers were therefore underestimated in these States from the dates specified due to some lenders under-reporting. Other lenders have reported correctly throughout. Originally, the drop in loans to first home buyers from October 2012 had been attributed to the change in grant eligibility reducing the affordability for first home buyers and economic conditions, such as rising house prices and the increase in investment loans for housing. However, subsequent analysis and follow-up with lenders has confirmed that the drop was due, at least in part, to under-reporting by some lenders.

CHANGES TO THE ESTIMATION METHOD

The ABS estimates that the number of loans to first home buyers which are currently being reported are approximately 80% of the total number of loans to first home buyers. Total reported monthly home loan commitments are not affected by this under-reporting.

For lenders who are under-reporting loans to first home buyers, the ABS has developed a model to adjust the proportion of first home buyers to total loans for each period of incorrect reporting. The model uses the following components:

      a) proportion of first home buyers to total loans for those lenders reporting correctly this period;
      b) the proportion of first home buyers to total loans for those lenders reporting incorrectly in the previous period;
      c) the proportion of first home buyers to total loans for those lenders reporting correctly in the previous period; and
    d) coefficients which determine the relative contribution of the above components to the incorrectly reported proportion.

The coefficients (d) of this model were estimated using data from January 2002 to the month prior to the First Home Owner Grant policy being changed (for example, in NSW the data were from January 2002 to September 2012). All the affected states were analysed separately. When more lenders are able to report correctly, the coefficients and estimates will be updated accordingly.

Application of the adjusted proportion:

The following table is an excerpt from the Housing Finance form (ARF392.0) and will be used to demonstrate the application of the adjusted proportion.

Chart: New commitments for home loans

There are no known issues in reporting the total number and value of Fixed rate home loans (9t and 9vt), Secured revolving credit home loans (10t and 10vt) and Other home loans (11t and 11vt). The estimated proportion of first home buyers is applied to the totals for Question 9, Question 10 and Question 11 (9t, 9vt; 10t, 10vt; and 11t, 11vt) respectively to determine the number of first home buyers of the particular loan type. The values for non-first home buyers (i.e. All other loans) are then derived by subtracting the values for first home buyers from the respective totals.

Each lender reports the data by State and Territory, and the proportion for each period is applied to the relevant lenders at the state level. The adjustment is made at the lowest level collected, and is applied to the affected lenders and affected States only. The data are then aggregated to the published States and the national level.

Revisions have been made to the previously published data for the Number, Percentage (%) of all dwellings financed, and Average loan size of First Home Buyers and Non-first home buyers at the national level (columns B to G of Table 560909a). Relevant States’ previously published data have also been revised (Table 560909b) back to when the First Home Owner Grant was first restricted in that State or Territory.

RBA Cuts Rate to 2.25%

The RBA has cut the cash rate by 25 basis points to 2.25 per cent, effective 4 February 2015.

Growth in the global economy continued at a moderate pace in 2014. China’s growth was in line with policymakers’ objectives. The US economy continued to strengthen, but the euro area and Japanese economies were both weaker than expected. Forecasts for global growth in 2015 envisage continued moderate growth.

Commodity prices have continued to decline, in some cases sharply. The price of oil in particular has fallen significantly over the past few months. These trends appear to reflect a combination of lower growth in demand and, more importantly, significant increases in supply. The much lower levels of energy prices will act to strengthen global output and temporarily to lower CPI inflation rates.

Financial conditions are very accommodative globally, with long-term borrowing rates for several major sovereigns reaching new all-time lows over recent months. Some risk spreads have widened a little but overall financing costs for creditworthy borrowers remain remarkably low.

In Australia the available information suggests that growth is continuing at a below-trend pace, with domestic demand growth overall quite weak. As a result, the unemployment rate has gradually moved higher over the past year. The fall in energy prices can be expected to offer significant support to consumer spending, but at the same time the decline in the terms of trade is reducing income growth. Overall, the Bank’s assessment is that output growth will probably remain a little below trend for somewhat longer, and the rate of unemployment peak a little higher, than earlier expected. The economy is likely to be operating with a degree of spare capacity for some time yet.

The CPI recorded the lowest increase for several years in 2014. This was affected by the sharp decline in oil prices at the end of the year and the removal of the price on carbon. Measures of underlying inflation also declined a little, to around 2¼ per cent over the year. With growth in labour costs subdued, it appears likely that inflation will remain consistent with the target over the next one to two years, even with a lower exchange rate.

Credit growth picked up to moderate rates in 2014, with stronger growth in lending to investors in housing assets. Dwelling prices have continued to rise strongly in Sydney, though trends have been more varied in a number of other cities over recent months. The Bank is working with other regulators to assess and contain economic risks that may arise from the housing market.

The Australian dollar has declined noticeably against a rising US dollar over recent months, though less so against a basket of currencies. It remains above most estimates of its fundamental value, particularly given the significant declines in key commodity prices. A lower exchange rate is likely to be needed to achieve balanced growth in the economy.

For the past year and a half, the cash rate has been stable, as the Board has taken time to assess the effects of the substantial easing in policy that had already been put in place and monitored developments in Australia and abroad. At today’s meeting, taking into account the flow of recent information and updated forecasts, the Board judged that, on balance, a further reduction in the cash rate was appropriate. This action is expected to add some further support to demand, so as to foster sustainable growth and inflation outcomes consistent with the target.

Metadata – A Marketeer’s Dream Comes True

Next time you shop, and pay by credit card, consider this. According to a recent report “Unique in the shopping mall: On the reidentifiability of credit card metadata”, it is possible to take anonymous transaction data and by applying analytics to the data, uncover considerable information about the card holder, especially, when cross-matched with other data sources. More broadly, anyone who thinks retaining meta-data has no consequences, should read this report.

Metadata contain sensitive information. Understanding the privacy of these data sets is key to their broad use and, ultimately, their impact. We study 3 months of credit card records for 1.1 million people and show that four spatiotemporal points are enough to uniquely reidentify 90% of individuals. We show that knowing the price of a transaction increases the risk of reidentification by 22%, on average. Finally, we show that even data sets that provide coarse information at any or all of the dimensions provide little anonymity and that women are more reidentifiable than men in credit card metadata.

Large-scale data sets of human behavior have the potential to fundamentally transform the way we fight diseases, design cities, or perform research. Ubiquitous technologies create personal metadata on a very large scale. Our smartphones, browsers, cars, or credit cards generate information about where we are, whom we call, or how much we spend. Scientists have compared this recent availability of large-scale behavioral data sets to the invention of the microscope. New fields such as computational social science rely on metadata to address crucial questions such as fighting malaria, studying the spread of information, or monitoring poverty. The same metadata data sets are also used by organizations and governments. For example, Netflix uses viewing patterns to recommend movies, whereas Google uses location data to provide real-time traffic information, allowing drivers to reduce fuel consumption and time spent traveling.

The transformational potential of metadata data sets is, however, conditional on their wide availability. In science, it is essential for the data to be available and shareable. Sharing data allows scientists to build on previous work, replicate results, or propose alternative hypotheses and models. Several publishers and funding agencies now require experimental data to be publicly available. Governments and businesses are similarly realizing the benefits of open data. For example, Boston’s transportation authority makes the real-time position of all public rail vehicles available through a public interface, whereas Orange Group and its subsidiaries make large samples of mobile phone data from Côte d’Ivoire and Senegal available to selected researchers through their Data for Development challenges.

These metadata are generated by our use of technology and, hence, may reveal a lot about an individual. Making these data sets broadly available, therefore, requires solid quantitative guarantees on the risk of reidentification. A data set’s lack of names, home addresses, phone numbers, or other obvious identifiers [such as required, for instance, under the U.S. personally identifiable information (PII) “specific-types” approach, does not make it anonymous nor safe to release to the public and to third parties. The privacy of such simply anonymized data sets has been compromised before.

Unicity quantifies the intrinsic reidentification risk of a data set. It was recently used to show that individuals in a simply anonymized mobile phone data set are reidentifiable from only four pieces of outside information. Outside information could be a tweet that positions a user at an approximate time for a mobility data set or a publicly available movie review for the Netflix data set. Unicity quantifies how much outside information one would need, on average, to reidentify a specific and known user in a simply anonymized data set. The higher a data set’s unicity is, the more reidentifiable it is. It consequently also quantifies the ease with which a simply anonymized data set could be merged with another.

Financial data that include noncash and digital payments contain rich metadata on individuals’ behavior. About 60% of payments in the United States are made using credit cards, and mobile payments are estimated to soon top $1 billion in the United States. A recent survey shows that financial and credit card data sets are considered the most sensitive personal data worldwide. Among Americans, 87% consider credit card data as moderately or extremely private, whereas only 68% consider health and genetic information private, and 62% consider location data private. At the same time, financial data sets have been used extensively for credit scoring, fraud detection, and understanding the predictability of shopping patterns. Financial metadata have great potential, but they are also personal and highly sensitive. There are obvious benefits to having metadata data sets broadly available, but this first requires a solid understanding of their privacy.

To provide a quantitative assessment of the likelihood of identification from financial data, we used a data set D of 3 months of credit card transactions for 1.1 million users in 10,000 shops in an Organisation for Economic Co-operation and Development country. The data set was simply anonymized, which means that it did not contain any names, account numbers, or obvious identifiers. Each transaction was time-stamped with a resolution of 1 day and associated with one shop. Shops are distributed throughout the country, and the number of shops in a district scales with population density.

For example, let’s say that we are searching for Scott in a simply anonymized credit card data set. We know two points about Scott: he went to the bakery on 23 September and to the restaurant on 24 September. Searching through the data set reveals that there is one and only one person in the entire data set who went to these two places on these two days. Scott is reidentified, and we now know all of his other transactions, such as the fact that he went shopping for shoes and groceries on 23 September, and how much he spent.

Furthermore, financial traces contain one additional column that can be used to reidentify an individual: the price of a transaction. A piece of outside information, a spatiotemporal tuple can become a triple: space, time, and the approximate price of the transaction. The data set contains the exact price of each transaction, but we assume that we only observe an approximation of this price with a precision a we call price resolution. Prices are approximated by bins whose size is increasing; that is, the size of a bin containing low prices is smaller than the size of a bin containing high prices.

Despite technological and behavioral differences, we showed credit card records to be as reidentifiable as mobile phone data and their unicity to be robust to coarsening or noise. Like credit card and mobile phone metadata, Web browsing or transportation data sets are generated as side effects of human interaction with technology, are subjected to the same idiosyncrasies of human behavior, and are also sparse and high-dimensional (for example, in the number of Web sites one can visit or the number of possible entry-exit combinations of metro stations). This means that these data can probably be relatively easily reidentified if released in a simply anonymized form and that they can probably not be anonymized by simply coarsening of the data.

Our results render the concept of PII, on which the applicability of U.S. and European Union (EU) privacy laws depend, inadequate for metadata data sets. On the one hand, the U.S. specific-types approach—for which the lack of names, home addresses, phone numbers, or other listed PII is enough to not be subject to privacy laws—is obviously not sufficient to protect the privacy of individuals in high-unicity metadata data sets. On the other hand, open-ended definitions expanding privacy laws to “any information concerning an identified or identifiable person”  in the EU proposed data regulation or “[when the] re-identification to a particular person is not possible”  for Deutsche Telekom are probably impossible to prove and could very strongly limit any sharing of the data.

From a technical perspective, our results emphasize the need to move, when possible, to more advanced and probably interactive individual or group privacy-conscientious technologies, as well as the need for more research in computational privacy. From a policy perspective, our findings highlight the need to reform our data protection mechanisms beyond PII and anonymity and toward a more quantitative assessment of the likelihood of reidentification. Finding the right balance between privacy and utility is absolutely crucial to realizing the great potential of metadata.


Urgent Action Required To Boost Business Lending

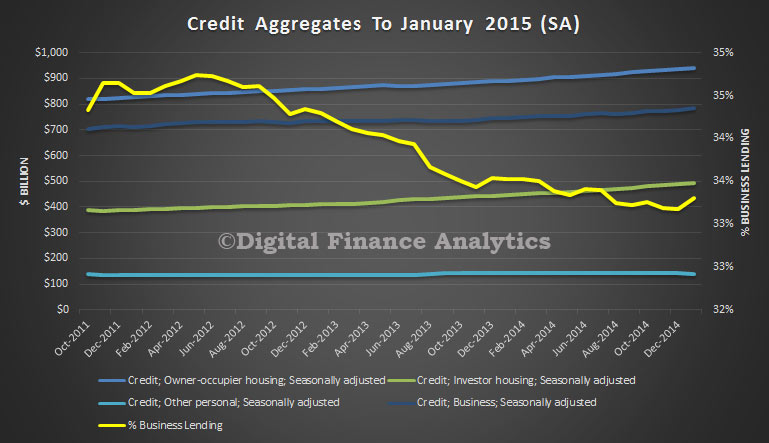
Today the data from RBA and APRA showed the strength of lending in the housing sector, and only 33% of lending is business related. This over-emphasis on property investment in particular is a systemic problem, and must be addressed if we are to drive growth in the right direction. Business needs more focus.

TrendLendingByTypeDec2014To illustrate the point, the mix between business lending and housing (both owner occupied and investment) is worth examining from 1990 onwards. Back then, business lending accounted for about 65% of all lending. Today it is 33%. As a result we know from our SME surveys that many businesses are finding it difficult to get funding on reasonable terms. On the other hand, we see lending for housing, and especially investment lending inflating the banks balance sheets and house prices, but this is not truly productive.

Its time to impose additional controls on investment lending, and to re-balance lending towards businesses who will be able to generate real economic growth for the country. The current situation, where household net worth grows…

FCI-Net-Worth-Jan-2015… thanks to over-high house prices is not sustainable when it is powered by ever more household debt. 

HouseholdRatios2

From our surveys, a quarter of households are less comfortable with the amount of debt they have compared with 12 months ago.

FCI-Debt-Jan-2015Any further interest rate cuts without these measures would be irresponsible.

Home Lending Up To A Record $1.42 Trillion In December

The RBA released their credit aggregates for December 2014 today. Total credit grew by 5.9%, with housing recording 7.1%, Business 4.8% and Personal Credit 0.9% in annual terms. In the last month, housing lending grew 0.6% and business 0.5%.

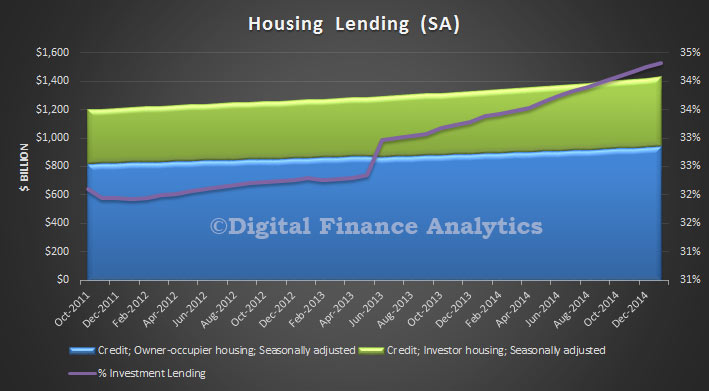
Lending-Aggregates-Dec2014Looking at the breakdown, we see that housing lending grew apace, powered by further significant investment lending. Total housing lending reached a record $1.42 trillion, thanks to growth of $3.5 billion in owner occupied loans (up 0.38%) and investment lending of $4.2 billion (up 0.87%) in the month. Investment loans  now make up 34.3% of home lending, another record.

HousingLendingDec2014RBAOverall, only 33% of all lending is productive finance for business purposes. Household and consumer debt continues to rise strongly. Household debt is at a record. This is one good reason (or should that be 1.42 trillion reasons?) why the RBA should not be cutting the cash rate.

SplitsDec2014The difference between the RBA numbers, which covers all lending for property, and the APRA data, which covers banks only, is explained by the non-bank sector. There has been little growth here in recent times.

Another Bumper Month For Home Loans

APRA just released their monthly banking statistics, which provides a view of lending and deposit portfolios from the banks (ADI’s). Overall home lending by the banks rose $9.12 billion to $1.315 trillion. Owner Occupied loans grew by 0.59% and Investment Loans by 0.9%, with Owner Occupied Lending now accounting for 65.1% of the loan book (down from 65.2% last month). Looking in more detail at the individual bank data, we see that CBA maintains its leading position in the Owner Occupied sector, whilst WBC leads the Investment Property Lending.

HomeLendingSharesDec2014Looking at the trend data, we see stronger investment lending growth at WBC, and to a lesser extent at the other majors.

HomeLendingTrendsDec2014In portfolio percentage terms, Members Equity registered 3% growth, with Macquarrie at 2% and Suncorp and AMP at 1.8%, all above system growth.

HomeLendingMOMPCDec2014Turning to deposits, we saw growth of 1.37% in the month, to $1.8 trillion. CBA holds the largest share of deposits, with WBC and NAB following.

DepositsShareDec2014Looking at the monthly portfolio movements, we see CBA recorded portfolio growth of 1.6%, whilst WBC was 0.29%. Rabbobank grew their portfolio by 1.69%, whilst Macquarie and ING both grew their portfolios by 1.55%. We suspect some players are actively managing their deposits preferring to use wholesale funding alternatives, as we have discussed before.

DepositsMonthyMovementsDec2014Looking at credit cards, balances rose 1.9% to $41.8 billion. There was little overall change in portfolio mix amongst the main players, and Citigroup maintained in position at number 5.

CardsShareDec2014

ECB European QE To Start With “Shock-and-awe”

So the European Central Bank (ECB), QE programme is confirmed. Overnight, President Mario Draghi announced the launch of an open-ended, expanded monthly 60 billion euro (US$70 billion) private and public bond-buying program. However, the programme is open-ended until at least 2016 and could amount to as much as a trillion euros.

The program will start in March this year. The hope is that it will boost the region’s painfully low inflation rate, which came in at an annual minus 0.2 percent in December. Draghi said:

Inflation dynamics have continued to be weaker than expected. While the sharp fall in oil prices over recent months remains the dominant factor driving current headline inflation, the potential for second-round effects on wage and price-setting has increased and could adversely affect medium-term price developments.

This assessment is underpinned by a further fall in market-based measures of inflation expectations over all horizons and the fact that most indicators of actual or expected inflation stand at, or close to, their historical lows. At the same time, economic slack in the euro area remains sizeable and money and credit developments continue to be subdued. Second, while the monetary policy measures adopted between June and September last year resulted in a material improvement in terms of financial market prices, this was not the case for the quantitative results. As a consequence, the prevailing degree of monetary accommodation was insufficient to adequately address heightened risks of too prolonged a period of low inflation. Thus, today the adoption of further balance sheet measures has become warranted to achieve our price stability objective, given that the key ECB interest rates have reached their lower bound.

Looking ahead, today’s measures will decisively underpin the firm anchoring of medium to long-term inflation expectations. The sizeable increase in our balance sheet will further ease the monetary policy stance. In particular, financing conditions for firms and households in the euro area will continue to improve. Moreover, today’s decisions will support our forward guidance on the key ECB interest rates and reinforce the fact that there are significant and increasing differences in the monetary policy cycle between major advanced economies. Taken together, these factors should strengthen demand, increase capacity utilisation and support money and credit growth, and thereby contribute to a return of inflation rates towards 2%.

The ECB is joining the U.S. Federal Reserve, Bank of England and Bank of Japan in launching a quantitative easing (QE) scheme.

Looking at the scheme in more detail, the ECB will purchase euro-denominated investment-grade securities only. However, debt that is trading with a negative yield will also be eligible for the program. Draghi also said that in the event of a sovereign restructuring or default, public and private bondholders would be treated on equal terms. Twenty percent of the additional purchases will be subject to risk-sharing arrangements, designed to limit the amount of risk the ECB takes on to its balance books. The majority of risk will remain with euro zone national central banks. No more than 25 percent of each debt issue will be purchased. The maturities of the debt purchases will range between two and 30 years.

It is worth noting that the ECB also announced it would hold its main interest rate unchanged at 0.05 percent, with the rate on its marginal lending facility at 0.30 percent. The rate on its deposit facility was held at -0.20 percent. Yes, that is a negative number, so deposits are attracting a charge!

Bank Spreads Have Increased By 35 Basis Points

Continuing our analysis of bank margins, we have updated our industry model, with the latest funding and product data. At an aggregate industry level, we see that the average home lending rate has remained static (because whilst there are substantial discounts for new loans, the bulk of the back book has not seen any rate reduction) since 2013. The RBA last reduced their cash rate in August 2013, and the benchmark rate has remained static since then.

NetMarginDec2104However, savers have see their returns falling thanks to deposit repricing initiatives. Between September 2013 and now, the average deposit return has dropped by 35 basis points. As we explained, banks are less reliant on deposits, and can get cheaper funding from other sources (and the recently announced QE in Europe will make funding even cheaper).

So, despite the fact that the banks are unlikely to be able to reduce their provisions much further (as they did last year) to bolster profits, and their increased capital requirements, the highlighted net increase in margins bodes well for bank performance, though at the expense of borrowers, who are not enjoying rate reductions, and depositors who are seeing their interest rates continuing to fall.

DFA Video Blog On Why Savers Are Getting Crunched

Savers are seeing deposit rates falling according to our household surveys. This short video explains why, and which households in particular are most impacted.

There is bad news for those households with bank deposits. We have already seem a range of deposit repricing initiates by the banks, as they trim their deposit rates. But it is likely to get worst, as international sources of funding get cheaper, and changes to capital requirements are likely to translate to further rate cuts for savers down the track.

We see that Down-Traders hold the largest relative share of savings, up from 32% last year to 38% this year. All other segments are at the same relative values as last year, or at lower levels. This highlights that people looking to sell and move to smaller properties are hold the most significant savings.

In this analysis, savings includes balances in current accounts, call and term deposit accounts, and other liquid savings vehicles, but excludes property, shares are superannuation.

Looking at savings intentions, we see that Down-Traders are expecting to save more next year (55%), and only 5% are expecting to be savings smaller amounts. Investors, Portfolio Investors and Refinancers are more likely to be saving less next year. Want to Buys and First Time Buyers are also quite likely to do the same next year.

There will be a realignment of savings vehicles, thanks to the low bank deposit rates, many savers are looking at shares or property as an alternative. Actually this is introducing more risks into savings portfolios, something which the RBA seems quite happy about. As Glenn Stevens said in his opening remarks to the House of Representatives Standing Committee on Economics last year “The returns to savers for holding safe assets have commensurately declined, and this has clearly prompted substitution towards other assets, including equities and dwellings”.

Our survey suggests that households who are in savings mode will continue to save, and actually lower interest may well encourage even greater saving. Low interest rates are not a path to stimulate spending in the current environment for many.

Finally, I think we see significant inter-generational issues in play. Some say it has always been this way, but the relative wealth distribution seems more skewed in 2014, thanks to rising property values, significant savings by some, and significant borrowing by others.