More Pressure On The GDP

The ABS released the Capital Expenditure estimates to June 2019 today.

They said that the trend estimate for total new capital expenditure fell by 0.7% in the June quarter 2019 while the seasonally adjusted estimate fell by 0.5%.

The trend estimate for buildings and structures fell by 1.8% in the June quarter 2019 while the seasonally adjusted estimate fell by 3.3%.

The trend estimate for equipment, plant and machinery rose by 0.6% in the June quarter 2019 while the seasonally adjusted estimate rose by 2.5%

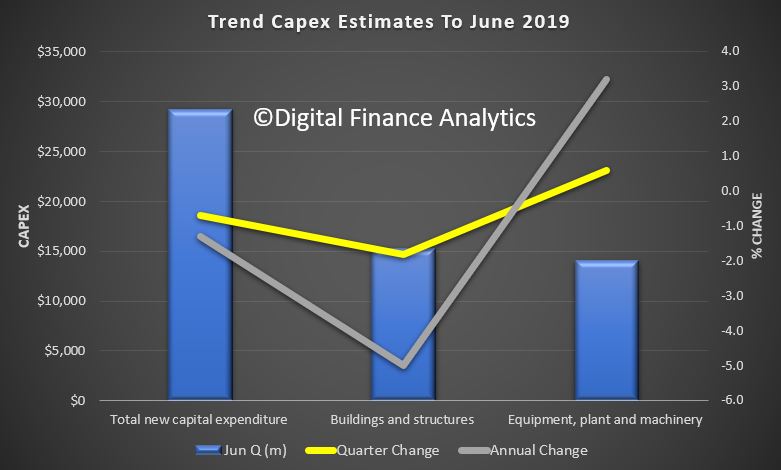
The annual trend changes were down 1.3% overall, with buildings and structures down 5% and equipment plant and machinery up 3.2%.

Overall this will likely reduce the already weak-looking GDP out turn.

Looking ahead the estimates do not look too bad, but given the external and local risk factors, the final results may be lower.

Total capital expenditure

  • Estimate 7 for total capital expenditure for 2018-19 is $122,119m. This is 2.3% higher than Estimate 7 for 2017-18.
  • Estimate 7 is 0.1% lower than Estimate 6 for 2018-19.
  • Estimate 3 for total capital expenditure for 2019-20 is $113,404m. This is 10.7% higher than Estimate 3 for 2018-19.
  • Estimate 3 is 14.9% higher than Estimate 2 for 2019-20.
skyline graph for total capex

Buildings and structures

  • Estimate 7 for buildings and structures for 2018-19 is $65,330m. This is 2.8% lower than Estimate 7 for 2017-18.
  • Estimate 7 is 3.7% lower than Estimate 6 for 2018-19.
  • Estimate 3 for buildings and structures for 2019-20 is $66,922m. This is 12.3% higher than Estimate 3 for 2018-19.
  • Estimate 3 is 12.9% higher than Estimate 2 for 2019-20.
skyline graph for buildings and structures

Capex Off Again

The ABS released their September data on Private Capex spending. The trend volume estimate for total new capital expenditure fell by 4.9% in the September quarter 2016 while the seasonally adjusted estimate fell by 4.0%.

Within that, the trend volume estimate for buildings and structures fell by 8.5% in the September quarter 2016 while the seasonally adjusted estimate fell by 5.7%. On the other hand, the trend volume estimate for equipment, plant and machinery rose by 1.0% in the September quarter 2016 while the seasonally adjusted estimate fell by 1.9%.

The trend estimate for Mining fell 13.2% in the September quarter 2016. Buildings and structures fell 13.4% and equipment, plant and machinery fell 4.0%. The seasonally adjusted estimate for Mining fell 7.2%. Buildings and structures fell 7.7% and equipment,plant and machinery fell 3.1% in seasonally adjusted terms.

But taking a longer view, and across states we can see the real problem the economy has. We see significant falls in capex (current prices) in WA and QLD. Despite attempts to sure up momentum, using housing construction, the gap is just too big.  This is a plot of buildings and structure investment flows.

capex-sep16It also appears WA has further to fall, to revert to more normal levels. We conclude that the fall in mining investment is just too large to be replaced by dwellings, and in any case, we saw yesterday, approvals are also falling.

So, where will future growth come from? This does not bode well for future household income.

The ABS also notes:


Each September quarter, the reference and base year for chain volume estimates for the Survey of Private New Capital Expenditure are updated. A new base year, 2014-15, has been introduced into the chain volume estimates which has resulted in minor revisions to growth rates in subsequent periods. In addition, the chain volume estimates have been re-referenced to 2014-15. Additivity is preserved in the quarters of the reference year and subsequent quarters. Re-referencing affects the level of, but not the movements in, chain volume estimates.As happens each year, a seasonal review has been undertaken based on estimates up to and including the June quarter 2016. This review has not resulted in noteworthy revisions to estimates up to and including June quarter 2016. There are no noteworthy revisions to previous estimates.

Capex On The Slide

The ABS data released today shows the continued fall in mining expenditure, and no counterbalancing movement in other sectors. Total new capital expenditure trend estimate was $37,693 m, down 3.9% YOY.

It does not bode well. Business confidence remains low, and given that household debt is still high, we do not expect housing, and households to fill the gap. We are effectively running out of runway as mining investment trails off. So, housing is the only game in town. Given the data now, it is much more likely we will see interest rates lower for longer than previously anticipated. However, the continued reliance on unproductive lending for housing in not a recipe to drive business investment. We need some new thinking on how to stimulate business investment. Our surveys suggest that it is not interest rates which is the problem, so cutting further wont help much. APRA needs to step up here, turn to tap down on housing lending, and make business lending more likely.  The details of the ABS data are summarised below.

  • The trend volume estimate for total new capital expenditure fell 0.8% in the December quarter 2014 while the seasonally adjusted estimate fell 2.2%.
  • The trend volume estimate for buildings and structures fell 1.5% in the December quarter 2014 while the seasonally adjusted estimate fell 2.6%.
  • The trend volume estimate for equipment, plant and machinery rose 0.9% in the December quarter 2014 while the seasonally adjusted estimate fell 1.3%.
  • This issue includes the fifth estimate (Estimate 5) for 2014-15 and the first estimate (Estimate 1) for 2015-16.
  • Estimate 5 for 2014-15 is $152,656m. This is 8.6% lower than Estimate 5 for 2013-14. Estimate 5 is 0.4% higher than Estimate 4 for 2014-15.
  • Estimate 1 for 2015-16 is $109,799m. This is 12.4% lower than Estimate 1 for 2014-15.