RBA Leaves Rate On Hold Once More

At its meeting today, the Board decided to leave the cash rate unchanged at 2.5 per cent.

Growth in the global economy is continuing at a moderate pace. China’s growth has generally been in line with policymakers’ objectives, though weakening property markets there present a challenge in the near term. Commodity prices in historical terms remain high, but some of those important to Australia have declined further in recent months.

Volatility in some financial markets has picked up over the past couple of months. Overall, however, financial conditions remain very accommodative. Long-term interest rates and risk spreads remain very low. Markets still appear to be attaching a low probability to any rise in global interest rates or other adverse event over the period ahead.

In Australia, most data are consistent with moderate growth in the economy. Resources sector investment spending is starting to decline significantly, while some other areas of private demand are seeing expansion, at varying rates. Public spending is scheduled to be subdued. Overall, the Bank still expects growth to be a little below trend for the next several quarters.

Recent data on prices confirmed that inflation is running between 2 and 3 per cent, as expected, and this is likely to continue. Although some forward indicators of employment have been firming this year, the labour market has a degree of spare capacity and it will probably be some time yet before unemployment declines consistently. Hence, growth in wages is expected to remain relatively modest over the period ahead, which should keep inflation consistent with the target even with lower levels of the exchange rate.

Monetary policy remains accommodative. Interest rates are very low and have continued to edge lower over the past year or so as competition to lend has increased. Investors continue to look for higher returns in response to low rates on safe instruments. Credit growth is moderate overall, but with a further pick-up in recent months in lending to investors in housing assets. Dwelling prices have continued to rise.

The exchange rate has traded at lower levels recently, in large part reflecting the strengthening US dollar. But the Australian dollar remains above most estimates of its fundamental value, particularly given the further declines in key commodity prices in recent months. It is offering less assistance than would normally be expected in achieving balanced growth in the economy.

Looking ahead, continued accommodative monetary policy should provide support to demand and help growth to strengthen over time. Inflation is expected to be consistent with the 2–3 per cent target over the next two years.

In the Board’s judgement, monetary policy is appropriately configured to foster sustainable growth in demand and inflation outcomes consistent with the target. On present indications, the most prudent course is likely to be a period of stability in interest rates.

Interest Only Loans – The UK Experience

According to APRA, interest only loans continue to grow as a proportion of all home loans. Recently Moodys warned about the increased risks which may stem from this type of loan. So the question is, should we be concerned, bearing in mind the recent RBA commentsindicative of speculative demand motivating a rising share of housing purchases. Consistent with mortgage interest payments being tax-deductible for investors, the interest-only share of approvals to investors remains substantially higher than to owner-occupiers”?

There are a number of reasons why interest only loans are attractive, especially for those using negative gearing. But the main reason is that the monthly payment are lower, thus improving servicability. Here is an example, of a $300,000 Principal and Interest Loan, at a nominal 6.5%. The monthly repayment over 30 years is $1,896.

P&I1However, on an interest only basis, using the same values, the repayment drops to $1,625, more than $250 a month lower. The small problem though is that in 30 years time, you still have to repay the capital balance. Now of course, in real terms the value will be eroded by inflation, and house prices are likely to rise, so the assumption is that the value generated in the property can then be realised, repaying the loan, (or from other sources e.g. superannuation?). In practice, interest rates may move, and sometimes people switch to P&I after a period of time.

P&I2

So, now lets look at the UK experience. There are 11.3 million mortgages in the UK, with loans worth over £1.2 trillion. At the end of 2013 there were an estimated 2.2 million pure interest-only loans outstanding, and a further 620,000 part interest-only, part repayment mortgages outstanding on lenders’ books. Compared to 2012 this represents a fall of around 300,000 pure interest-only mortgages (down 12%), and around 90,000 part-and-part mortgages (down 13%).

According to the Council for Mortgage Lenders, at the peak of their popularity in the late 1980s, interest-only mortgages accounted for more than 80% of all loans taken out. This year, however, lenders are likely to advance only around 40,000 new interest-only loans for residential house purchase, less than 10% of the total.

Among first-time buyers, the decline in interest-only borrowing has been particularly pronounced. CML data shows that only 2% are taking out interest-only mortgages, with 98% opting for repayment loans. Interest-only accounts for a higher proportion of new borrowing by existing owner-occupiers who are moving (10%) and those remortgaging (13%).

Most new interest-only borrowing is in the buy-to-let market (aka investment mortgage), where this option remains the norm for very good reasons. Fixed-rate interest-only mortgages minimise costs for landlords and are more likely to produce a profitable margin. Interest-only mortgages also enable landlords to meet lenders’ requirements that their rental income produces an average minimum cover of 125% of their borrowing costs.

A couple of years back, there were concerns in the UK that interest only loans may be a problem, and alongside regulatory commentary, CML produced an “interest-only toolkit” designed to help mortgage lenders to work with their interest only mortgage customers, especially those loans due for repayment before 2020.

The regulators reached the conclusion that 90% of interest-only mortgage holders have a repayment strategy in place. Lenders made a commitment with the regulator (the Financial Conduct Authority) to contact interest-only loan holders and ask about their repayment plans.  The CML via it lender members found that Lenders have been using a variety of contact strategies. In addition to reminders and mailings requesting the customer’s written response (including questionnaire responses), telephone calls, face-to-face meetings and even home visits are also used by some lenders. Overall, around 30% of customers contacted have so far responded.

Among those borrowers who have responded, around four out of five already had a clear plan. Among those who did not, the survey found that the solutions and approaches lenders are offering typically include term extensions, permanent conversions to capital and interest, and overpayments.

There has also been a positive set of changes in the loan-to-value profile of outstanding interest-only mortgages. Two-thirds of outstanding interest-only mortgages have loan-to-value (LTV) ratios of less than 75% – and the vast majority of these are not due to mature until after 2020.

The chart shows that a large number of loans would have moved into a lower LTV band as a result of house price inflation alone. However, it also shows that borrowers are taking additional action to reduce their mortgage balances, as the effect of house price inflation alone would not have resulted in the improvements in outstanding LTVs that have been seen over the past year. Indeed, the number of loans in every LTV band below 75% would have seen an increase on the basis of house price inflation alone (as loans moved down from higher LTV bands) – but, in fact, every band saw a decrease.

Changes in interest-only loans outstanding, September 2012-December 2013, by LTV

01.05.14-changes-in-interest-only-loans-outstanding-by-ltvUnder the new mortgage regulations now in force in the UK, lenders may offer interest only loans, but only if a borrower has a credible repayment plan, at the time of application.

So some points to ponder.

1. How many interest only loans in Australia have a credible repayment strategy? To what extent is this considered by borrowers and lenders at the time of application?

2. Will rising house prices be the solution to interest-only loan repayment?

3. Are the review processes (on average each 5 years in Australia, even if the loan term is 25/30 years) sufficiently robust to identify potential issues?

4. Does Negative Gearing lead to a greater dependence on interest-only loans?

Big Four Serve Up $28.6bn Profit

The results are now in for the last year from the major banks, and combined they delivered more than $28bn in cash profit, higher than the $27bn last year.

There are several key drivers of profitability, the first is housing lending. Rises in property prices inflates new loans, and the banks’ balance sheets. If the property market takes a turn down, this will have an impact. Net interest margin is down a little (thanks to discounting) but is now being offset by lower deposit rates.

The second is efficiency and some players are doing a lot better than others in excellence of execution, thanks to technology investments, and cultural transformation. This will continue as new technology and channels become ever more mainstream. This may open the door on new competitors, as discussed in our Quiet Revolution report.

The profit contribution from wealth management will continue to grow, as superannuation balances increase thanks to the enforced savings scheme. This may be offset by a reduction in fees. Is FOFA another sleeper? Well, unless the Senate does something surprising, the FOFA regulation will work in the banks favour, so no.

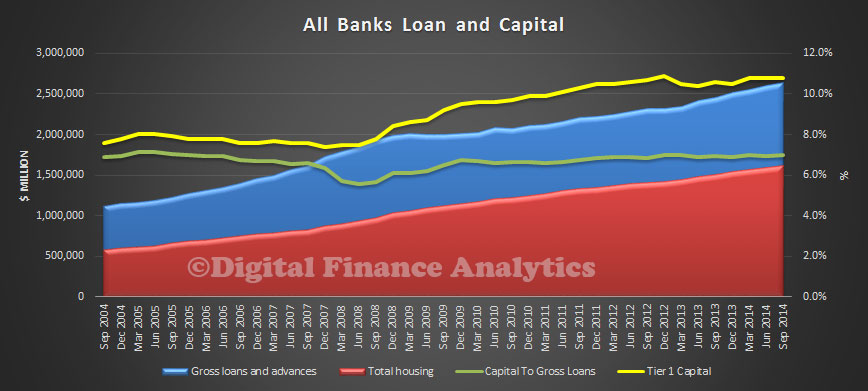
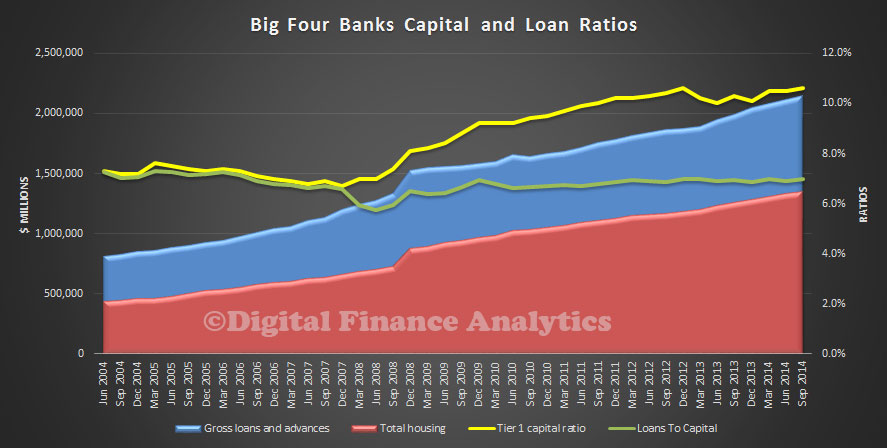
The enigma factor with regards to continuing performance is whether via the FSI or directly, the regulators lift the capital requirements for the majors. There is a strong argument to do this, because as the concentration risks in the mortgage book become an ever larger share of the total book, the Basel III rules mean the banks can get away with ever lower capital reserves. Those within the banks will claim they already have more than enough capital, and would be put at a disadvantage compared to other international players. However, on an international comparison basis, Australian banks are relatively less well capitalised. The current rules also make lending to business less attractive in comparison to home loans. Capital rules may be selectively targetted at property investors and especially those signing up to interest only loans.

If capital requirements are lifted, the banks will have to raise their pricing to match, but on the other hand they can also trim their deposit margins, and tweak their discounting strategies. So, we believe that even if capital requirements were adjusted up, there is really little likely impact on bank profit. Margins and fees in Australia are still relatively high and competition works for the majors.

So, overall, we think that profit landscape is going to remain relatively benign, external economic shocks excepting. Those with a strong local franchise will be best positioned.

Westpac Profit Up 12%

Westpac released their full year results today. Headline was a 12% uplift in statutory net profit, to $7,561 million for the 12 months to 30 September 2014, compared with 2013 results of $6,751 million. Continued focus on the Australian market is clearly paying off. “While all divisions performed well, Australian Financial Services (AFS) has had a particularly strong year. All businesses in AFS delivered double digit earnings growth, with well managed margins and a 6% increase in banking customer numbers. We provided more than $87 billion in new lending to Australian retail and business customers over the year, while growing in line or above system across all key markets in the second half.”

Looking at cash profit, WBC recorded $7.63 billion, an 8 per cent increase on the previous year and slightly ahead of analyst estimates at $7.62bn.

The Group grew at or above system in all key markets in the second half of 2014, including growing at system in Australian mortgages, 1.3x system in household deposits and 1.4x system in business lending.

Net interest income was $13,496 million, up 5%, with an 8% rise in average interest-earning assets and a 7bps decrease in net interest margin to 2.08%. The full year decline in net interest margin principally reflects a lower Treasury contribution, higher levels of liquid assets and lower interest rates impacting returns on capital.

Non-interest income was $6,324 million, a 7% increase, driven largely by another strong performance from the Australian wealth and insurance business, BT Financial Group.

WBC reported an expense to income ratio of 41.6%, which is sector leading; and a further decline in impairment charges which were 23% or $197 million lower.

WBC will pay a fully franked final dividend of 92c to shareholders on the register at November 12. Westpac’s total distribution for the year is$1.82, a 5 per cent lift on the previous year.

We note their continued focus on customer centricity, and the emerging digital strategy, both of which position well for future performance.

Total Housing Lending Now Worth $1.4 Trillion

The RBA financial aggregates, released today, highlight the continued growth in housing lending. The overall summary is shown below:

RBA-Aggregates-Sept-2014

Looking in detail at the housing numbers, owner occupied lending reached $923.1 billion (up 0.46% from the previous month, or $4.2 billion), whereas investment lending reached $475.1 billion (up 0.85% or $4.0 billion). Investment loans now comprise 33.98% of total housing lending, another record. This underscores RBA’s concerns as we highlighted before.

HousingLendingSep2014Total housing lending is now $1.398 trillion, of which, according to APRA $1.288 trillion is from the ADI’s, the balance of $110 billion is from the non-bank sector, and recorded no change (though there are some data issues here).

Monthly Banking Statistics For September Shows Investment Loans Still Running

APRA just released their data for September 2014. This provides a breakdown of balances outstanding by financial institution across the main lines of business. This only includes players within their bailiwick.

Looking at home loans first, total balances rose from $1.28 to $1.288 trillion, with investment loans rising by 0.85% to $446.3 billion, and owner occupied loans by 0.44% to $841.1 billion. So investment lending forged ahead, again.

Looking at the relative shares, we see CBA with 27.2% of the owner occupied market, and Westpac with 31.9% of the investment home loan market. Together the two Sydney-based players dominate.

HomeLoanSharesSept2014We see that Bank of Queensland and Westpac have relatively the largest share of investment loans in their loan portfolios.

HomeLoanBalancesSept2014Looking at the month on month movements, we see the most significant movements in investment loans at Westpac and CBA. We also see Macquarie active on the investment loan front, wth a growth of 3.8% month on month, they grew their investment book the fastest. Macquarie also grew their owner occupied loan portfolio the fastest, at 2.7%.

HomeLoanMovementsSept2014Turning to deposits, total balances were up 1.03% month on month, to a total of $1.77 trillion. Looking at the individual players, CBA and WBC have dominant positions.

DepositSharesSept2014In relative terms, HSBC (3.2%) and CBA (2.3%) grew balances the fastest, Bank of Queensland and Rabobank both lost balances.

DepositMoveentsSept2014Switching to Credit Cards, balances fell slightly in the month, at $40.2 billion. There is little change in the individual portfolios amongst the big four and Citigroup.

CreditCardBalancesSept2014


CreditCardSharesSept2014

ANZ Lifts Profit 10%

In a contrast to Nab yesterday, ANZ’s full year results today are striking. In the year to September 30, ANZ delivered a cash profit of $7.12 billion which is a 10 per cent increase on last year’s result. This is in line with forecasts. Full-year net profit increased 15 per cent to $7.27bn, while operating income rose 8 per cent to $20.054bn. The net interest margin fell slightly, to 2.13 per cent, from 2.22 per cent, reflecting strong competition for loans.

Cash profit from Asia increased 25 per cent and revenue by 10 per cent in the full-year. The bank’s international business in Asia Pacific, Europe and America now accounts for 24 per cent of group revenues. Cash profits in those areas increased 20 per cent to $1.2bn. In contrast, the Australian region’s cash profit was up one per cent at $4.4bn.ANZ-Results2014

Nab’s Long Winding Road Home

Nab released full year results to September 2014 today. From the ASX announcement we see:

Cash earnings declined to $5.18 billion, which is 9.8% below the September 2013 full year due to earnings adjustments announced on 9 October 2014 relating to UK conduct provisions, capitalised software impairment, deferred tax asset provisions and R&D tax policy change totalling $1.5 billion after tax for the 30 September 2014 full year.

Excluding the impact of changes in foreign exchange rates, actual revenue declined 1.1%. After exchange rate adjustments, revenue increased by approximately 1.9% with higher lending balances, partly offset by a lower net interest margin (NIM) and weaker Markets and Treasury income.

Expenses rose 0.7 % excluding the impact of changes in foreign exchange rates and one-off adjustments. Adding in the impact of higher UK conduct provisions, capitalised software impairment and R&D tax policy change expenses rose 21%. Excluding these items and prior period UK conduct charges relating to PPI and IRHP, expenses rose 4.5% over the year.

Improved asset quality and deliberate portfolio choices made over recent years have resulted in a total charge to provide for bad and doubtful debts (B&DDs) for the year of $877 million, down 54.7% on 30 September 2013 due primarily to lower charges in Australian Banking and NAB UK CRE (Corporate Real Estate). The charge includes a $50 million release from the Group economic cycle adjustment and $99 million release from the NAB UK CRE overlay

The Group maintains a well diversified funding profile and has raised approximately $28.2 billion of term wholesale funding (including $7 billion secured funding) in the 2014 financial year. The weighted average term to maturity of the funds raised by the Group over the 2014 financial year was 5.1 years. The stable funding index was 90.4% at 30 September 2014, a 1.2 percentage point increase on 30 September 2013.

The Group’s Basel III Common Equity Tier 1 (CET1) ratio was 8.63 % as at 30 September 2014, an increase of 20 basis points from 30 September 2013 and broadly stable compared to 31 March 2014. As announced in the March 2014 half year results, the Group will target a CET1 ratio of 8.75% – 9.25% from 1 January 2016, based on current regulatory requirements.

The final dividend has been maintained at 99 cents, fully franked, and a dividend reinvestment plan (DRP) discount of 1.5% will be offered with no participation limit. NAB has entered into an agreement to have the DRP on the final dividend partially underwritten to an amount of $800 million over and above the expected participation in the DRP. Assuming a DRP participation rate of 35%, these initiatives will provide an expected increase in share capital of approximately $1.6 billion, which is equivalent to a 44 basis point increase in NAB’s CET1 ratio.

DFA believes the challenge for the bank is to get their Australian franchise to fire consistently, leveraging their footprint in home lending, business banking and wealth management. This will be a long and hard journey because it will be a question of excellence in execution, effective customer segmentation, and the removal of toxic customer servicing experiences, enabled by continued technology investment. We would also expect to see a continued withdrawal from the overseas ventures, which consistently underperformed.  Overall, we believe NAB will become ever more reliant on the local Australian and New Zealand businesses, and that the long winding road of offshore investments will lead to further divestments. The truth is that the big four have a natural advantage in their home markets (high margins, benign competition and gentle regulation) and Australian banks find it very hard to perform consistently in the high-competition markets of the UK and USA. But Nab will have to work hard to break the cultural, process and systems barriers which beset the bank.

Finally, a release in provisions made a significant positive contribution this time around, but will not always be available.

nabtrendpriceChart source ASX.

ASIC’s Annual Report Tabled

ASIC’s annual report for the 2013–14 financial year was tabled on Wednesday 29 October 2014 in the Australian Parliament. Its 185 pages highlights the broad range of issues ASIC covers, and connects back to their earlier strategy release. DFA found some interesting nuggets of information in the 6 year trends table.

There has been a steady rise in the number of companies in Australia, with over 2.1 million operating. Last year more than 212,000 new companies were registered, whilst about 85,000 closed.

ASIC-2014-1There was a steady rise in the number of Australian Financial Services Licenses issued, including a number of limited licenses to Accountants enabling them to offer financial advice. On the other hand, the number of registered Managed Investment Schemes (MIS) fell, explained partly by the collapse of agribusiness schemes such as Timbercorp and Great Southern.

ASIC-2014-2Finally, we note that the number of registered Auditors fell a little, now below 5,000 (despite the rise in companies), as there has been considerable consolidation in the audit sector; whilst the number of entities registered as Liquidators rose slightly.

ASIC-2014-3

Managing Global Finance As A System

Andrew Haldane, Chief Economist of the Bank of England, gave the annual Maxwell Fry lecture on Global Finance at Birmingham University.  There are some powerful observations here, relevant to the Australian context, as well as the potential to amplify risks associated with a more interconnected world. He also takes macroprudential discussions further.

Andrew’s main theme was the growing size and complexity of global capital flows between countries.  He noted that ‘cross-border stocks of capital are almost certainly larger than at any time in human history’. And the apparent independence of domestic investment from domestic saving suggests that ‘measured levels of global capital market integration … remain at higher levels than at any point in history’. He discussed how this can be ‘double-edged’ from a financial stability perspective: it both shares risk (which can be stabilising) but also spreads and amplifies risk (which can be destabilising) – potentially generating ‘more frequent and/or larger dislocations’.

He argued that many lessons have been learned from the financial crisis, not least the need to ‘safeguard against systemic risk’. Yet when it comes to the fortunes of the international monetary system ‘it is far from clear that these lessons have been learned, much less that the international rules of the road have been reformed’. ‘Arguably, the rules of the road for this system have failed to keep pace with the growing scale and complexity of global financial flows’.

One of the consequences of the growth in cross border capital flows is ‘the steady rise in the degree of co-movement in asset prices over time’. Cross-border spillovers are becoming more important and global common factors more potent. A particular example is the behaviour of yield curves across countries. ‘To a first approximation, global yield curves appear these days to be dancing to a common tune’.

Andrew identified four areas where the global financial system could be strengthened:

a) Improve global financial surveillance, by tilting IMF surveillance away from monitoring individual country risk and towards multilateral surveillance and having more real-time tracking of the global flow of funds.

b) Improve country debt structures, for example by encouraging countries to issue GDP linked bonds, or Contingent Convertible (CoCo) bonds.

c) Enhance macro-prudential and capital flow management policies. For example, he suggests that ‘total credit follows a global cycle that has strengthened over time’ in which case ‘there may in future be a case for national macro-prudential policies leaning explicitly against these global factors’ taking international macro-prudential policy co-ordination ‘to the next level’. This next phase of macro-prudential policy may see measures ‘targeted at particular markets, as well as particular countries’.

d) Improve international liquidity assistance, for example by increasing the resources available to the IMF.