
APRA just released their statistics for the September 2014 quarter on the MySyper products which were part of the suite of superannuation reforms. The data must be treated with care, as some fees are not charged every quarter, but it does give a cross industry member view of performance returns. What is interesting is the apparent disconnect between the relative fees taken, risk profile, and returns. The interim Quarterly MySuper Statistics report contains data for all MySuper products. The report contains information on the product profile; product dashboard information reported to APRA on return target, investment risk and fees and costs; asset allocation targets and ranges; and net investment return and net return for each MySuper product, or where relevant, for the lifecycle stages underlying a MySuper product with a lifecycle investment strategy.
We have been looking at the MySuper products with single investment strategy data, and pulled out three measures, relative return to members in the quarters, relative fees paid, and relative risk profile. As there are more than 80 funds, we have not included all in the table labels in the chart below. APRA defines a Representative member as a member who is fully invested in the given investment option, who does not incur any activity fees during a year and who has an account balance of $50,000 throughout that year. Excludes: investment gains/losses on the $50,000 balance. The risk rating is based on the level of investment risk which represents the estimated number of years in each 20 years that the RSE licensee estimates that negative net investment returns will be incurred.
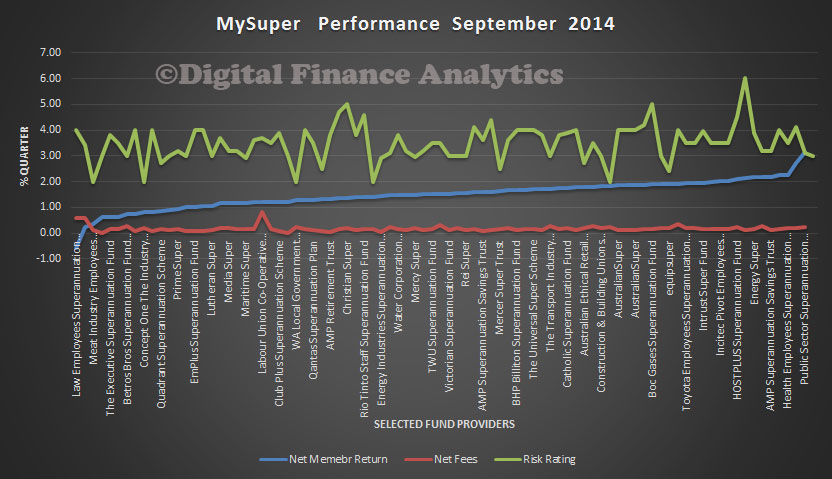 It would be possible, for the same level of fees to get a return of well over 2%, or below 1%. The relative risk does not correlate to returns at all. Fees are not correlated with performance. This provides an important window on the superannuation industry, but the data needs to be presented in ways which are clearer for people to interpret. Hopefully it will help to lift understanding amongst investors, and more proactively consider the performance of superannuation.
Finally, total assets in MySuper products was $378.1 billion at the end of the September 2014 quarter. Over the 12 months to September 2014 this represents a 128.2 per cent increase.