August Lending Data Released

The ABS released their data series for August covering the entire lending spectrum (the housing details were released previously).

The total value of owner occupied housing commitments excluding alterations and additions fell 0.1% in trend terms, and the seasonally adjusted series fell 2.0%.

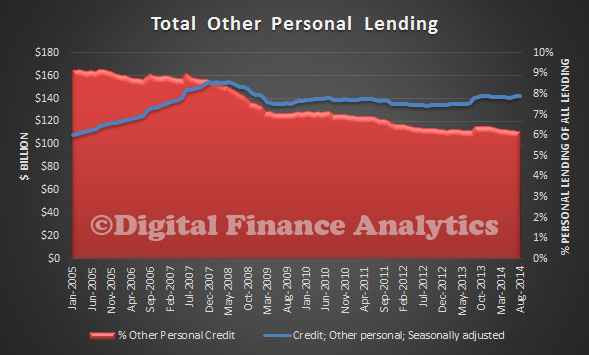
The trend series for the value of total personal finance commitments rose 1.0%. Fixed lending commitments rose 1.0% and revolving credit commitments rose 0.9%. The seasonally adjusted series for the value of total personal finance commitments rose 5.2%. Revolving credit commitments rose 5.9% and fixed lending commitments rose 4.7% .

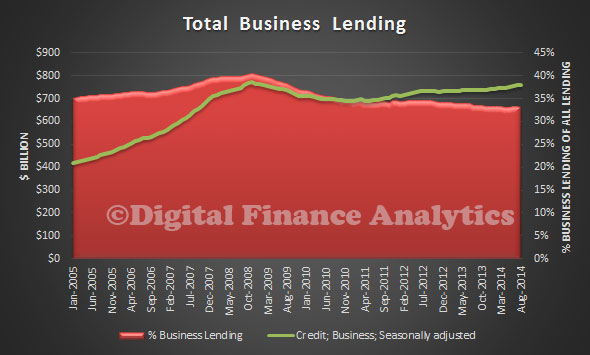
The trend series for the value of total commercial finance commitments rose 0.2%. Revolving credit commitments rose 0.4% and fixed lending commitments rose 0.1%. The seasonally adjusted series for the value of total commercial finance commitments fell 16.3% in August 2014, after a rise of 3.4% in July 2014. Fixed lending commitments fell 18.6%, after a rise of 21.0% in the previous month. Revolving credit commitments fell 9.6%, following a fall of 26.8% in the previous month.

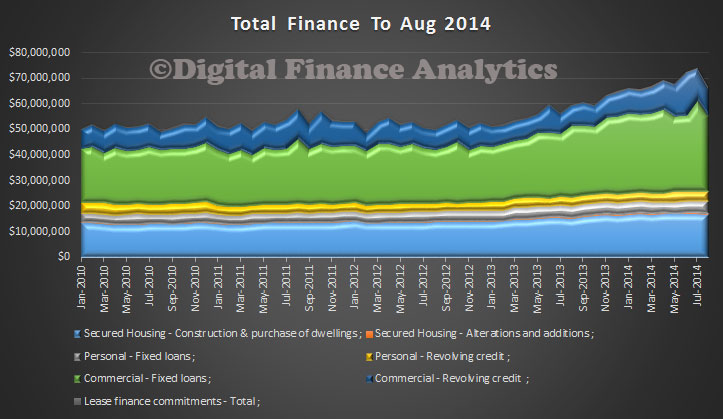
The trend series for the value of total lease finance commitments rose 1.1% in August 2014 and the seasonally adjusted series rose 8.7%, after a fall of 7.3% in July 2014.

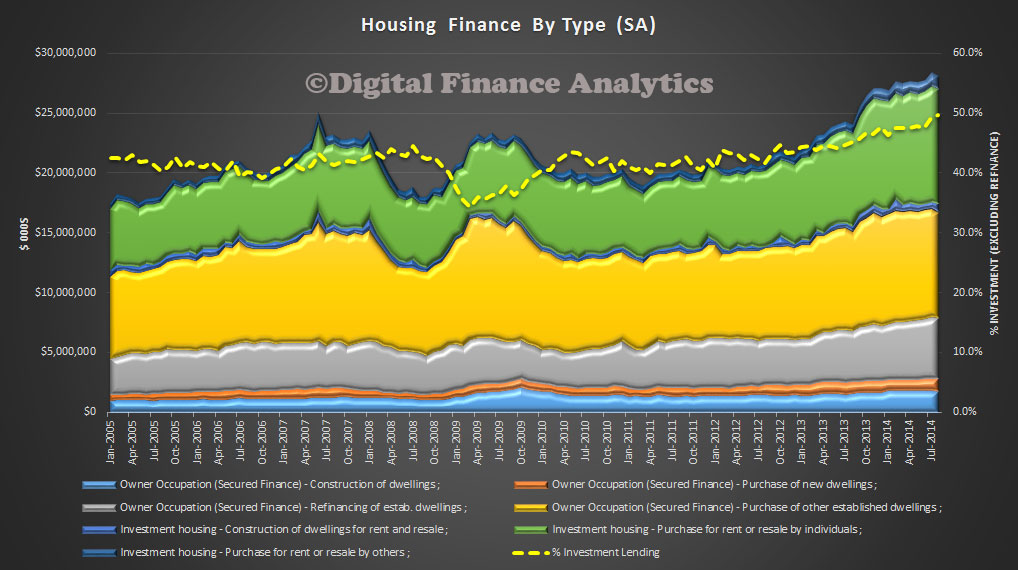
This chart shows the seasonally adjusted flows for all finance categories.

FinanceAugust2014
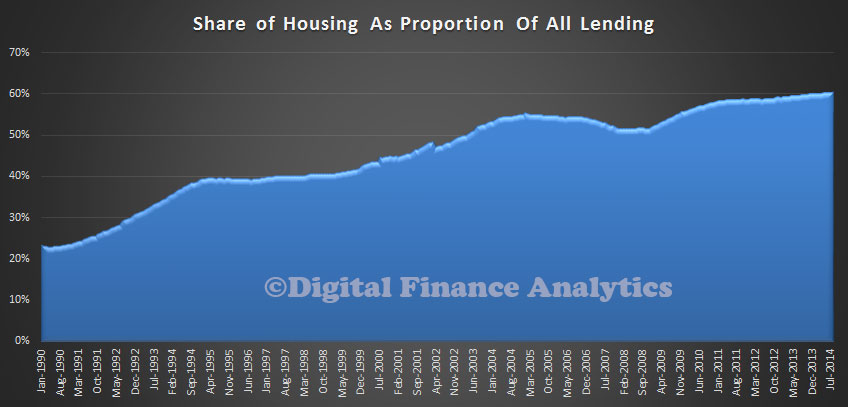
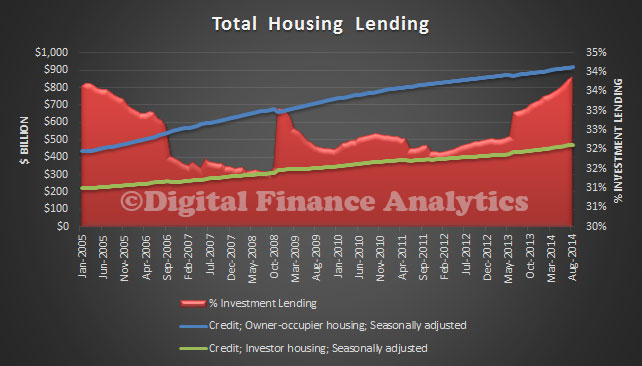
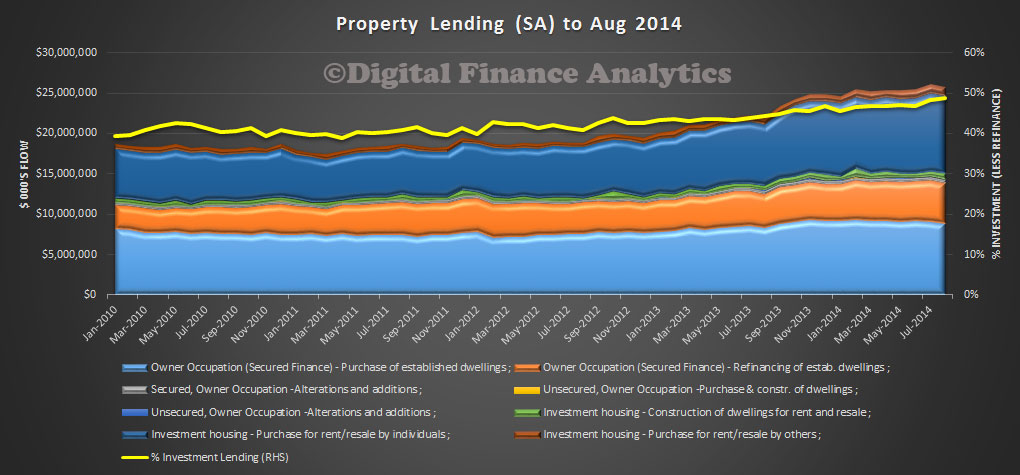
Looking at property, we again see the investment lending sector strong, at close to 50% of all property lending, excluding refinancing.

PropertyLendingAug2014
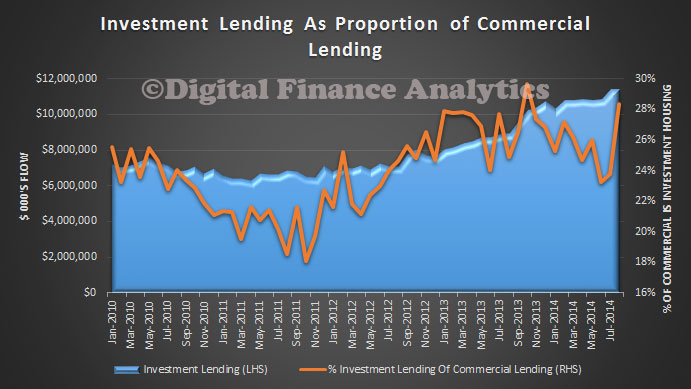
Finally, we look at the share of investment lending as a proportion of all commercial lending. We see it sits above 20%, with a surge recently. The dynamics here are interesting, does if represent a fall in other business lending categories, or a replacement by rising investment property lending?

CommercialPropertyLendingAug2014The other gap in the data is the number of new properties purchased as investment properties (this is different from investing in building new property). This is an important data point because one of the arguments proffered by some is that negative gearing supports new builds. Our own survey data suggests this is not the case, and most investment lending which is negative geared is going to established property.

The Rise And Rise Of The Bank Of Mum and Dad

As part of the DFA household surveys, we segment the housing market, to identify those who want to buy and first time buyers, as well as those down trading, the affluent, suburban and seniors. We described the full segmentation recently.  Today we look at those who are trying to buy. This group has been under pressure as prices rise, incomes stall, and property supply is limited.

One striking fact is the number of households in this group who are now banking with the “Bank of Mum and Dad”. The proportion of households who are borrowing from parents, or who are planning to, has been increasing steadily. The chart below shows the proportion who are relying on Mum and Dad Bank, and we also plot relative house price growth over the same period. This is an Australian average, there are state variations.

Mum-and-Bank-1We then looked at the average amount being supplied by parents. In 2010 is was around $22,000. Today it is over $60,000. We also tracked the percentage increase year on year for transactions assisted by parent loans. Since May 2013, there has been significant growth.

Mum-and-Bank-2We then looked at which household segments the funds were coming from. Down traders are the largest group, (there are over one million down traders in Australia at the moment) and growing as a percentage of all households, whereas suburban households (who themselves have larger loans now) figure less.

Mum-and-Bank-3We also discovered that about half of these loans were made interest free, the other half, charged at a rate of interest at or below the market.

So, it is clear the Bank of Mum and Dad is a significant factor in the housing market, and the second order impact of down traders, is significant. It also means that if property prices were to slip, some down traders may find their generous family loans get eaten up in negative equity.

The low first time buyer rates would be even more adverse, without this extra assistance!

Investors Burn Bright, First Time Buyers Sidelined (Again)

The monthly ABS housing finance data was released today for August. In a way, nothing new here, as first time buyers continue to be squeezed out, and investors dominate. The trend estimate for the total value of dwelling finance commitments excluding alterations and additions rose 0.3%. Investment housing commitments rose 0.9% while owner occupied housing commitments fell 0.1%. In seasonally adjusted terms, the total value of dwelling finance commitments excluding alterations and additions fell 1.2%.

In trend terms, the number of commitments for owner occupied housing finance fell 0.2% in August 2014. In trend terms, the number of commitments for the purchase of established dwellings fell 0.3% and the number of commitments for the construction of dwellings fell 0.2%, while the number of commitments for the purchase of new dwellings rose 1.7%. In original terms, the number of first home buyer commitments as a percentage of total owner occupied housing finance commitments fell to 11.8% in August 2014 from 12.2% in July 2014.

Looking at the first time buyer data, we see they are lowest in NSW and VIC (where the investment market is hottest), but we also see down trends in WA and SA. This confirms our surveys that first time buyers cannot compete.

HousingFinancePC-FTBStateAugust2014Looking at investment lending we see that nearly 50% of all lending in August (if you exclude refinance) was for investment purposes.

HousingFinanceInvAugust2014

Household Debt Burden Increases Again

Using the RBA household ratios, we can look at the effect of debt on the average household. It blows up the myth of “household deleveraging”, much talked about after the GFC. Whilst the average data masks the differences between different household segments (see the segmented analysis in our survey and we know debt is becoming more concentrated in some households, whilst others pay down), it can tell a story. The first chart shows the ratio of housing debt to income, and we see it has been rising steadily since 2013, and is substantially higher than in 2000. The other point to note is that the ratio of housing debt to assets is down a bit, thanks to house prices rising faster than debt. However, households have never been so in debt.

HouseholdRatios2Another way to look at the data is to compare the ratio of interest payments to (quarterly) average income. We see that with rates currently low, the ratio is down from its high in 2008. However, it is worth noting the average home loan rate has fallen further compared with the housing interest payment to income ratio. This is because relative to income the average mortgage is bigger today – reflecting elevated prices and higher loan to value ratios.

HouseholdRatios1This is consistent with the loan to income ratios we highlighted earlier and a fall in real incomes. More evidence the RBA should act!

Macroprudential Bites in the UK – Bank of England

The Bank of England (BoE) recently published their Q3 Credit Conditions Survey. This is the first edition since the recent Mortgage Market reforms were introduced, and the macroprudential controls were tabled. Looking specifically at secured lending to households they report that demand for credit has eased, and the proportion of higher loan to value loans has reduced. In other words macroprudential is biting!

After eight consecutive quarters of expansion, lenders reported that the availability of secured credit to households fell significantly in the three months to early-September.

BoECreditOct2014The contraction in overall availability was reported to be driven by a changing appetite for risk and lenders’ expectations about house prices. Many lenders noted that operational issues associated with the implementation of the Mortgage Market Review had pushed down on credit availability over the summer. And some lenders commented that they had tightened availability a little in response to the recommendations made by the Financial Policy Committee to mitigate risks stemming from the housing market.

Credit availability was reported to have fallen in Q3 both for borrowers with loan to value (LTV) ratios below 75% and for borrowers with LTV ratios above 75%.  Lenders also reported that they had become less willing to lend at LTV ratios above 90% for the first time since the question was introduced in 2013, and some noted that they had introduced policies which restrict lending at high loan to income (LTI) ratios.

Consistent with a tightening in credit availability, credit scoring criteria for granting household loan applications were reported to have tightened in Q3 and the proportion of household loan applications being approved fell.

Ireland Joins The Macroprudential Bandwagon

In the paper released by the Central Bank of Ireland, it is clear they have gone macroprudential! According to the Irish Times new rules will be applied to mortgage lenders in Ireland from 1 January 2015. A 2 month consultation period now starts, so they may get tweaked before implementation. The UK had announced parallel measures earlier.

New mortgage rules published today mean that most house buyers will have to have a 20 per cent deposit when applying for a home loan. The regulations come into force on January 1st.

The Central Bank is proposing that no more than 15 per cent of all new mortgages for private dwelling homes should have a loan to value (LTV) ratio above 20 per cent. This means that most first-time buyers are now going to be expected to have at least a 20 per cent deposit when buying a home.

In addition, it has also decided that just one-fifth of new mortgages should be issued above a level of three and a half times income (LTI).

In the case of buy-to-let properties, no more than 10 per cent of the value of all new loans should have an LTV above 80 per cent.

The Central Bank’s deputy governor said these measures should help to avoid another property crash in Ireland and dampen the rate of price rise currently being experienced in the market.

“Our research has shown there is strong evidence that mortgage losses are much higher where borrowers have a high LTV or LTI rate,” he said. “We believe that measures such as these are a standard part of a well regulated financial system and introducing these precautionary measures should contribute to a stable and well-functioning mortgage lending market.”

The regulator said the income caps would be “more binding” than the LTV ratios in a period of boom as pay levels could never keep pace with soaring property prices.

The LTV caps are not “completely counter-cyclical” as loan values will rise in line with property prices.

Certain exemptions are proposed to the new rules. These cover residual debt from home loans in negative equity, switcher mortgages, and home loans in arrears. Buy-to-let borrowers will also be exempt from the income restrictions.

Here is the Economist’s comparison chart, showing UK, Ireland and Australia – and we thought we had a problem!

EconomistIrelandOct2014

IMF On Macroprudential – It Works!

In the just release IMF World Economic Outlook, as well as revising down growth estimates, they discuss macroprudential, highly relevant in the light of RBA comments. The main observations are:

  1. there is evidence that macroprudential can assist in manage house price growth, and credit growth. Different settings should be applied to different types of purchases, e.g. differentiate first time buyers from multiple investors, but
  2. it is less effective if the cause of extended price rises stems from overseas investors, who bypass local controls and credit policy, so specific separate measures may need to be used to target foreign investors
  3. need to make sure business is not simply redirected to the non-bank sector, and
  4. supply side issues also need to be addressed.

RBA please note! The comments in full from the IMF are below, and worth a read. In particular they cite a number of success stories, so macroprudential is perhaps more proven than many would like to admit.

Many countries—particularly those in the rebound group—have been actively using macroprudential tools to manage house price booms. The main macroprudential tools employed for this purpose are limits on loan-to-value ratios and debt-service to-income ratios and sectoral capital requirements. Such limits have long been in use in some economies, particularly in Asia.

IMFSurveyMacroPrudOct2014For example, Hong Kong SAR has had a loan-to-value cap in place since the early 1990s and introduced a debt-service-to-income cap in 1994. In Korea, loan to-value limits were introduced in 2002, followed by debt-service-to-income limits in 2005. Recently, many other advanced and emerging market economies have followed the example of Hong Kong SAR and Korea. In some countries, such as Bulgaria, Malaysia, and Switzerland, higher risk weights or additional capital requirements have been imposed on mortgage loans with high loan-to-value ratios. Empirical studies thus far suggest that limits on loan-to-value and debt-service-to-income ratios have effectively cooled off both house price and credit growth in the short term.

Implementation of these tools has costs as well as benefits, so each needs to be designed carefully to target risky segments of mortgage loans and minimize unintended side effects. For instance, stricter loan-to value limits can be applied to differentiate speculators with multiple mortgage loans from first-time home buyers (as in, for example, Israel and Singapore) or to target regions or cities with exuberant house price appreciation (as in, for example, Korea). Regulators also should monitor whether credit operations move toward unregulated or loosely regulated entities and should expand the regulatory perimeter to address the leakages if necessary. For example, when sectoral macroprudential instruments are used to limit mortgage loans from domestic banks, they can be circumvented through a move to nonbanks (as in, for example, Korea) or foreign banks or branches (as in, for example, Bulgaria and Serbia). Macroprudential tools may also not be effective for targeting house price booms that are driven by increased demand from foreign cash inflows that bypass domestic credit intermediation. In such cases, other tools are needed. For instance, stamp duties have been imposed to cool down rising house prices in Hong Kong SAR and Singapore. Evidence shows that this measure has reduced house demand from foreigners, who were outside the loan-to-value and debt-service-to-income regulatory perimeters. In other instances, high house prices could reflect supply bottlenecks, which would need to be addressed through structural policies such as urban planning measures.


RBA Leaves Rates On Hold, Again

At its meeting today, the Board decided to leave the cash rate unchanged at 2.5 per cent.

Growth in the global economy is continuing at a moderate pace. China’s growth has generally been in line with policymakers’ objectives, though some data suggest a slowing in recent months. Weakening property markets there present a challenge in the near term. Commodity prices in historical terms remain high, but some of those important to Australia have declined further in recent months.

Volatility in some financial markets has picked up in recent weeks. Overall, however, financial conditions remain very accommodative. Long-term interest rates and risk spreads remain very low. Markets still appear to be attaching a low probability to any rise in global interest rates or other adverse event over the period ahead.

In Australia, most data are consistent with moderate growth in the economy. Resources sector investment spending is starting to decline significantly, while some other areas of private demand are seeing expansion, at varying rates. Public spending is scheduled to be subdued. Overall, the Bank still expects growth to be a little below trend for the next several quarters.

Labour market data have been unusually volatile of late. The Bank’s assessment remains that although some forward indicators of employment have been firming this year, the labour market has a degree of spare capacity and it will probably be some time yet before unemployment declines consistently. Growth in wages has declined noticeably and is expected to remain relatively modest over the period ahead, which should keep inflation consistent with the target even with lower levels of the exchange rate.

Monetary policy remains accommodative. Interest rates are very low and have continued to edge lower over recent months as competition to lend has increased. Investors continue to look for higher returns in response to low rates on safe instruments. Credit growth is moderate overall, but with a further pick-up in recent months in lending to investors in housing assets. Dwelling prices have continued to rise over recent months.

The exchange rate has declined recently, in large part reflecting the strengthening US dollar, but remains high by historical standards, particularly given the further declines in key commodity prices in recent months. It is offering less assistance than would normally be expected in achieving balanced growth in the economy.

Looking ahead, continued accommodative monetary policy should provide support to demand and help growth to strengthen over time. Inflation is expected to be consistent with the 2–3 per cent target over the next two years.

In the Board’s judgement, monetary policy is appropriately configured to foster sustainable growth in demand and inflation outcomes consistent with the target. On present indications, the most prudent course is likely to be a period of stability in interest rates.

This was in line with expectation, despite some calling for a rise to signal the markets in relation to speculative housing. However, these ultra-low rates cannot last for ever, and the average mortgage rate is closer to 7% rather than the current 4.75%.

RateTrend


RBA Highlights Housing Supply Issues And Lending Regulation

The RBA made a statement today to the Inquiry into Affordable Housing. Several points to note:

1. They recognise the high price to income ratio we currently have, but also state that low rates make larger mortgages affordable.

  • the ratio of housing prices to incomes is at the top of its historical range; but
  • over time, this has been more than offset by falls in financing costs, so that the typical repayment burden as a share of income is not particularly high. This of course does not rule out affordability problems in particular market segments or for particular types of households.

The recent data from the Economist shows the relative data of prices against average income in different countries.EconomistAug2014-IncomeTrend2000s

2. Supply of mortgages is not a constraint

there is no shortage of housing finance in Australia. Housing loan interest rates are currently as low as they have been in a generation, and households are not artificially constrained from borrowing as much as they can reasonably be expected to repay. I have already made the point that perceptions of affordability will differ across different types of households; but, if there is a perceived affordability problem in Australia, it is not due to a lack of finance.

3. There are property supply problems

It is the supply response that determines the extent to which additional demand results in higher prices over time. Our submission highlights that Australia faces a number of longstanding challenges in this area, including regulatory and zoning constraints, inherent geographical barriers and the cost structure of the building industry. There are also obstacles to affordable housing created by Australia’s unusually low-density urban structure, though this is gradually changing.

4. Lending practice reinforcement and other measures are on the cards

the Bank said in its Financial Stability Review last week that the composition of housing and mortgage market activity is becoming unbalanced. The review also indicated that we are discussing with APRA steps that might be taken to reinforce sound lending practices, particularly for investor finance, though not necessarily limited to that.

I want to emphasise that the banks in Australia are resilient, and mortgage lending in this country has historically been relatively safe. APRA has, however, noted a trend to riskier lending practices, and over the past couple of years has been seeking to temper these through its supervisory activities. There are also broader concerns with the macroeconomic risks associated with excessive speculative activity, since this activity can amplify the property price cycle and increase risks to households.

Our discussions with APRA and other agencies on these matters are ongoing, and there will be more to say about them in due course

Total Housing Lending Hits Another High At $1.39 Trillion – RBA

The monthly Financial Aggregates from the RBA for August are out, and shows yet another growth in housing lending. Total housing credit grew at an annual 6.7%, business credit at 3.2% and personal credit 1.1%. Total housing was $1.39 trillion, and now represents 60.7% of all bank lending, the highest it has ever been. In 1990, housing lending was 23% of all bank lending. The red area chart shows the relative proportion of housing lending, compared with all lending. The difference between the APRA number of $1.28 trillion represents the non-bank sector.

TotalHousingPCLendingAugust2014Here is the lending mix data right back to 1990 showing the proportion of the banks books in housing finance, as a total of all lending.

LendingTrends1990August2014Looking at the mix of housing loans, investment lending makes up 33.9% of all housing lending, it has never been higher. Owner occupied lending was worth $919 billion, and investment lending, $471 billion.  These are all seasonally adjusted numbers. The red area chart shows the relative proportion of investment housing lending, compared with all housing lending.

TotalHousing-LendingAugust2014Looking at the relative growth, we see that investment lending grew 0.8% last month, whilst owner occupied loans grew 0.4%, seasonally adjusted.

MonthlyHousing-LendingAugust2014The 12 month averages, which smooth some of the noise in the data shows strong investment growth, at 9.2%, the strongest for several years, (the all time high was in the credit fueled heights of 2003. when it reach more than 25%). Owner occupied growth was slower at 5.4%, but still the strongest since 2012.

12MonthHousing-LendingAugust2014Looking at business lending, we see it falling as a proportion of all lending, to 33%, and worth $760 billion. The red area chart shows the relative proportion of business lending, compared with all lending.

TotalBusinessLendingAugust2014Personal credit (other than housing) fell to 6% of all lending, and worth $142 billion. The red area chart shows the relative proportion of other personal lending, compared with all lending.

TotalPersonalLendingAugust2014Our banks are more and more reliant on housing lending, raising questions about concentration risks, should housing take a negative turn. We encourage the FSI to consider seriously the steps needed to re-balance the equation.