House Prices Match Income Growth – RBA

Luci Ellis, Head of Financial Stability Department spoke to the Australian Housing and Urban Research Institute (AHURI) Panel Roundtable. You can hear her remarks, and a transcript is promised later. My notes follow.

  • Cross country comparisons on housing markets are important, but sometimes comparisons need to be used with care, e.g. specific issues like overbuilding in USA and Ireland had significant impacts. There are differences which need to be understood. Canada is a better comparator for Australia, with a similar geographic footprint but they do have some differences such as fixed rate mortgages, and the government takes tail risk as mortgage insurer.
  • There is much more data post GFC on housing related issues, BIS, IMF, etc. proved richer data. The latest data has changed the perspectives, but many conversations have not caught up yet. For example, housing prices corrected for inflation, shows Australia is not one of the “boomier” countries and prices have not materially grown faster than household incomes. There is evidence of risk in the system as shown by the house prices fall (in Sydney and nationally) if you look back over the past 15 years. Overall housing prices have tracked income.
  • Financial liberation has been one of the drivers to lift house prices relative to income, alongside credit constraints and high inflation. Inflation is lower now, though credit constraints still exist, for example, ratio of serviceability, is an important indicator. As inflation falls, loan to income ratios can be higher.
  • This change in the loan size does has important macroeconomic implications. But mortgage repayments are lower now, thanks to low interest rates. Household savings ratio turned up 2005, before the crisis.
  • Housing crashes do not improve affordability. Need to focus on where real unaffordability lives, e.g. renters who cannot afford to buy.
  • There are risks attached to overbuilding as seen overseas. Supply in Australia is increasing and it is needed, and intended as part of handover from mining investment boom. Building approvals are around 200,000 a year – bit higher than in the past thanks to more high density properties and strong population growth. But we need to understand the composition of the population growth. For example look at migration by visa type – student numbers picked up in the last two years. Students want to live in apartments in inner areas near universities. That’s where lots of the new building is in for example Sydney. There is a premium to be closer in, and it has increased in recent times.
  • There are implications for policy makers from local planning issues. Dublin example, building needs to be in the right areas. We do not build new towns in Australia, maybe we should have a long term plan for new Cities.
  • There is little speculative building in Australia (compared with other countries). Instead demand is from small investors, and future demand is more linked to expected house price growth.
  • Getting the right balance between supply of property and finance is important.

Some observations. First, average income and house prices mask the differences, many household segments in our analysis are worst today. Second, household savings ratios are being buttressed by inflated housing, and appear to be falling and they so vary by segment. Third, we see incomes in real terms falling, so what does that say for future house prices growth? We feel that RBA’s story is therefore over optimistic, despite some interesting points. What if interest rates do rise?

Where The European Banks’ Bodies Are Buried

Over the weekend there was a lot of coverage on the results from the European Central Bank’s stress testing – looking at how banks would respond if for example, house prices were to fall, or exchange rates move significantly. Actually, of the 130 banks tested, 25 failed, but many were smaller players in southern Europe, and are already in the process of plugging the gaps. Stress tests by their nature are imprecise, and market reaction was as expected.

The much more interesting aspect though was the parallel testing under the Asset Quality Review. According to the Economist, this was only applied to 123 big banks in the euro zone’s 18 countries, which from next month will be regulated by the ECB instead of national watchdogs.

The ECB found €136 billion in troubled loans banks had not fessed up to, bringing the European total to €879 billion ($1.1 trillion). Italy will have to implement the biggest reclassification of loans (€12 billion), with Greek (€8 billion) and German banks (€7 billion) also challenged.

Many banks that thought they might fail the tests have raised over €45 billion in equity, strengthening them considerably. That explains why only 12 banks will have to unveil plans to raise capital when 25 have apparently failed, including Eurobank in Greece, Monte dei Paschi di Siena in Italy and Portugal’s BCP, the only three with more than €1 billion to raise. They now have to come up with plans to strengthen their balance sheets.

These tests are as much a stress test of the European Central bank which is taking on an ever more important role, as the individual banks themselves.


ASIC’s “Motherhood and Apple Pie” Strategic Outlook

ASIC has just released their Strategic Outlook. “Our Strategic Outlook sets out the trends shaping our regulatory focus and examples of our responses to key risks we see in 2014–15. Next financial year, we will build on this initiative and publish a detailed Risk Outlook and Strategic Plan.”

There is an interesting set of issues highlighted. For example, a statement about the potential for Digital disruption.

Traditional business models in financial services and markets are being disrupted by new digital strategies at an accelerating pace. In financial services, crowdfunding and peer-to-peer lending platforms are disrupting traditional ways of accessing capital. In our markets, we see digital disruption in high-frequency trading and dark liquidity. These strategies offer investors and financial consumers additional ways of interacting with our financial services and markets, create competition, and raise new challenges for firms and regulators. We expect continuing developments to create additional opportunities for digital disruption, including:

  • more advances and take-up in the use of mobile technology for financial transactions, online investment advice, and peer-to-peer platforms that connect investors and businesses seeking finance
  • increased use of ‘big data’ by financial services providers to customise their marketing, and
  • increased opportunities to engage and empower consumers through interactive data innovations, such as calculators and product comparison tools.

The potential of digitisation in the financial system is yet to be fully realised. Firms and regulators need to continue to work together to harvest the opportunities from digital disruption, while mitigating the risks – in particular, we need to think about how we achieve outcomes in an increasingly digital world.

They also highlight the main areas of potential risk, using a simple framework.

ASIC-Risks

  1. Poor conduct of some gatekeepers, companies, principals and intermediaries can jeopardise market integrity and investor outcomes
  2. Weak compliance systems, poor cultures, unsustainable business models and conflicted distribution may result in poor advice, mis-selling and investor loss, especially in managed investments
  3. Poor retail product design and disclosure and misleading marketing may disadvantage consumers, particularly at retirement
  4. Innovation and complexity in product distribution and financial markets through new technology can deliver mixed outcomes for retail investors, financial consumers and issuers
  5. Globalisation and cross-border businesses, services and transactions may lead to compromised market outcomes
  6. Different expectations and uncertainty about outcomes in the regulatory settings can undermine confidence and behaviour

Whilst we cannot quarrel with these statements, DFA’s perspective is they are high-level and the devil will be in the detail. Given their critical market conduct role, it is important they get it right. Some recent events suggest they need to be more proactive. We also see contention between the various stakeholders they are required to consider.

Seasonally Adjusted Employment Data Not Reliable – ABS

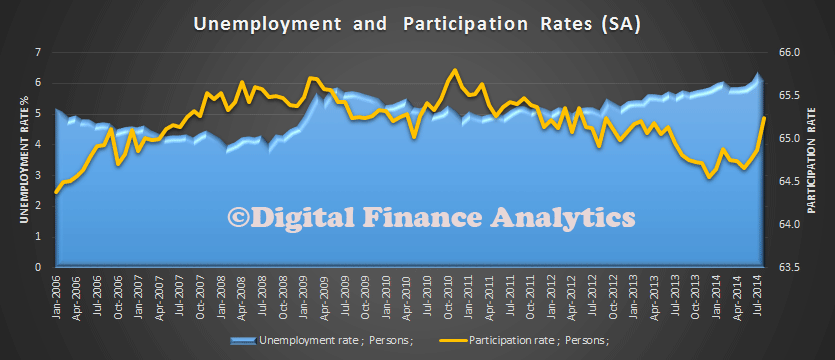
Today the ABS confirmed what we already knew, there was something weird about the employment data. When the last set came out, showing major and surprising movements, we highlighted the figures were probably not reliable. See the chart below.

UmeploymentAugust2014Now the ABS has said

The ABS has concluded that the seasonal pattern previously evident for the July, August and September labour force estimates is not apparent in 2014. This assessment was made while preparing labour force estimates for September 2014 and relates to all seasonally adjusted labour force estimates other than the aggregate monthly hours worked series.

As there is little evidence of seasonality in the July, August and September months for 2014, the ABS has decided that for these months the seasonal factors will be set to one (reflecting no seasonality). This means the seasonally adjusted estimates (other than for the aggregate monthly hours worked series) for these months will be the same as the original series and this will result in revisions to the previously published July and August seasonally adjusted estimates.

“It is critical that the ABS produces the best set of estimates that it can,” said acting Australian Statistician Jonathan Palmer “so that discussion is on what the estimates mean, and not the estimates themselves.

“To assist in this, the ABS will commission a review with independent external input to develop an appropriate method for seasonally adjusting October 2014 and following months’ estimates.

“The report on the results of this review will be presented in due course.”

The ABS has not made this decision lightly and believes this approach will result in a more meaningful set of seasonally adjusted estimates.

The ABS will continue to produce trend estimates and, as always, encourages users to use the trend estimates to help understand underlying movements in the labour force series.

This admission will increase the level of uncertainty about the accuracy of the data, at a time when unemployment and underemployment are set to remain high (as the IMF stated today). This is exacerbated by the recent cuts to the ABS budgets, making the sample smaller, and less reliable. We are flying somewhat blind at a time when good reliable data is essential if we are to chart a path through current uncertainties. Or maybe the inconvenient truth about rising unemployment will be muted as a result, and this was not entirely without intent.

The Current State Of Play In The Property Market

An extract from the latest edition of the DFA report, the Property Imperative, released last week.

The Australian Residential Property market is valued at over $5.2 trillion and includes houses, semi-detached dwellings, townhouses, terrace houses, flats, units and apartments. In the past 10 years the total value has more than doubled. It is one of the most significant elements driving the economy, and as a result it is influenced by state and federal policy makers, the Reserve Bank, Banking Competition and Regulation and other factors. Residential Property is therefore in the cross-hairs of many players who wish to influence the economic fiscal and social outcomes of Australia.

ResidentialPricesYOYJune2014
According to the Reserve Bank (RBA), as at July 2014, total ADI housing loans were a record $1.382 trillion , an increase of 8.5% in investor loans and 4.8% in owner occupied loans over the past year. There were more than 5.08 million housing loans outstanding with an average balance of about $237,000 . Approximately two-thirds of total loans were for owner-occupied housing, while one-third was for investment purposes. 43.2% of new loans issued were interest-only loans , this is a record.

After a significant credit fueled boom in 2002-2007, momentum slowed after 2007 as a result of the Global Financial Crisis (GFC). The RBA dropped rates directly after the immediate crisis, but then lifted them again to a peak of 4.5% in 2011 in response of a property rebound and the mining sector investment sector boom. In 2013 its benchmark rate was cut to an all-time low of 2.5% which has stimulated further property demand, as the resource sector transitions from an investment to exploit phase. Through 2014, rates have remained at 2.5%, and in the latest RBA minutes, they suggest a continuation for some time at this level .

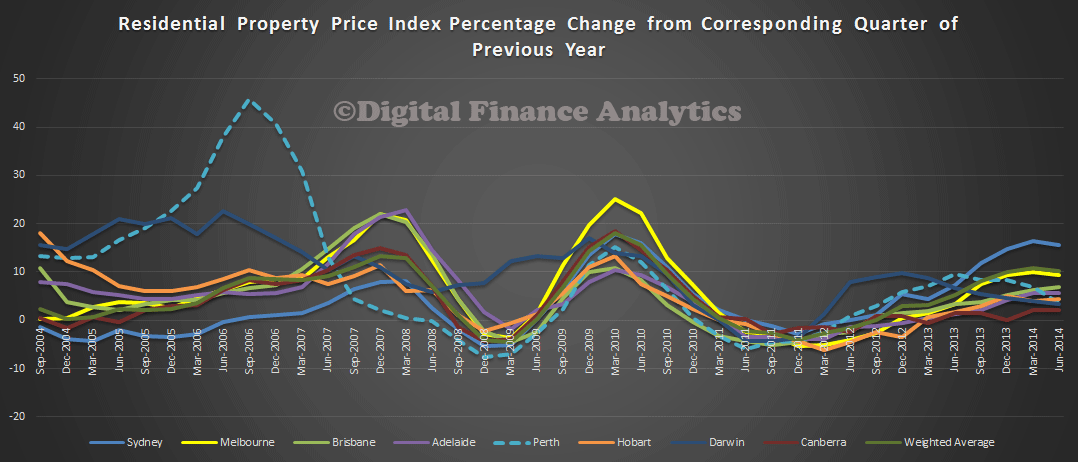
The Australian Bureau of Statistics says property prices have risen in every capital city in the past year to June 2014. Annually, residential property prices rose in Sydney (+15.6%), Melbourne (+9.3%), Brisbane (+6.8%), Adelaide (+5.6%), Hobart (+4.3%), Perth (+3.6), Darwin (+3.4%), and Canberra (+2.2%) . The Residential Property Price Index (RPPI), a measure including houses and attached dwellings, for the weighted average of the eight capital cities rose 1.8% this quarter, for a total rise of 10.1% over the last year.