AMP’s, Shane Oliver published a piece in which he revised up his expectations of the housing price correction from peak to trough to 20% in Sydney and Melbourne, and 10% nationally, a downgrade from their previous expectation for a 5% national average fall.
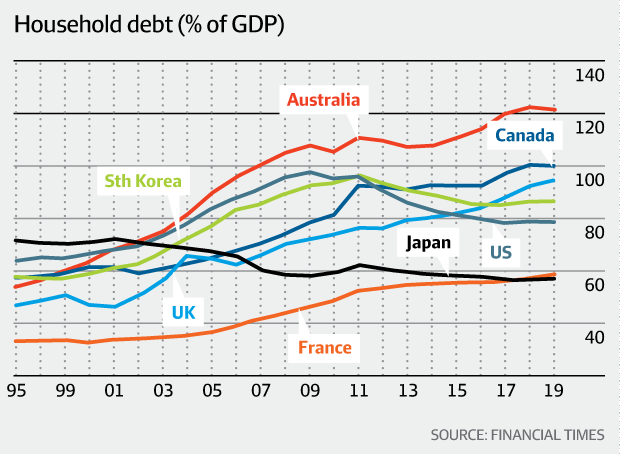
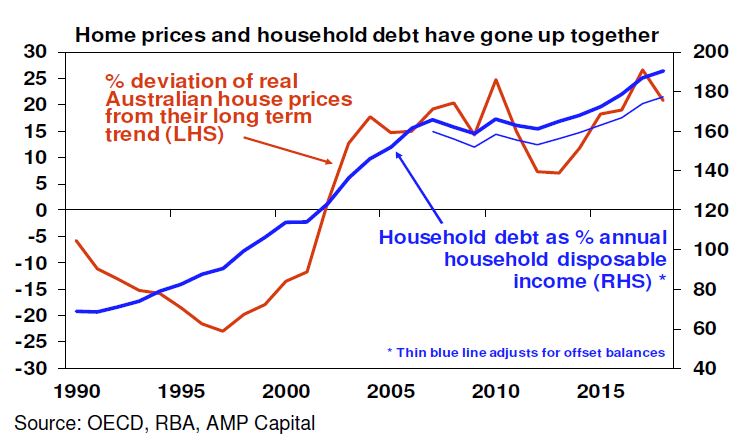
He has, along with a number of other economists progressively raised his expectations of the falls across the market as new data comes to hand. And specifically, he highlights the link between climbing home prices and credit availability. He says “this has taken the household debt to income ratio from the low end of OECD countries to the top end. The shift to overvaluation and high debt mostly occurred over the 1995-2005 period”.
We have taken his projections and run them across our Core Market Model. If his forecast were to eventuate, we think around 17% of borrowing households would fall into negative equity – meaning their outstanding mortgage would be greater than their property value.
Negative equity is tricky, because it limits households ability to refinance, trade up or down, as well have reducing overall economic activity and confidence. After the GFC, we saw many households in the UK locked into their properties for several years, the same could happen here.
In addition, of course there are implications for the banks (should they be adjusting their risk and capital models?) as well as for Lenders Mortgage Insurers, who cover the banks exposures above 80% of loan to value, unless they are covered by their captive insurers. In a falling market the insurers would likely be hit with higher levels of claims. Note of course there is not a one to one link between property price falls and defaults, the risks are much more complex.
But the results from our modelling are worth looking at in more detail, remembering we are using data from our household surveys and other sources. Around 560,000 households would be impacted, and we can slice and dice the data to begin to understand their profiles.
Our core segmentation highlights that Multicultural and Young Families would be hit most severely, in terms of the numbers of households in negative equity, with the Battling Urban and Disadvantaged Fringe following closely. But we also see a fair number of affluent households also caught in a negative equity trap. They are often highly leveraged.
Across our property segments, those holding property without an intent to trade up or down figure as the largest sector, plus those who have refinanced recently. The first time buyer cohort also shows up, but this is a smaller count.
Two states NSW and VIC see the bulk of the negative equity, both states with a strong recent run in prices, and now significant reversals. AMP says 20% falls are likely here.
We can also see the more granular regional view showing the same.
Looking across are geographic bands, we see the urban fringe and outer suburban rings most impacted.
Across the age bands, it is younger households who are most exposed.
Finally, in terms of income bands, those in the $50-100k and $100-150k bands are most strongly represented.
So, in a nutshell, younger households with more limited incomes are more likely to be exposed to negative equity, especially if they live in the main urban centres of Sydney and Melbourne, and they are more likely to be located in the outer suburban rings.
And finally, if we ran a uniform 20% fall across the country, the number impacted would more than double. Personally I think the smaller centres are also likely to fall further. But we will see!
Falling house prices have prompted half of Australia’s fixed-income investors to nominate a domestic housing market downturn as the top risk to the country’s credit markets over the next 12 months, according to Fitch Ratings‘ 4Q18 fixed-income investor survey.
House prices have been pushed lower by regulations and tighter lending standards, but external threats posed by trade wars also loom. Investors are concerned the trade wars may adversely affect China, with negative flow-on effects for a number of Australia’s other Asian trading partners. This led 82% of investors to expect Australian house prices to decline by between 2% and 10% over the next 12 months. However, broader economic deterioration is not envisaged, as 97% of investors believe unemployment will remain below 6.5% through to mid-2020.
More than 60% of investors responding to our 4Q18 survey believe commercial bank lending standards will tighten for high-yield corporates, SMEs and retail sector borrowers over the next 12 months in the wake of a Banking Royal Commission. At the same time, there is a noticeable rise in the proportion on investors expecting fundamental credit conditions to deteriorate for financials – up to 66%, from 48% in our 2Q18 survey.
Shareholder oriented activities remain the preferred use of cash for Australian corporates, according to 78% of survey respondents. This has been a consistent finding across our surveys to date, but 4Q18 survey investors indicated that corporates may have an increased appetite for M&A as a use for cash.
A majority of Australian fixed-income investors expect spreads to widen in four asset classes over the next 12 months: financials, non-financial corporates, structured finance (RMBS and ABS) and unrated. Likewise, when asked what they are willing to pay across a range of asset classes, investors indicated that a sustained period of compression appears to be coming to an end in seven of ten asset classes surveyed.
The 4Q18 survey was undertaken in partnership with KangaNews – a specialist publishing house that provides commentary on fixed-income markets in Australia and New Zealand. Findings represent the views of managers of more than AUD500 billion of fixed-income assets, accounting for over three-quarters of Australia’s domestic real-money market.
Fitch’s 4Q18 fixed-income investor survey was conducted between 27 August and 10 September 2018. This survey is unique in the Australian context, reflecting the partners’ strong ties with the local investor community.
I caught up with property expert Edwin Almeida and we discussed the pressure on property investors and their property portfolios. Is the property investment party over?
Given the falling values, the dilapidation of much of the stock, and falling demand, it may just be the case. At very least, Edwin suggests holding off as prices will fall further! Then the question becomes, how far and how fast?
We have completed the latest round of our 52,000 household surveys, and today we discuss the results relating to property buying intentions by extracting the data from our Core Market Model. It was this data six months back which enabled us to predict the currently observed slowdown in sales, auction clearances and home prices.
So what is in store for the next few months? Well, in short its more of the same, only more so, with more households reporting difficulties in obtaining finance, fewer expecting to transact in the next year and to see home prices rise.
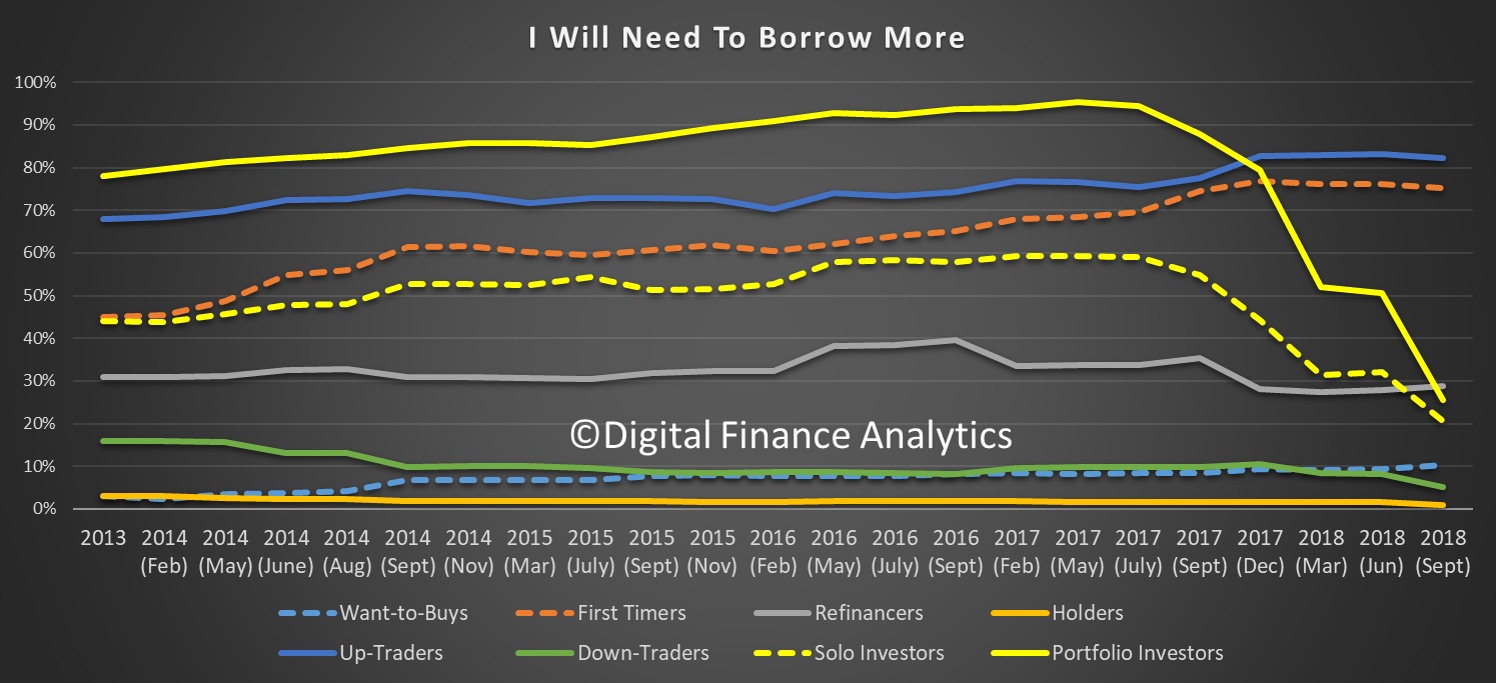
So we start with transaction intentions. The first startling observation is the fall in the number of property investors, including those who hold portfolios of investment properties intending to transact. 20% of portfolio investors are expecting to transact, and the bulk of these intend to sell a property, compared with a year ago when 50% said they would transact, and most were looking to add to their portfolios. Most solo property investors are now on the side lines, with around 10% expecting to transact, and most of these on the sell side. Demand for investment property will continue to fall, as rental yields and capital appreciation fall.
On the other hand, the number of people trading down is rising, with more than 50% of these looking to sell before prices fall further. There is some demand from first time buyers, and up-traders, but the net conclusion is there will be more property coming to market and fewer buyer, so prices are set to fall further, and quite quickly. The spring season appears all but shot.
These trends are mirrored in the demand for credit. Property investors are now less likely to borrow, while those trading-up and first time buyers are still in the market (but in terms of volumes this is a smaller group). Refinance households are still in the market for a replacement loan, but these do not add to new demand for credit.
As a result, we expect demand for credit to wilt further in the months ahead. Of course for the banks to maintain their profit output they need to see real growth in new credit, we do not expect that will eventuate, so credit will continue to ease.
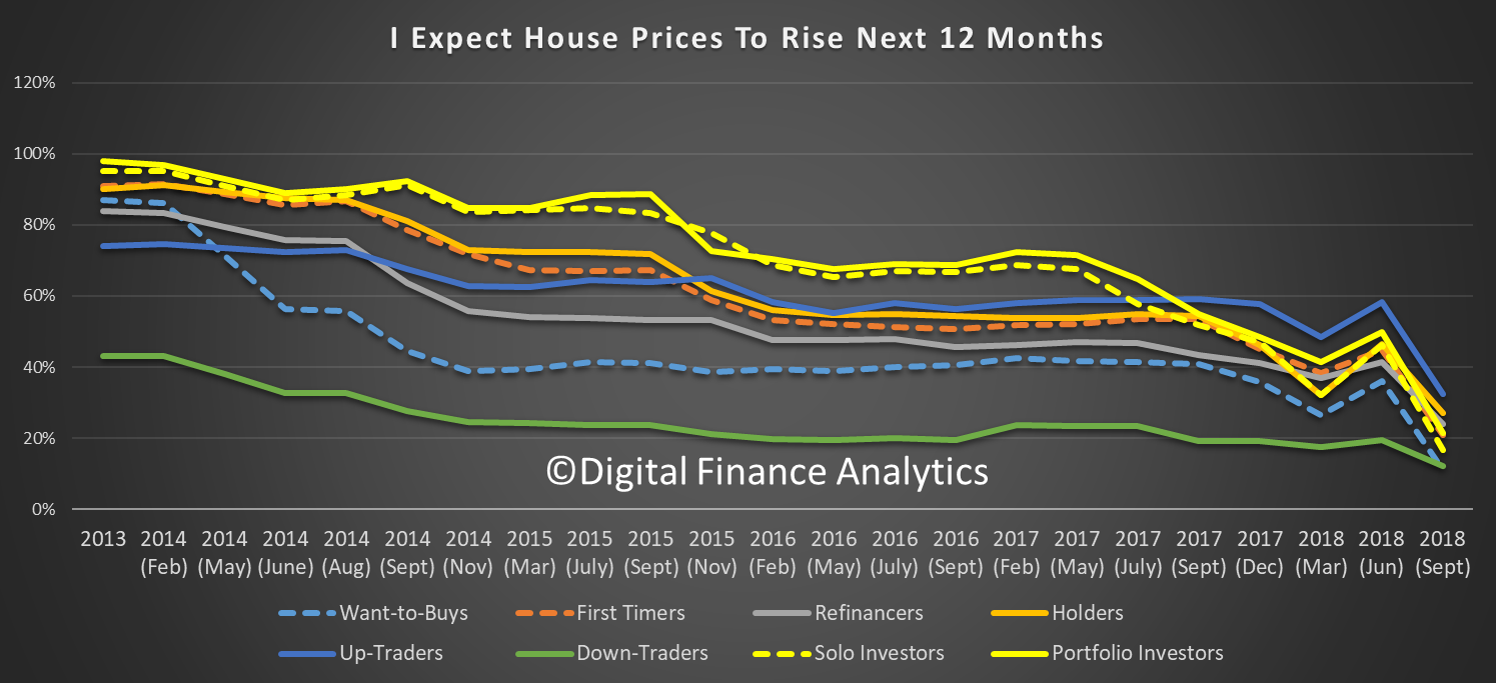
Universally, households are less bullish on home price growth, than a year ago, with a sharp down turn since June 2018. Down traders are the least likely to expect rises at 18%, while 35% of those trading up were bullish on home price values. Property investors are getting less and less positive about future price accumulation.
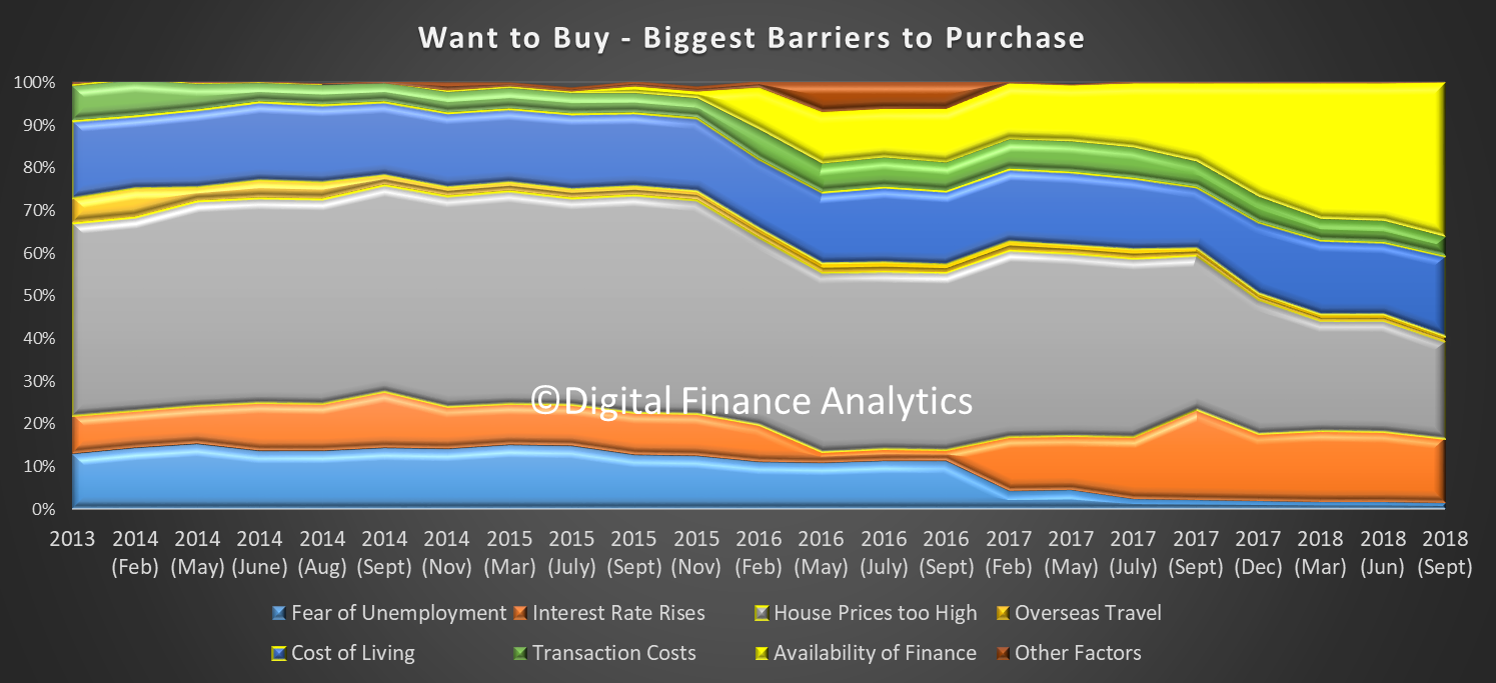
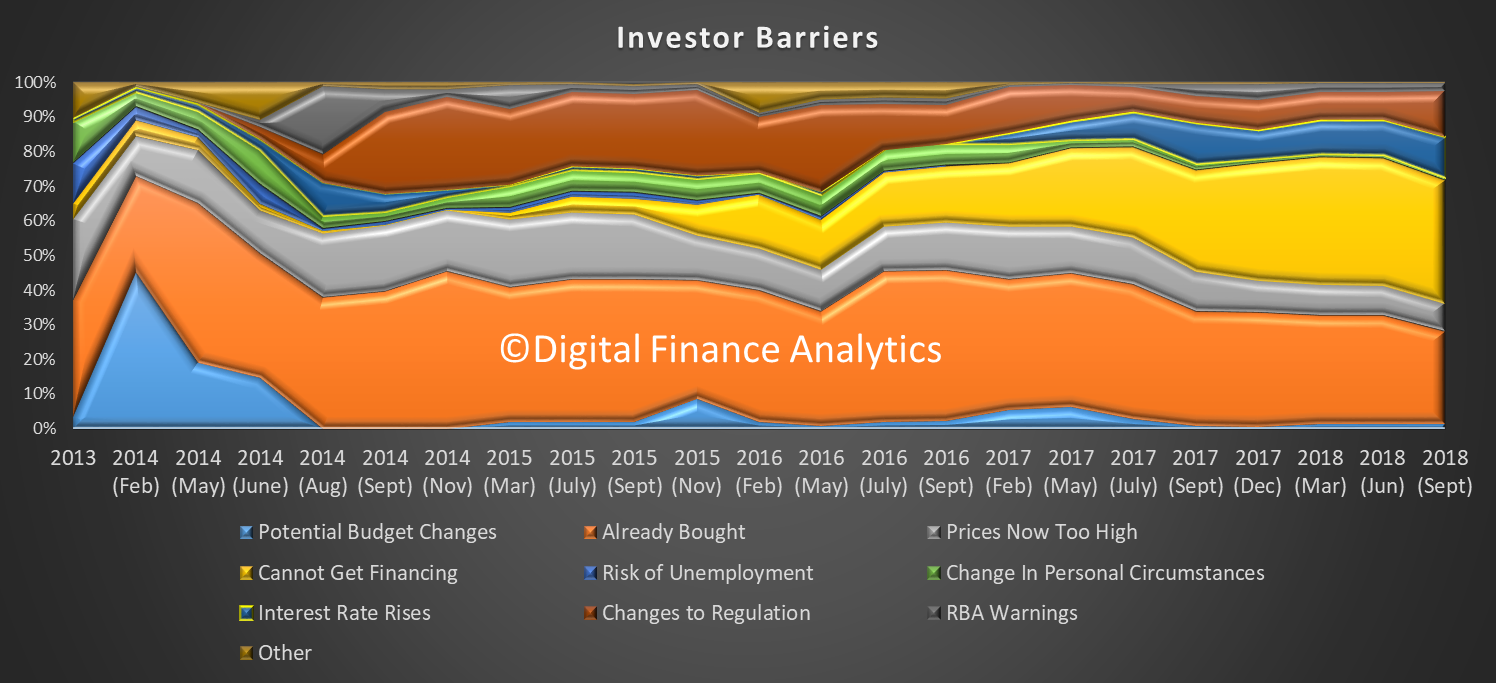
Turning to the specific segments, 36% of those wanting to buy, but who cannot, reported their barrier related to the (non) availability of finance. This is a record, and reflects the tighter underwriting standards now in force.
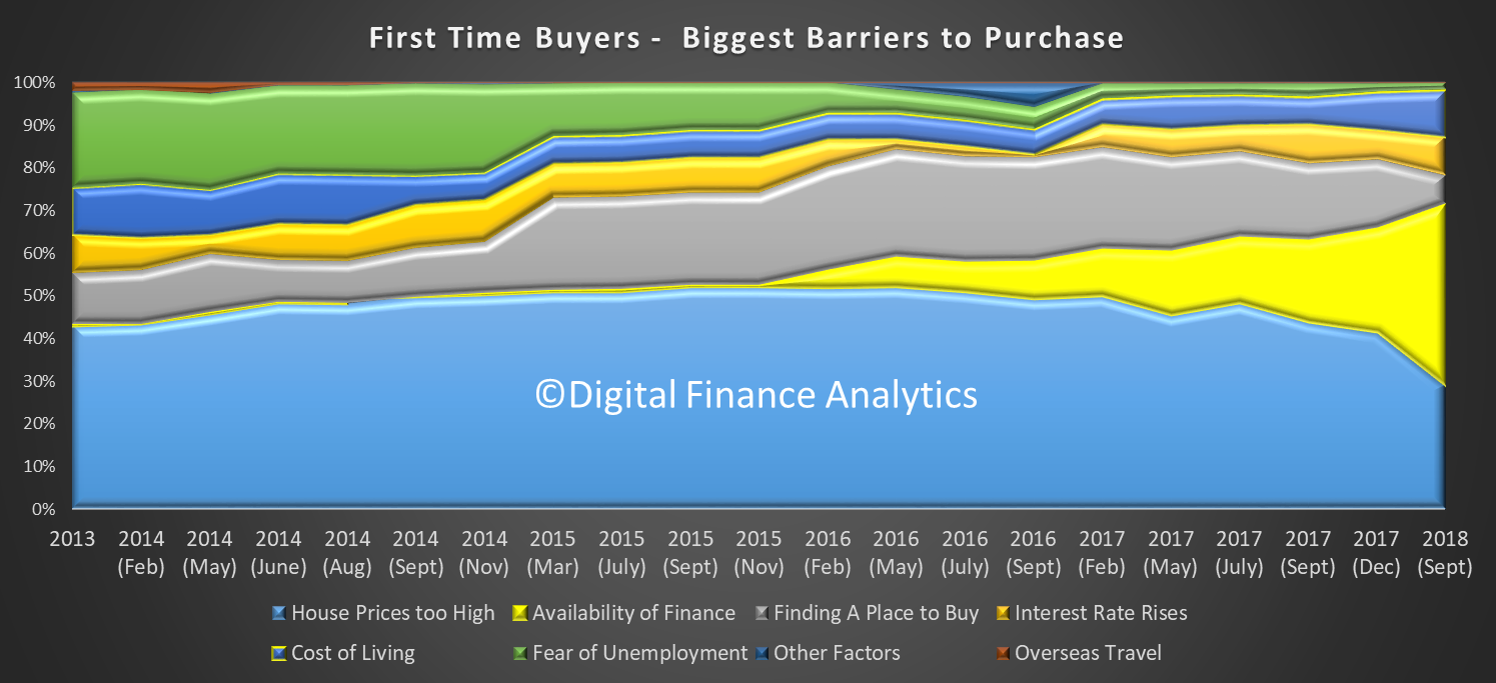
We find the same thematic among first time buyers where 42% report a problem with finance availability, a record.
Investors have a similar problem with 36% saying they have issues with finance, and more are now concerned about potential changes in regulation (including Labor’s changes to negative gearing).
In fact, Investors are ever more reliant on the tax breaks, as capital growth eases. 40% are banking on the tax benefits, while 15% expect future capital appreciation.
When we look at the motivations of those seeking to trade down, 48% are looking to capital release, and now few are interested in acquiring an investment property. Increased convenience remains a significant driver.
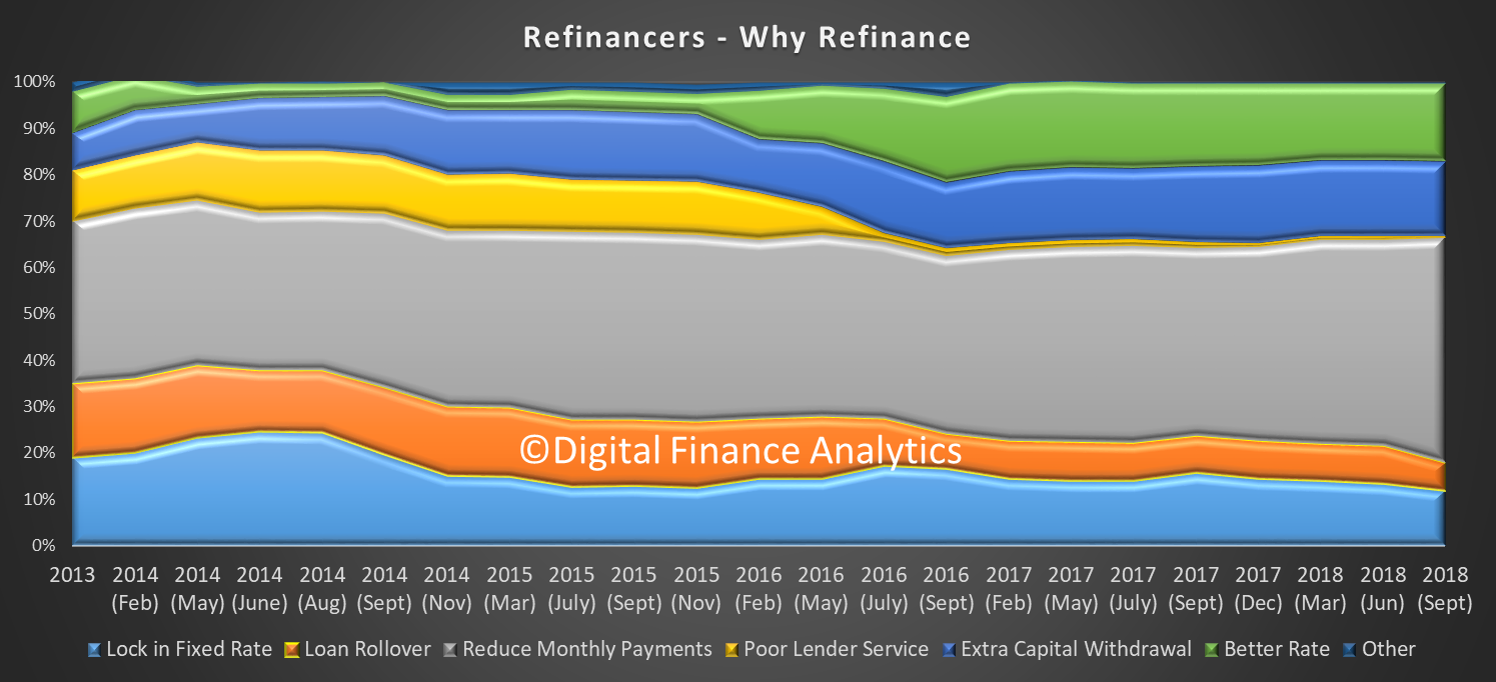
Households seeking to refinance are mainly being driven by a quest to reduce monthly repayments (49%) and there is a high correlation with those experiencing mortgage stress, as we reported yesterday. Lender service, or the lack of it, does not seem to count for much.
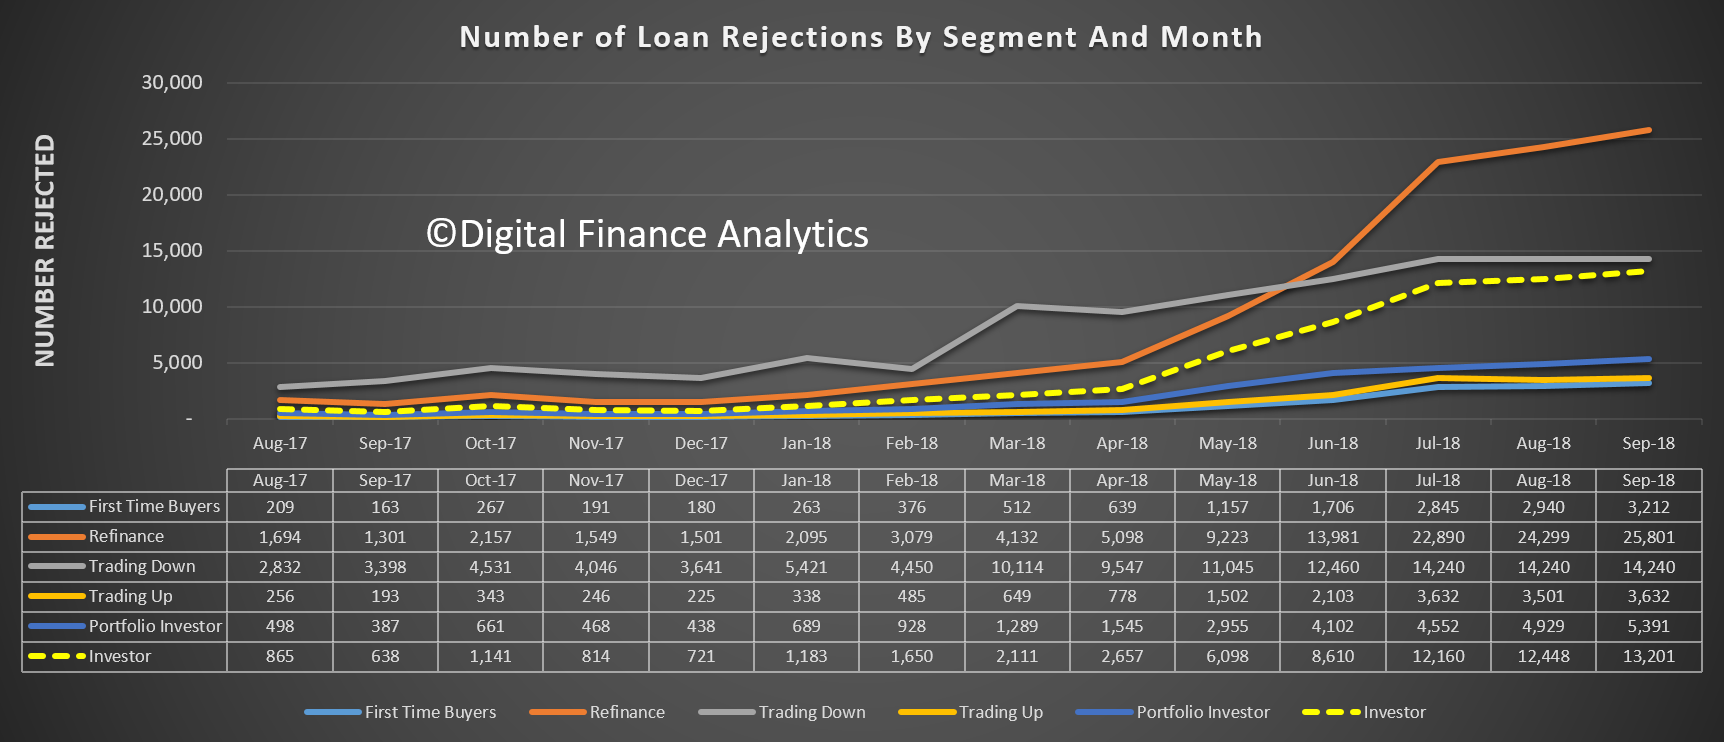
And finally, to ice the cake, as it were, the number of loan rejections continues to rise, especially among refinance and investor cohorts.
Add this new data to the other factors:
Tighter Lending Standards – focus on income AND expenses, not HEM
Mortgage Borrowing Power dropped up to 40%
Foreign Buyers dropped 35%, and significant hike in extra fees and taxes
SMSF borrowing restricted
Interest Only Borrowing Restricted ($120 billion for reset each year)
Investors less likely to transact, as capital growth reverses
Tighter returns on rentals (half under water in cash flow terms)
Higher interbank funding costs
Rising mortgage costs and rates (NAB holds)
Risk from Class Actions and Royal Commission
Etc…
and there is plenty to suggest further home price falls are in the offing. We will add this new set of data into our scenarios, and we will update our findings in a future post.
But our conclusion is “you ain’t seen nothing yet” to quote an old Bachman Turner Overdrive song from 1974!
Today we discuss a recent post looking at the Australian finance and property from an international investment managers perspective. Those following our work will find it surprisingly familiar!
As reported in InvestorDaily, following the global financial crisis, the US Federal Reserve has effectively been exporting extraordinarily loose monetary policy to markets across the world. As a result, one of the unintended consequences has been a growing number of asset bubbles around the world, especially in countries where central banks have been forced to run looser monetary policy than they might have wished.
James McAlevey, Head of Rates, Portfolio Manager, AIMS Fixed Income and Target Return funds at Aviva Investors has written about Australia.
He says that nowhere is the asset bubble more apparent than in Australia, where the Reserve Bank of Australia (RBA) has arguably kept monetary policy looser than domestic economic conditions warranted to try to cap the Australian dollar’s value. The resulting loose monetary has fuelled an unsustainable boom in house prices, with strong demand from Chinese investors having further inflated the market.
Given the magnitude of price increases – in Sydney, for example, prices have risen 80 per cent in the past five years – Australia’s housing market has for some time appeared a prime candidate for a sizeable correction. Until now, the prevailing wisdom has been that such a downturn was unlikely without significantly higher interest rates or rising unemployment.
However, in recent months a new threat has emerged. The government in February set up a royal commission to investigate alleged misconduct in the financial services industry. Having examined potential breaches of responsible lending laws in relation to the sale of home loans, it appears to be taking a more rigorous view of banks’ lending practices.
With allegations of fraudulent activity having led some politicians to clamour for more draconian action – the now Australian Prime Minister Scott Morrison warned financial sector executives responsible for breaches of corporate law that they could face jail – banks have begun to tighten lending criteria. Notably, in screening mortgage requests they are undertaking greater due diligence to verify applicants’ income and living expenses to assess their ability to service and repay their loans.
With a material tightening of the availability of credit now underway, suddenly there are plausible grounds for concern Australia could be heading for trouble. That could have serious consequences for house prices, the country’s economy, and ironically the banks themselves.
The dangers posed to banks are all the more acute given mortgages account for somewhere between 60–65 per cent of their assets, which is high by international comparisons. Furthermore, much of this housing collateral is sitting on banks’ balance sheets at inflated valuations, adding to their vulnerability to a housing downturn.
At the same time, Australian households’ finances have begun to look increasingly stretched. The ratio of total household debt to income is now high by international standards. According to a recent report from the RBA, it has risen by almost 30 percentage points to close to 190 per cent over the past five years, after being broadly unchanged for close to a decade. At the time of writing, three of the four major Australian banks had announced increases to their variable mortgage rates despite benchmark lending rates having been held unchanged. With Australian wage growth remaining stagnant, this is likely to lead to Australian household’s further tightening their purse strings.
Worryingly, many mortgages are on interest-only terms, but are set to revert to capital repayment mortgages in the coming years. According to a recent research note, UBS analysts believe Australian banks wrote around A$650 billion in interest-only mortgages over the past five years, representing around 40 per cent of total mortgage lending. With the Australian Prudential Regulation Authority (APRA) having placed a 30 per cent cap on such mortgages, they estimate around A$120 billion of these mortgages will revert to capital repayment loans each year until 2021.
The UBS analysts estimate repayments on these mortgages will increase by between 30 and 50 per cent, leading to a material squeeze on incomes and forcing many into selling their homes.
In 2017 APRA conducted a stress test of the country’s 13 largest lenders. It found in aggregate, the common equity tier 1 ratio of the industry fell from around 10.5 per cent to a little over 7 per cent by year three, and under a worst-case scenario to just below 6 per cent.
APRA concluded that although banks would potentially suffer significant losses, its results nevertheless provided a degree of reassurance: “banks remained above regulatory minimum levels in very severe stress scenarios”.
The regulator has simultaneously been looking to strengthen banks’ ability to withstand a housing downturn by changing the risk-weightings on mortgages and introducing other ‘macroprudential’ measures to limit riskier types of lending. For example, it is looking to tighten lending in Sydney, Melbourne and Perth by encouraging banks to stop lending to developers of high-rise properties – a segment of the market that is suffering from high vacancy rates and has been left badly exposed by the nascent downturn.
Sydney ranks among the most expensive real estate markets in the world.
He concludes that It remains to be seen to what extent the steps the regulator has taken will help limit the scale of losses made by banks in the event of a more severe property market downturn. The dilemma it is facing is that by tightening lending standards it runs the risk of causing property prices to fall further, intensifying the problems faced by the banks.
Some of the problems facing Australia are eerily reminiscent of the events seen in the US and western Europe in 2008. While Australian banks may yet avoid the catastrophe that befell financial institutions in the US and Europe, at the very least their profits appear vulnerable and their debt at risk of downgrades, especially given their reliance on wholesale markets for funding.
Given these concerns, he says, we believe the Reserve Bank of Australia will struggle to raise interest rates as fast as many other central banks. For some time now, we have been ‘short’ the Australian dollar, and bank debt via credit default swaps, and ‘long’ short-dated government bonds. Given the danger the royal commission will continue to generate adverse headlines for Australia’s banks, and given the bearish outlook for the country’s property market, we have in recent months increased the size of each of these positions.
And from our recent conversations with other international investors, he is not alone.
The latest in our “Property Market Front Line” series, with a property insider calling it as it is…with surprising results!
Edwin Almeida predicts prices to fall to 2004-2005 levels in a lot of Sydney areas. Providing, the government don’t come up with, a left field stimulus package.
He is confident, apartments prices will drop 50-60% and homes by as much as 40%-50% from their 2017 peak, regardless.
Following the program which aired last week, Nine also posted an extra segment on the housing/mortgage sector, in which my comments are summarised quite nicely.
By the way, ABC Media Watch is likely to discuss the 60 Minutes programme tonight.
The total value of residential dwellings in Australia was $6,926,538m at the end of the June quarter 2018, falling $13,321.1m over the quarter. We need to get use to more falls ahead. Of course it varies by locations and property types.
The mean price of residential dwellings fell $4,100 to $686,200 despite the number of residential dwellings rising by 40,800 to 10,093,700 in the June quarter 201
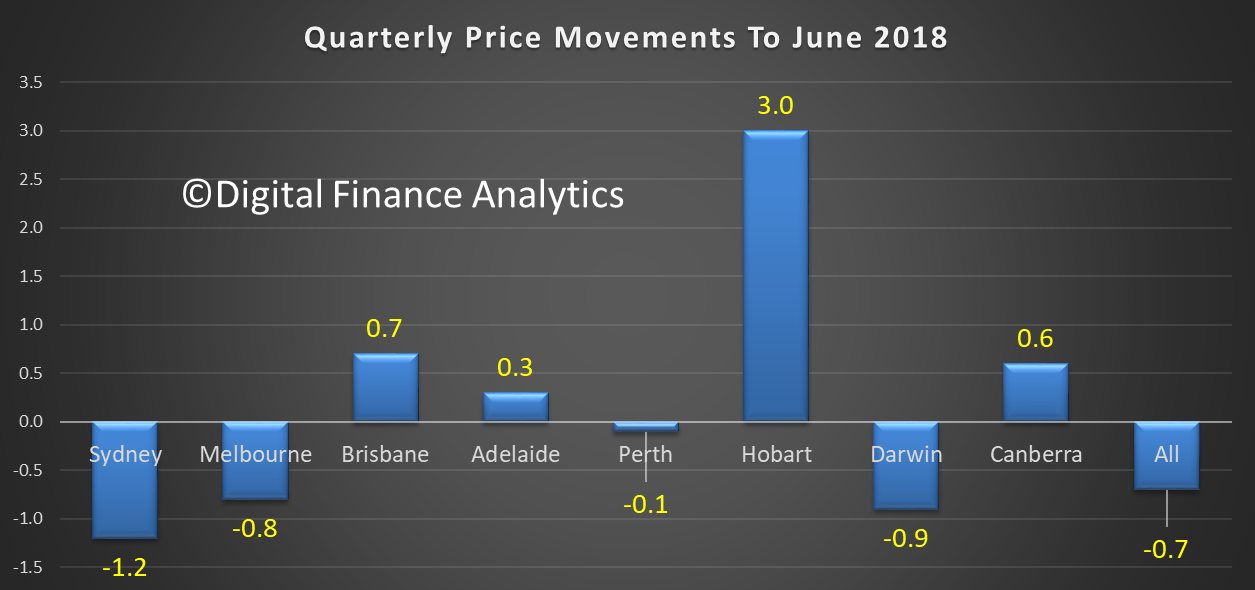
The price index for residential properties for the weighted average of the eight capital cities fell 0.7% in the June quarter 2018. The index fell 0.6% through the year to the June quarter 2018. So the falls are accelerating and the more recent CoreLogic series shows further falls ahead.
The capital city residential property price indexes fell in Sydney (-1.2%), Melbourne (-0.8%), Perth (-0.1%) and Darwin (-0.9%), and rose in Brisbane (+0.7%), Hobart (+3.0%), Adelaide (+0.3%) and Canberra (+0.6%).
Annually, residential property prices fell in Darwin (-6.1%), Sydney (-3.9%) and Perth (-0.9%), and rose in Hobart (+15.5%), Canberra (+3.0%), Melbourne (+2.3%), Adelaide (+2.1%) and Brisbane (+1.7%).
You can follow up by joining my live stream YouTube event tonight, where we will discuss the programme and my analysis. Details below.
Ok this ain’t sexy, but it could be the most important thing you read this year. Did you know that Australian household debt compared to our GDP is sitting at 120% and is one of the highest in the world? That’s what the latest data from the Bank for International Settlements (BIS) says, and they should know, as they are the central bankers’ banker.
Now you might well ask, why this is a problem. After all, in the past decade, the banks have been lending freely, mostly to help households buy real estate to live in or as an investment, and on that back of that they have been able to increase dividends to their shareholders and inflate their balance sheets, while the bank regulators are saying the banking system is sound, and despite the growth in debt, there is really nothing to see here – move along. Any anyone holding property, at least on paper, has done well, much of our wealth is in real estate.
As someone who have been watching the debt ballooning for many years I have become more and more concerned that we are laying a trap which could catch out a significant number of people, and have a flow-on effect on our broader economy. Yet the banks continue to say their mortgage loan portfolios are just fine thanks, despite the revelations from the Royal Commission showing that many loans were written under false pretences, and in some cases lenders were simply breaking the law, as the quest for sustained profits overtook their focus on doing the right thing for their customers. Moreover, while loan defaults are still quite rare, when they occur no-one wants to talk about them, and the default count has started to rise.
So when 60 Minutes approached me to talk about the current state of play, I wanted to assure myself that this would be an objective look at the situation we face. And during our discussions over a number of weeks, I was pleased that they did just this.
There are more than 3.5 million owner occupied mortgage holders across the country and based on our latest analysis, close to 1 million are struggling with cash flow – due to flat incomes, rising costs and higher mortgage repayments – meaning that ahead there is a risk of higher defaults.
At the same time, the regulators RBA, ASIC and APRA have finally started to bear down on the banks over free lending practices, and as a result, now lenders are looking much harder at the real costs and incomes of mortgage applicants, all leading to a significant reduction in what I call “Borrowing Power” – the amount you can borrow on a given set of income and expenses. In fact, for many, this is now 40% lower compared with just a year ago. Plus, property investors are also crimped by the same rules, just as foreign property investors are also leaving the field. The net results of all this is that demand for property is now falling, more is coming onto the market, as some are forced to sell, and so home prices are falling in the major centres. The rate of fall varies, but in some Sydney post codes, we are seeing falls of more than 20% in the past year. Areas of Melbourne and Brisbane are headed the same way.
As prices fall, mortgage lending is also stalling, especially investment loans, and I see a spiral down which is becoming unstoppable. Yet many in the construction and real estate sectors, and the finance sector just do not want to accept the facts, saying it’s a minor correction and prices will jump back up in the Spring.
In fact, the question now is just how hard prices will fall, and where may they end up? And here is the ghastly truth. Property is on an absolute basis valued more than 40% above its true worth. As lending contracts, we think there is a risk we end up over the next couple of years with a major correction to these levels. If that were to occur, this would be like the USA and Ireland in 2007, when the Global Financial Crisis (GFC) hit. In fact, we could be seeing the same here, triggered but the same lending binge, inappropriate lending standards and poor levels of banking supervision. Last time around it took a decade to recover, so this could be a long torrid road.
I believe our political leaders and regulators need to wake up and smell the roses, because for those who want to see the signs the debt bomb is about to explode. I hope I am wrong on the 40%, it may be less, but the number of people who might default, or live in property where the mortgage is worth more than the value of the home could be significant, and devastating for the broader community and economy. It’s time for us to wake from our property induced slumbers and start planning to handle that debt bomb. If not GFC 2.0 in Australia is on the cards, and 2019 will be the critical year!
If you want to know more, join me on my YouTube live stream 20:00 Tuesday 18th September where we will discuss the program, my analysis and what may happen in the years ahead.
Welcome to the Property Imperative weekly to 15th September 2018, our digest of the latest finance and property news with a distinctively Australian flavour.
Watch the video, listen to the podcast or read the transcript.
On the 10th Anniversary of the failure of Lehman Brothers, the consensus seems to be that the financial system is still stressed, under the impact of sky high global debt, artificially low interest rates and asset bubbles. The shadow is long, and the risks high. I discussed this on ABC Radio Sydney, and also in a Video Post with Robbie Barwick from the CEC. Perhaps of most concern is the lack of acceptance that we have a problem, with the RBA this week recognising that household debt is high, but declaring it manageable and the Housing Industry Association calling for a relaxation of lending standards to support housing construction. That is in my view the last thing we need. The truth is, pressures on households, and tighter lending standards mean more price falls will follow. Those who follow my analysis will know I run four scenarios, including the one, the worst case, where prices could drop 40-45% from their highs over the next few years. This is the angle which the upcoming 60 Minutes programme, to be aired tomorrow, Sunday is driving at.
Just remember this is one of four scenarios! But its rated a 20% probability now.
There was more evidence this week as to the issues under the hood. For example, Domain says that whilst housing affordability has improved in all capitals where property prices have started to decline, the median multiple is still well above affordable housing thresholds in several capital city markets. They said that drawing on Domain price data and adjusted census income data, the change in price and the median multiple across capital city markets, since the respective peaks, was analysed.
While the house price to income ratio is a simple, standard indicator for understanding affordability — particularly across countries — it is far from comprehensive. Other affordability metrics still spell out tough times ahead for homeowners. Rental affordability, mortgage serviceability and the deposit hurdle are also vital considerations. But Domain says that as of June 2018, data shows the median income household in Sydney would require 59.8 per cent of weekly income to service an owner-occupied mortgage (assuming a 5.2 per cent variable rate on a loan-to-value ratio of 80 per cent). This is down from 64.4 per cent at the peak of the latest cycle
Another angle is credit scoring, as Banking Day called out, as the remaining three Big Four banks are reportedly getting ready to join NAB as participants in the new Comprehensive Credit Reporting regime. This means a massive database will share their customers’ full credit history with each other for the first time from the end of this month, at which point comprehensive credit reporting will be a foregone conclusion with the remaining major banks. The new data-sharing regime will allow lenders to better verify loan applications and assess credit risk by accessing the full repayment history of a potential customer, including their total debts. The major lenders have pushed ahead with the changes following pressure from the prudential regulator, The Australian reported, noting that ANZ said it had been testing positive data reporting since the end of June, although the data was not shared with the public at this stage. The big banks’ embrace of the new regime would put pressure on others to sign up, since only lenders who supplied comprehensive reporting to the credit bureaus would have access to the data, Australian Retail Credit Association chairman Mike Laing told The Australian. “If they don’t join then the people who intend to borrow money but not pay it back will quickly find out which ones are not in the system and they’ll go to the lenders who don’t have access to verifiable data. So it’s risky for a lender not to take part once most of the data is in there”.
And yet another angle. Between 2008 and 2012, the number of self-managed super funds grew by 27 per cent to nearly half a million. That was more than 40 per cent of the growth of the whole superannuation system. The global financial crisis coincided with the Howard government lifting the ban on superannuation funds borrowing money. As a result, self-managed super funds have rushed to take advantage and racked up $32 billion in debt in little more than a decade. The Financial System Inquiry in 2014 recommended that borrowing by superannuation funds be banned. It’s a view shared by Saul Eslake, the former ANZ Bank chief economist, who describes the decision to allow super funds to borrow as “the dumbest tax policy of the last two decades.” “The last thing Australians really needed in the last 20 years is yet another vehicle or incentive for Australians to borrow more money in order to speculate on property prices continuing to rise,” Mr Eslake said.
Overlaying that is the perennial problem of property spruikers trying to persuade people to borrow big to buy, and tip their newly acquired, heavily leveraged, property into a self-managed super fund. Super fund borrowing is known as “limited recourse” — which means if the fund can’t pay off the loan, the bank can’t go after any other assets — just the property in question. Remember this was at the heart of the sub-prime mortgage fiasco 10 years ago, which morphed into the global financial crisis. Whilst not wanting to be alarmist, Saul Eslake is concerned with what he’s seeing now in self-managed super funds with their limited recourse borrowing. “You might have thought that someone would have heard the term ‘limited-recourse borrowing’ and recognised that there were some significant risks associated with it that we could have done without in the Australian context.”
And CoreLogic Reported that the combined capital cities returned a final auction clearance rate of 55.3 per cent last week, a slight improvement on the 55 per cent over the week prior when volumes were lower. There were 1,916 homes taken to auction last week, up on the 1,748 held the previous week. While one year ago, a higher 2,258 auctions were held with a 66.9 per cent success rate.
Melbourne returned a final auction clearance rate of 60 per cent this week; an improvement not only over the week but the highest seen since May, with clearance rates for the city remaining within the mid-high 50 per cent range up until this week. The improved clearance rate was across a higher volume of auctions week-on-week, with 891 auctions held, increasing on the 805 held the week prior when 57 per cent sold.
Sydney’s final auction clearance rate came in at 50.6 per cent last week across 656 auctions, falling on the week prior when a 53.8 per cent clearance rate was returned and auction volumes were a similar 664.
As usual the performance across the smaller auction markets was mixed last week, with clearance rates improving in Adelaide, Brisbane and Canberra, while Perth’s final clearance rate fell.
The Gold Coast region was the busiest non-capital city region last week with 56 homes taken to auction, although only 26.4 per cent sold. Geelong was the best performing in terms of clearance rate with 88 per cent of the 34 auctions successful.
And this week, CoreLogic is tracking 1,882 capital city auctions this week. If we compare activity to the same week last year volumes are down 25 per cent on the 2,510 auctions held one year ago.
And finally, APRA released their quarterly property exposure data to June this past week. APRA release their quarterly property exposure lending stats for ADI’s today. There are some interesting data points, and some concerning trends and loosening of standards recently. I will focus on the new loan flows here. First the rise in loans outside serviceability continues to rise, now 6% of major banks are in this category a record, reflecting first tightening of lending standards, but second also their willingness to break their own rules! This should be ringing alarms bells. APRA?
Foreign Banks are writing the greater share (relative percentage) of 80-90% LVR loans. Other lenders tracking lower.
Foreign Banks are lending more 90+ LVR loans in relative percentage terms.
New investor loans are moving a little higher for Credit Unions and Major Banks, suggesting a growth in volumes.
The share of interest only loans dropped below 20% but is now rising a little, as lenders seek to grow their books.
All warning signs, especially when as APRA reports ADIs’ residential term loans to households were $1.62 trillion as at 30 June 2018. This is an increase of $86.6 billion (5.6 per cent) on 30 June 2017. Of these: owner-occupied loans were $1,076.4 billion (66.4 per cent), an increase of $76.7 billion (7.7 per cent) from 30 June 2017; and investor loans were $544.0 billion (33.6 per cent), an increase of $9.9 billion (1.9 per cent) from 30 June 2017. Debt is sky high, the grow rate must be slowed substantially – there are rumours of more tightening to come, we will see.
Looking at the local markets, the ASX 100 was down at the end of the week, ended up at 5,065.90, up 29.8 on the day, and it continues to underperform compared with the US markets. In the banking sector, NAB ended the week at 27.35, after they announced they would not follow the lead of Westpac, CBA and ANZ for now by not lifting their variable mortgage rates, for now. NAB closed up 0.18% on the day. ANZ, who it was announced with be subject to civil proceedings from ASIC for an alleged continuous disclosure breach in relation to a $2.5 billion institutional share placement undertaken by the ANZ in 2015. Their shares rose 0.32% on Friday to 28.15. CBA who took some further knocks this week thanks to further evidence of poor practice in CommInsure in the Banking Royal Commission, among others in the industry. They ended the week at 71.50, and up 0.45% today. And Westpac ended the week at 27.76 up 0.69% on Friday. Despite the relatively benign employment figures out this week, still at 5.3%, the Aussie ended the week at 71.54 and down 0.57% on Friday. The downward trajectory is clearly in play. This risks importing inflation into the local economy.
Looking across to the USA, many investors may be inclined to dismiss yet another headline on global trade and focus on the more granular aspect of the markets. But make no mistake, the markets were gyrating with the twists in the saga between the U.S. and its trading partners. The latest salvo came Friday, when Bloomberg reported that Trump instructed aides the day before to proceed with tariffs on about $200 billion more in Chinese products, but that the announcement has been delayed as the administration considers revisions based on concerns raised in public comments.
Earlier in the week, China had welcomed an invitation by the United States to hold a new round of trade talks. The Trump administration had invited Chinese officials to restart trade talks, the White House’s top economic adviser said on Wednesday. In addition to those tariffs, Trump has said he’s ready to add an additional $267 billion in tariffs “on short notice if I want.”
Earlier in the week, Beijing indicated it will ask the World Trade Organization for permission to impose sanctions on the U.S. as part of a dispute over U.S. dumping duties that China started in 2013.
And there’s still the revamp of NAFTA to consider. The U.S. and Canada have been in talks to bring Canada into a new agreement between the U.S. and Mexico, but there have been on announcements to far. Talks are expected to continue through Monday.
Beyond the US manufacturing sector – for example Boeing is still pretty strong, at 359.80, while Caterpillar ended down 0.44% to 144.90; the potential spill over into the consumer sector impacted a range of stocks, with Whirlpool down 1.68% to 123.21, Walmart down 0.56% to 94.59 and Mattel was up 1.49% to 16.35. Among the financials, Morgan Stanley was at 48.19, a little higher on the day, but still well down on March highs. The S&P 500 ended up 0.03% to 2904.98, as did the Dow Jones Industrial Average to 26,154, while the NASDAQ was down just a little to 8,010.
Apple got the type of promotional attention some companies can only dream of when the eyes of tech lovers and investors alike were glued to its keynote event for details on its new products, especially phones. Apple announced Wednesday its new iPhone product line. Shares of Apple rose the day before the event in anticipation of the kind of surprise announcement for which former CEO Steve Jobs was famous. The stock sold off as details about the new iPhones arrived and shares ended the day lower. But shares bounced back on Thursday, leading the overall tech sector higher, despite negative analyst commentary about the price of the iPhone XR. Apple ended the week down 1.14% to 223.84.
Bucking the recent trend that’s made investors nervous about price pressure, the latest data showed inflation cooling. First, figures showed wholesale prices fell unexpectedly. Producer price index decreased 0.1% last month. In the 12 months through August, the PPI rose 2.8%. Economists had forecast the PPI rising 0.2% last month and increasing 3.2% from a year ago. The core PPI decreased by 0.1% from a month earlier and rose 2.3% in the 12 months through August. Analysts had predicted core PPI to increase 0.2% month on month and 2.7% on an annualized basis.
Next, retail inflation rose less than anticipated. The consumer price index advanced 0.2%, missing expectations for a gain of 0.3%. In the 12 months through July, the CPI increased 2.7%, below forecasts for a reading of 2.8% and down from 2.9% in July. The core CPI increased by 0.1% from a month earlier, below forecasts for a gain of 0.2%. The annual increase in the so-called core CPI was 2.2%. Economists were looking for it to hold steady at July’s 2.4% advance. But despite these softer inflation numbers, traders ended the week still predicting a more-than-80% chance of the Federal Reserve hiking rates at its December meeting on top of the expected boost this month.
Bond yields rose sharply this week, owing to confidence that the Federal Reserve will lift rates for a total four times this year. The rise was particularly strong Friday, when the United States 10-Year yield topped 3% briefly. A big reason for that was Friday’s retail sales numbers.
The August retail sales numbers were disappointing at first blush, rising 0.1%, compared with expectations for 0.4%. But July’s gain was revised up to 0.7% from 0.5%. That revision gave market watchers some more confidence that the U.S. could see GDP growth of 4% in the third quarter, which would all but guarantee another rise in rates in December.
Gold ended the week lower at 1,198, down 0.82%, with preference for the US Dollar as a safe haven. And Copper fell 2.61%, well down on the start of the year, with demand slowing. Oil prices were higher to 69.00, up 0.60% on Friday, reflecting concerns about supply thanks to Hurricane Florence, and trade concerns. Of course, with the lower Aussie, this means fuel prices will rise further ahead.
Finally, Bitcoin is still making lower highs, even though the cryptocurrency has seen slightly higher lows. The key is going to be when bitcoin trades back above $7,000. There is a trend line connecting all the recent highs going back to early 2018. If BTC can bust above that level, it will likely take out the high at $7,350 and make a higher high. Once that happens, institutions may start buying heavily and upside could be back above $10,000 within months. That said, it ended the week down 1.15% to 6,488.
According to Bloomberg, Morgan Stanley plans to offer trading in complex derivatives tied to the largest cryptocurrency, according to a person familiar with the matter, joining other Wall Street firms in creating ways for clients to play the digital currency market. The U.S. bank will deal in contracts that give investors synthetic exposure to the performance of Bitcoin, said the person, who asked not to be identified because the information is private. Investors will be able to go long or short using the so-called price return swaps, and Morgan Stanley will charge a spread for each transaction, the person said. Citigroup is developing a new mechanism for trading cryptocurrencies known as digital asset receipts, a person with knowledge of the plans said earlier this month. Goldman Sachs is exploring derivatives on Bitcoin called non-deliverable forwards, and is considering a plan to offer custody for crypto funds.
Finally, today a couple of quick reminders, first the 60 Minutes programme tomorrow evening and our live stream event on Tuesday at 20:00 Sydney, where you can discuss with me the latest on the outlook for home prices, as well as all our other analysis. You can bookmark the event by using this link. I look forward to your questions in the live chat.
If you value the content we produce please do consider joining our Patreon programme, where you can support our ability to continue to make great content.

 We have taken his projections and run them across our Core Market Model. If his forecast were to eventuate, we think around 17% of borrowing households would fall into negative equity – meaning their outstanding mortgage would be greater than their property value.
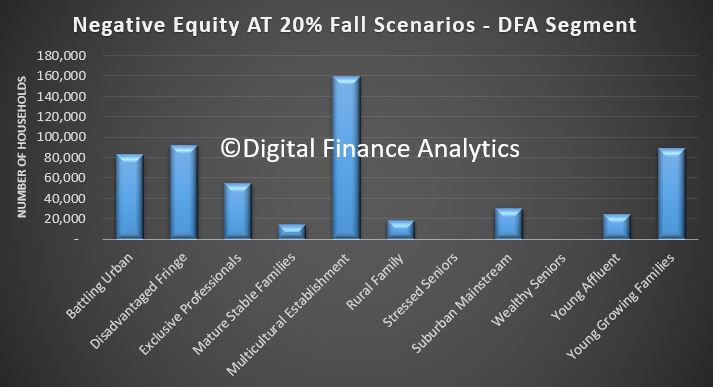 Across our property segments, those holding property without an intent to trade up or down figure as the largest sector, plus those who have refinanced recently. The first time buyer cohort also shows up, but this is a smaller count.
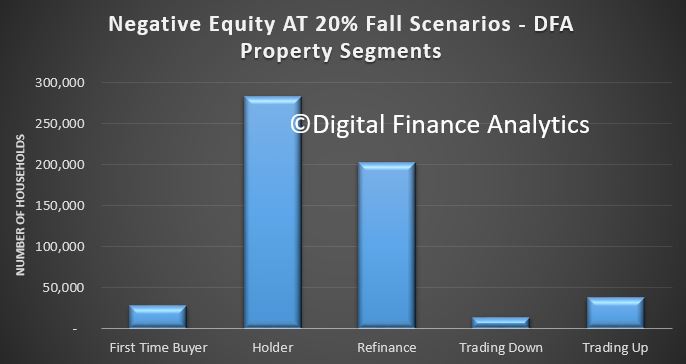 Two states NSW and VIC see the bulk of the negative equity, both states with a strong recent run in prices, and now significant reversals. AMP says 20% falls are likely here.
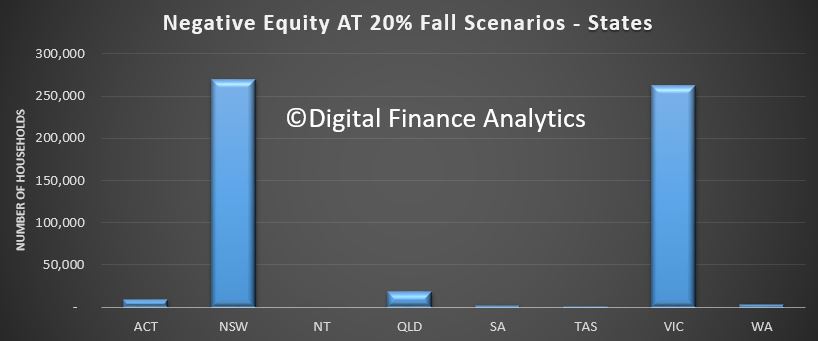 We can also see the more granular regional view showing the same.
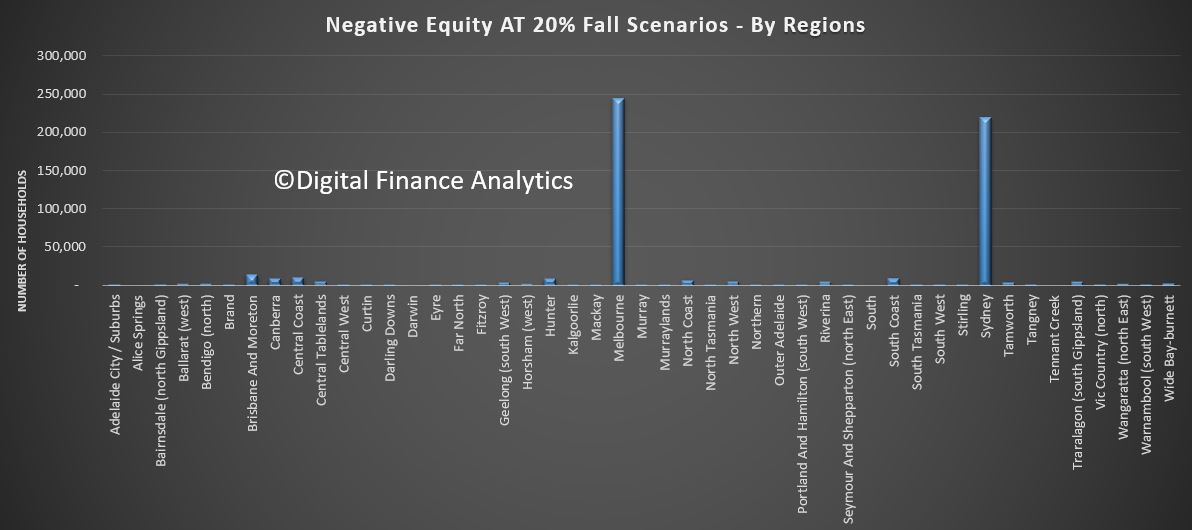 Looking across are geographic bands, we see the urban fringe and outer suburban rings most impacted.
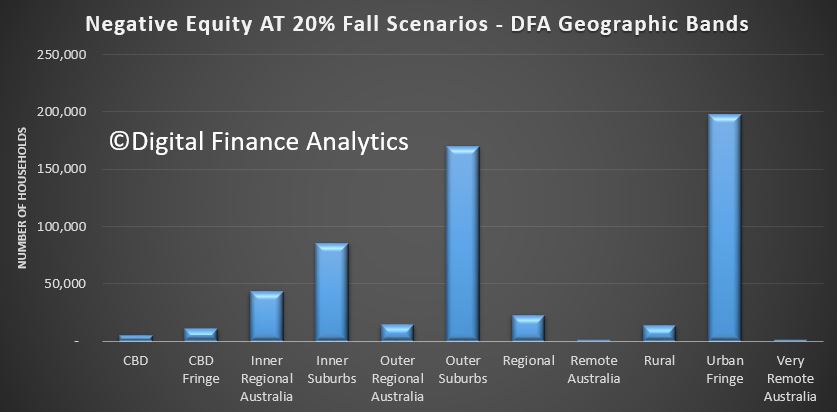 Across the age bands, it is younger households who are most exposed.
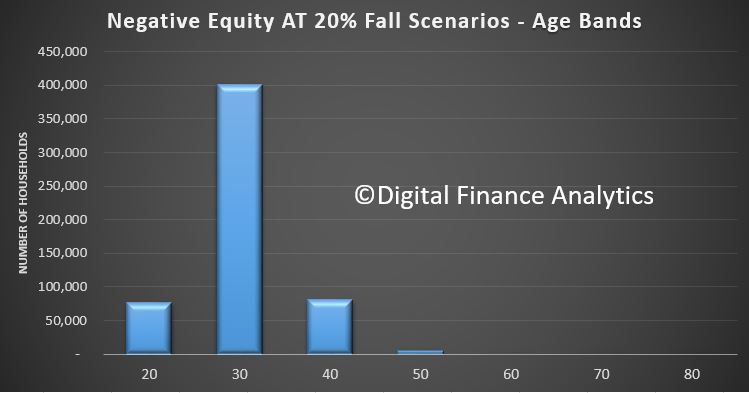 Finally, in terms of income bands, those in the $50-100k and $100-150k bands are most strongly represented.
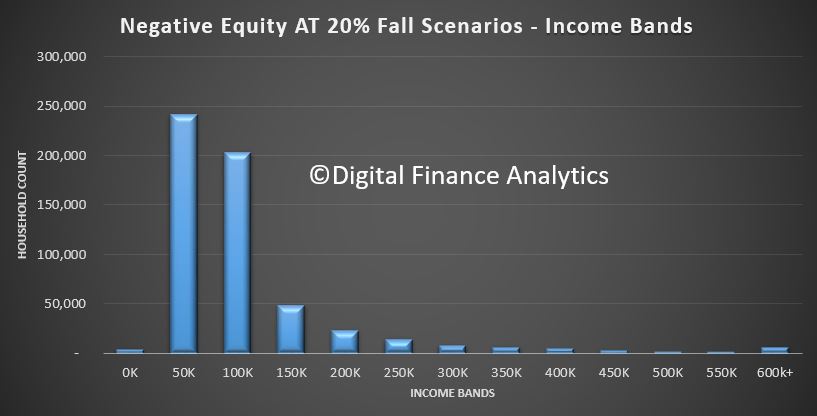 So, in a nutshell, younger households with more limited incomes are more likely to be exposed to negative equity, especially if they live in the main urban centres of Sydney and Melbourne, and they are more likely to be located in the outer suburban rings.