Household Finance Confidence Weakens Again

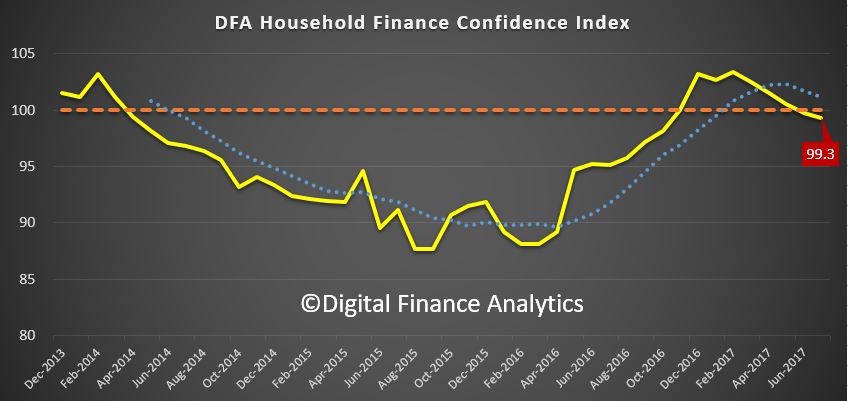
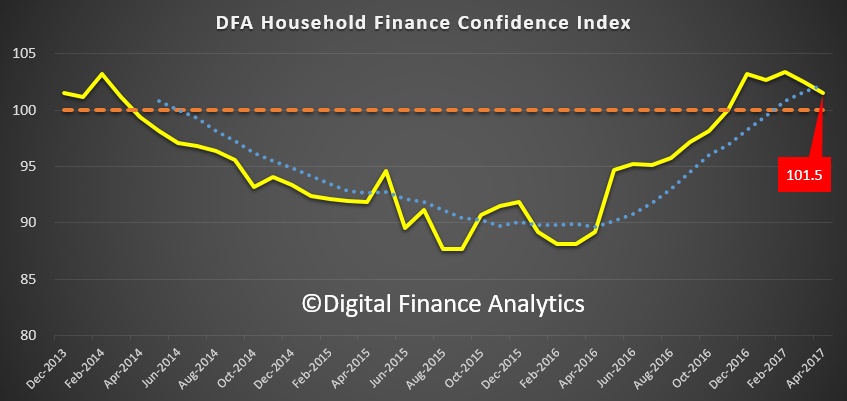
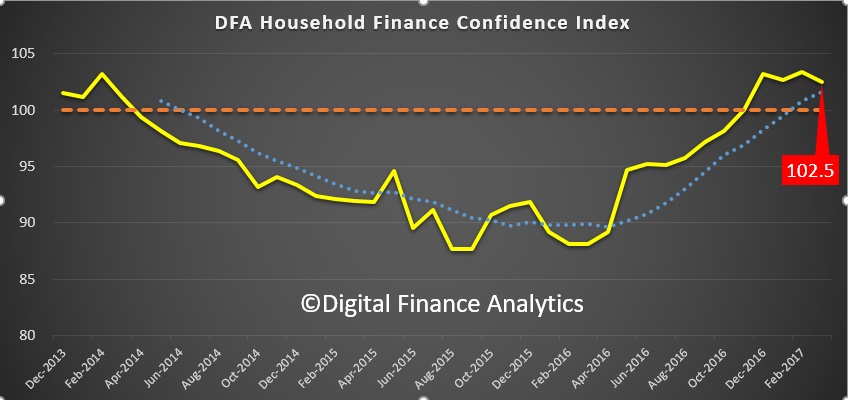
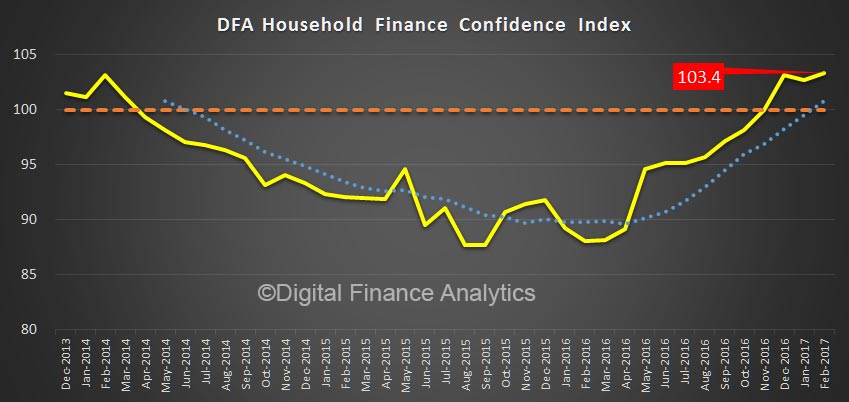
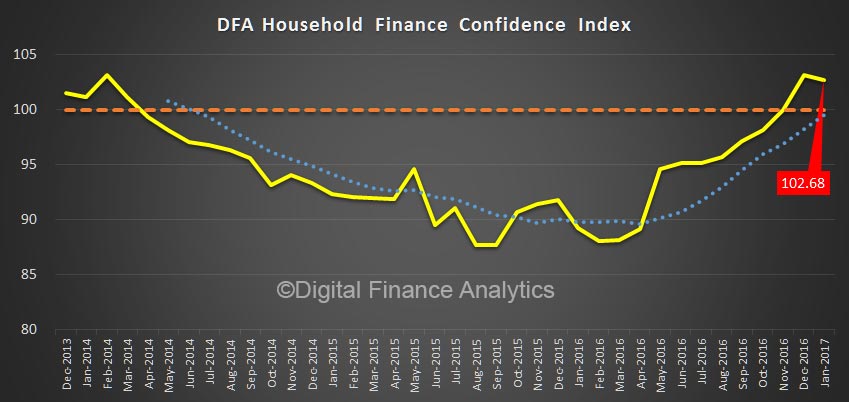
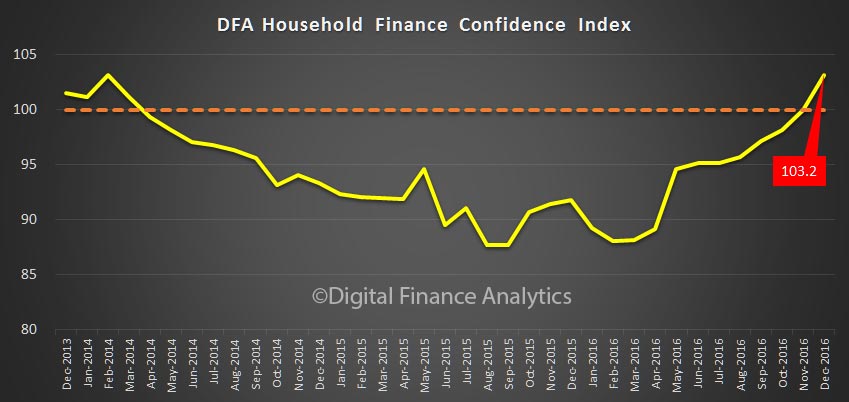
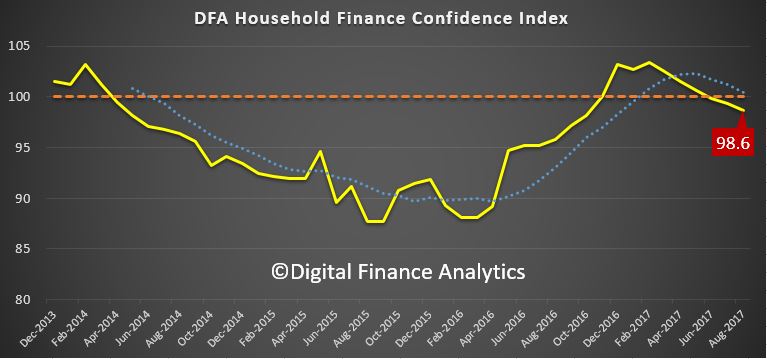
Digital Finance Analytics has released the August 2017 edition of our Household Finance Confidence index, which uses data from our 52,000 household surveys and Core Market Model to examine trends over time. Overall, households scored 98.6, compared with 99.3 last month, and this continues the drift below the neutral measure of 100.  This is an average score, and there are significant variations within our various segments.

Watch the video to learn more, or read the transcript below:

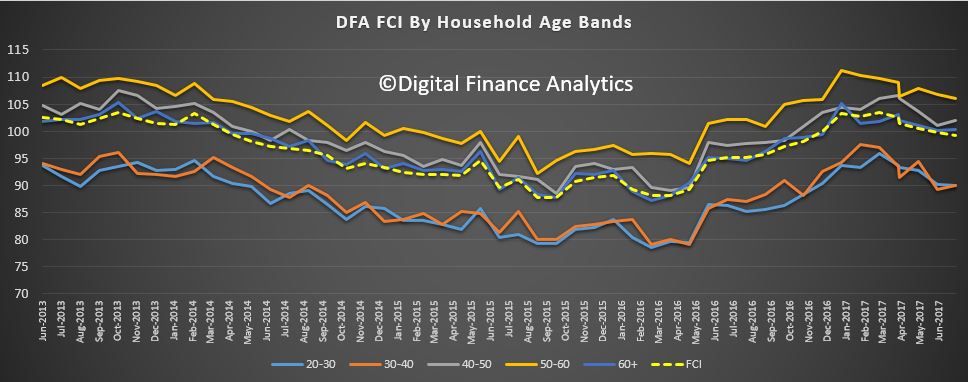
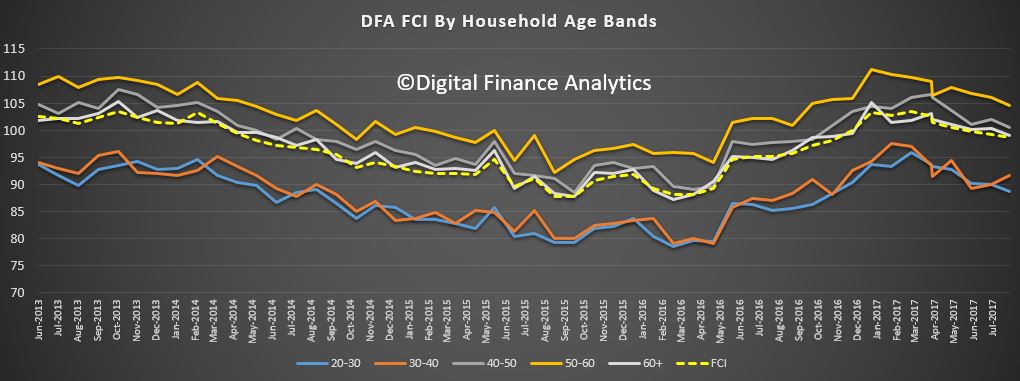
Younger households are overall less confident about their financial status, whilst those in the 50-60 years age bands are most confident. This is directly linked to the financial assets held, including property and other investments, and relative incomes. Households over 60 years track quite closely to the national averages.

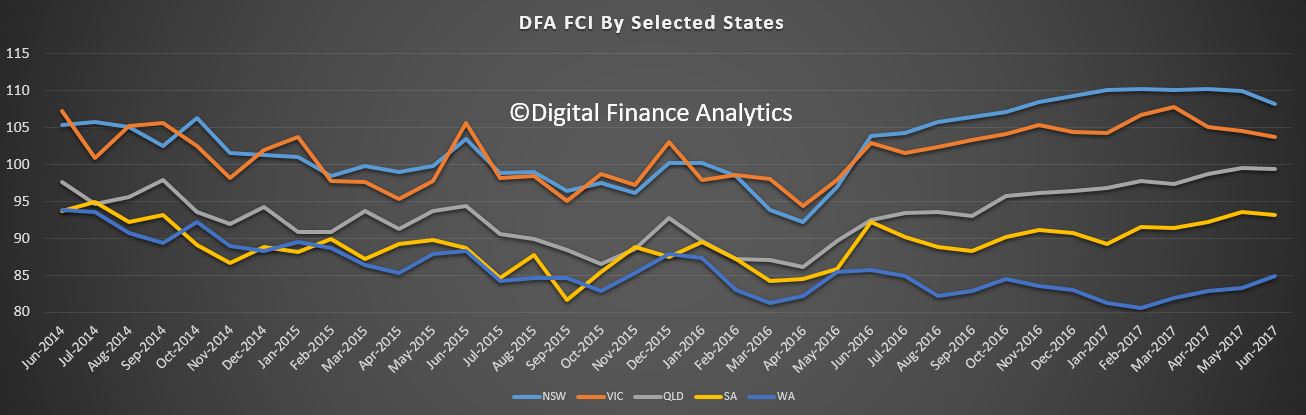
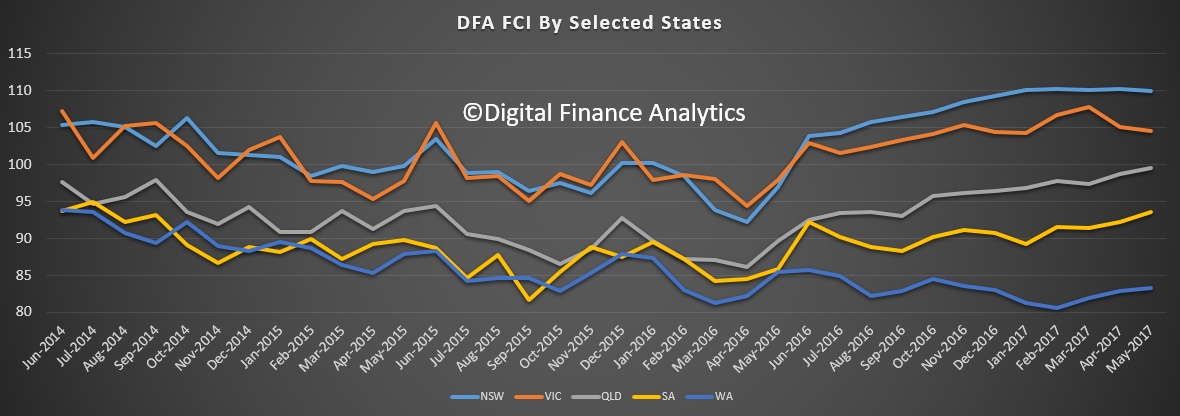
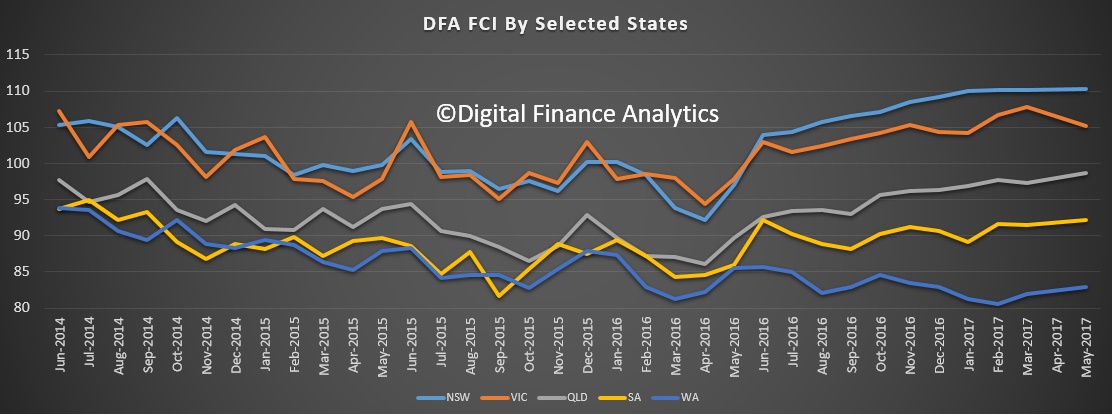
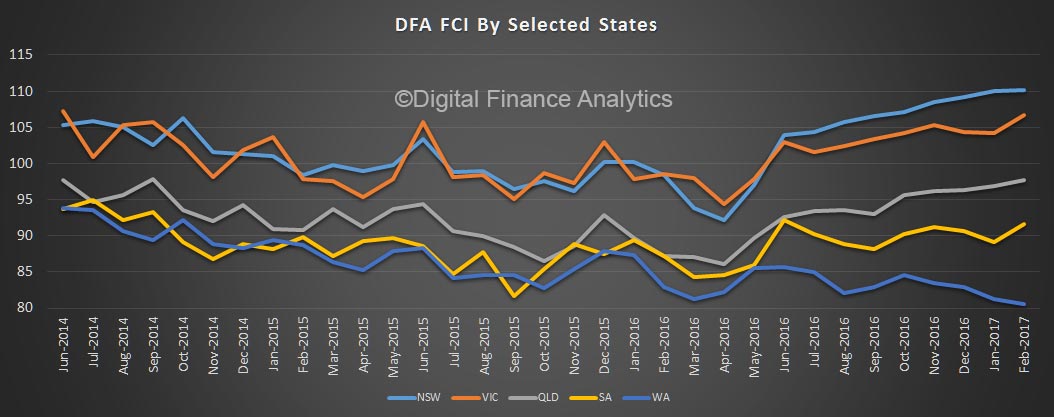
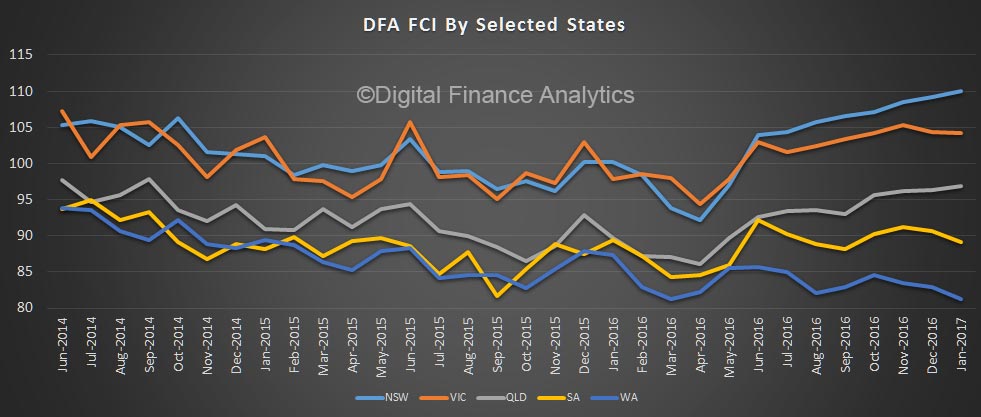
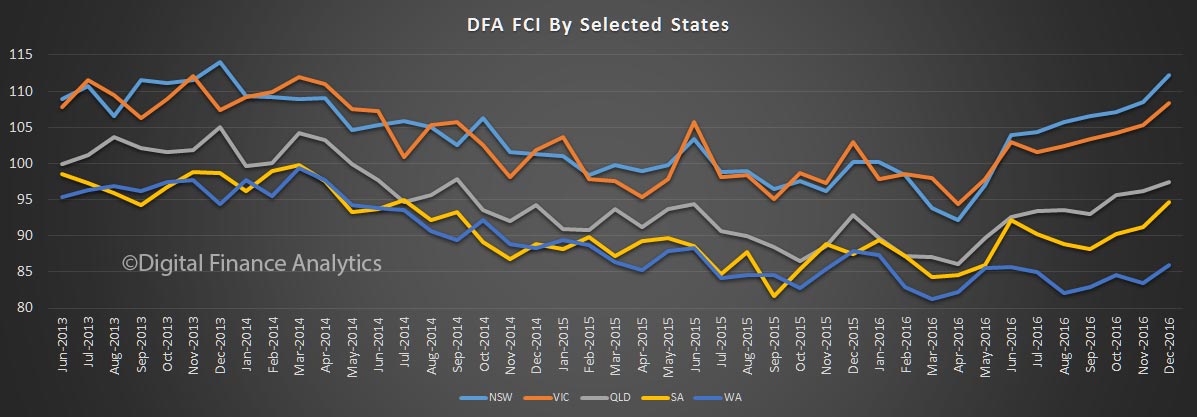
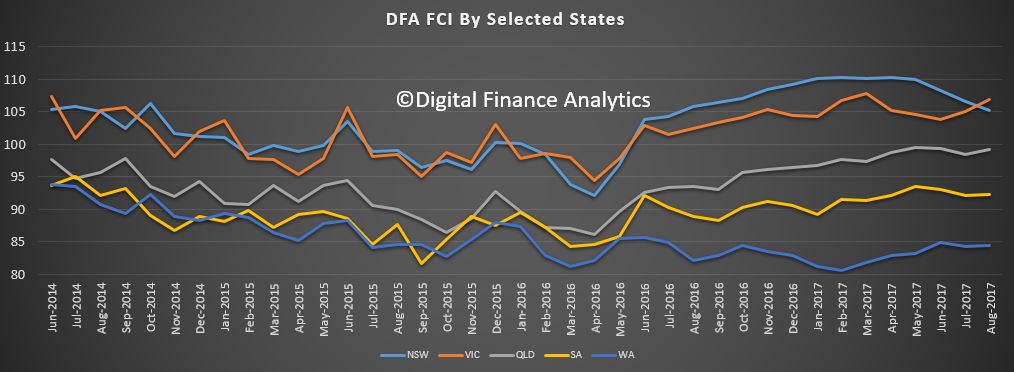
For the first time in more than a year, households in Victoria are more confident than those in NSW, while there was little relative change across the other states. One of the main reasons for the change in NSW can be traced directly to the state of the Investment Property sector, where we see a significant fall in the number of households intending to purchase in NSW, and more intending to sell. One significant observation is the rising number of investors selling in Sydney to lock in capital growth, and seeking to buy in regional areas or interstate. Adelaide is a particular area of interest.

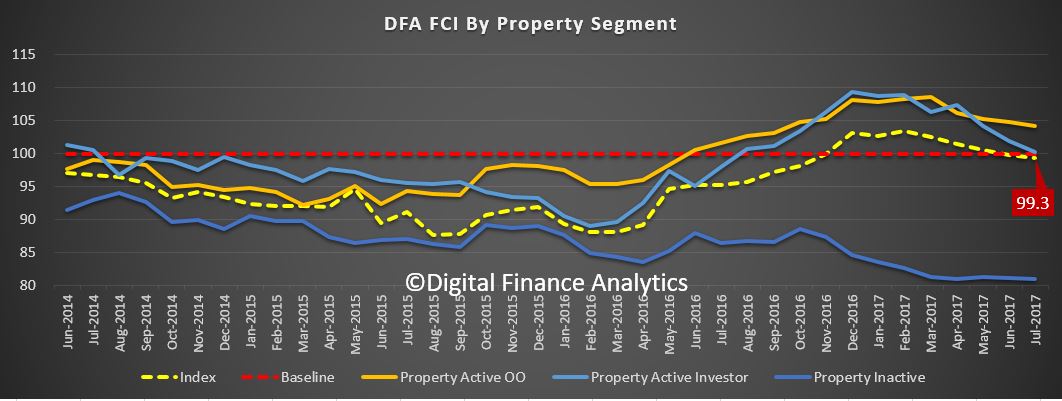
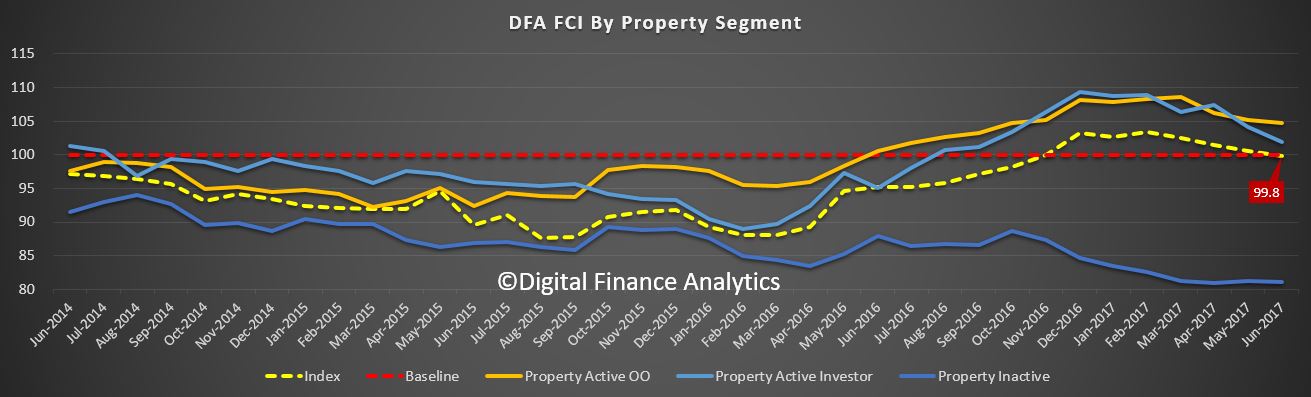
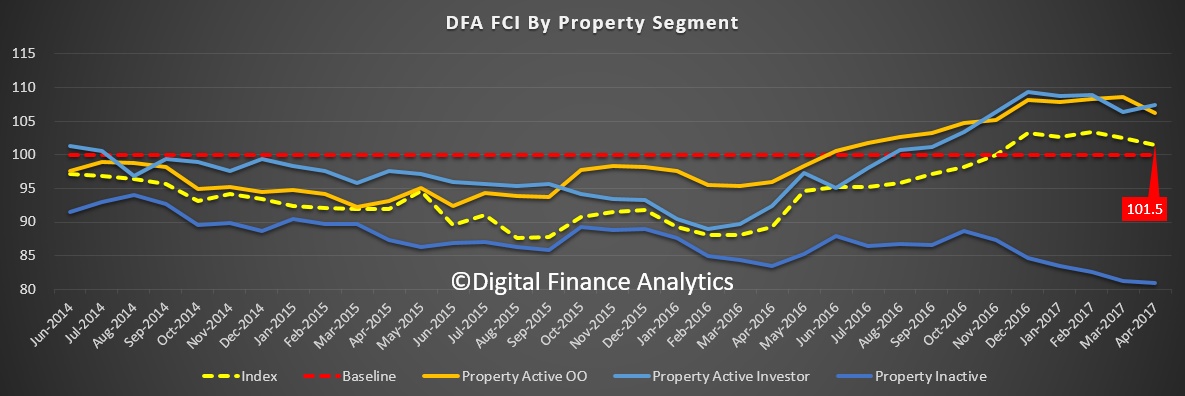
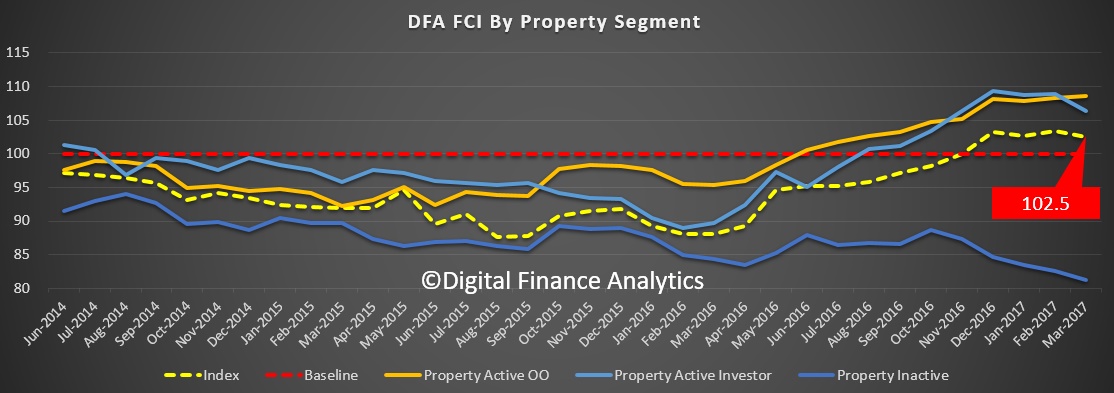
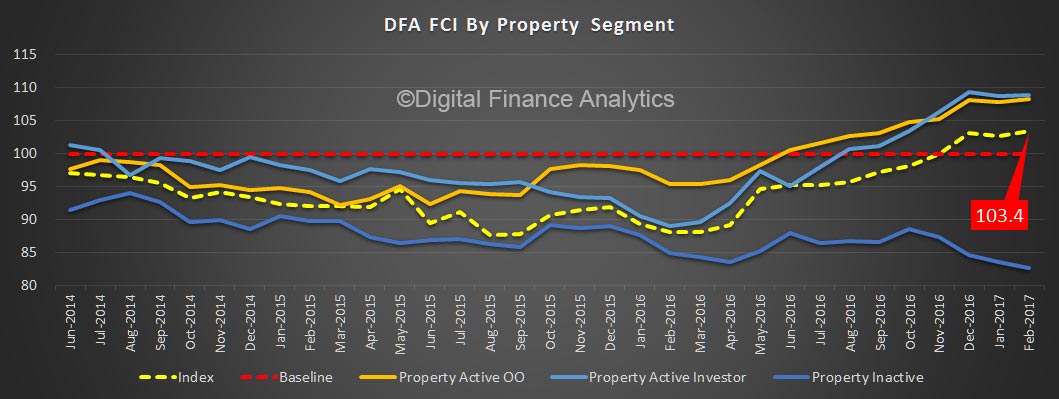
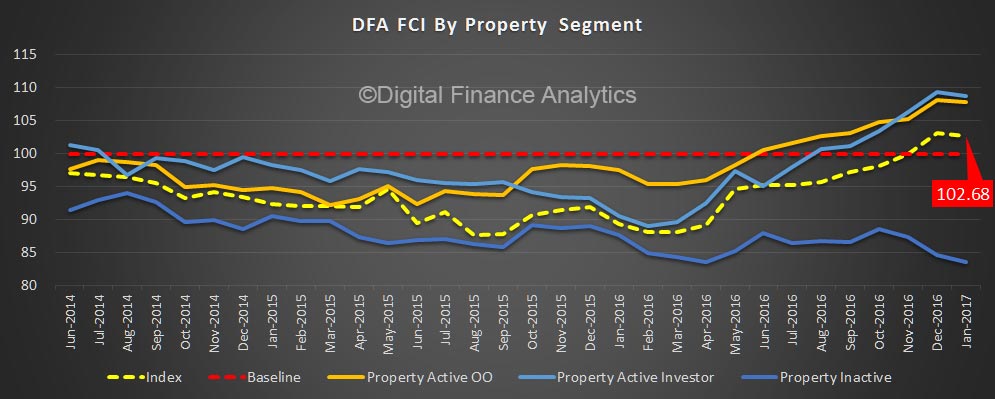
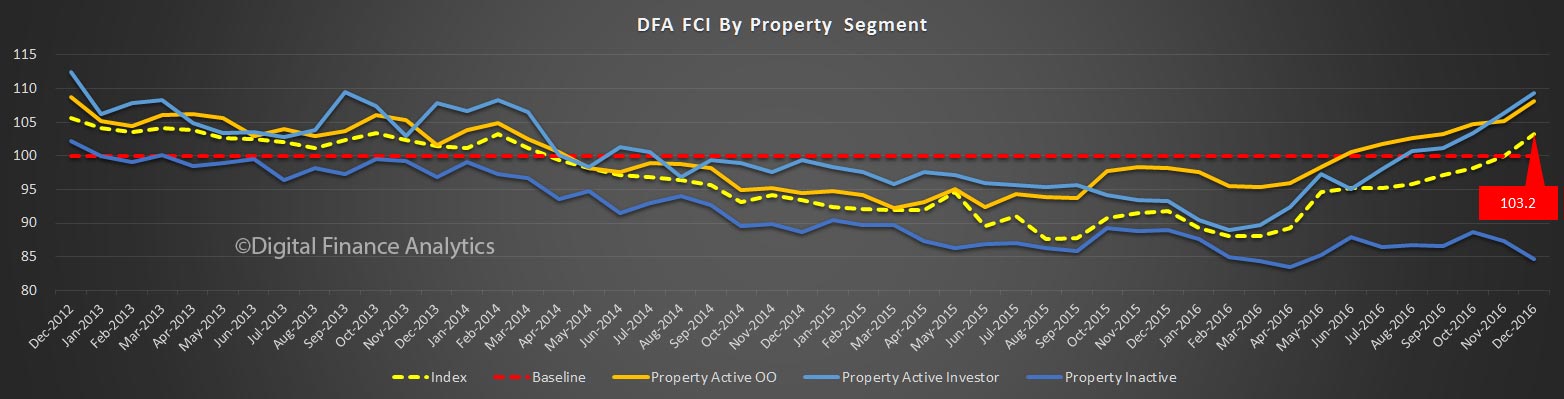
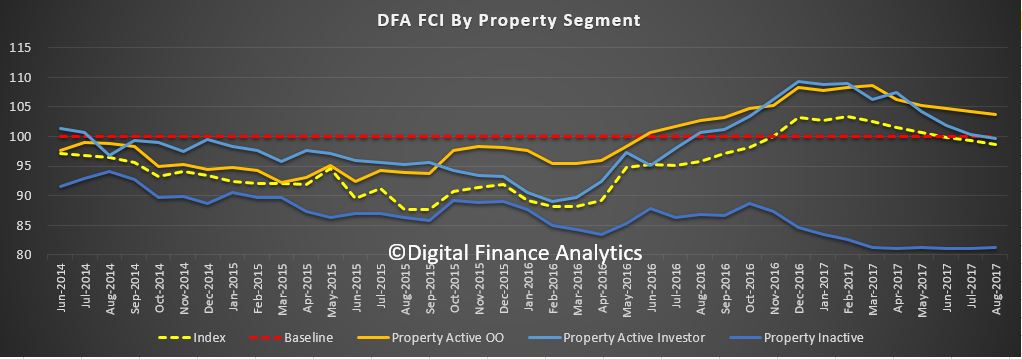
Consistent with our earlier analysis, a household’s property owing status has a significant impact on their relative financial confidence, with owner occupied households the most confident, ahead of  property investors and those renting. That said, low rental growth rates mean more investors are underwater on a cash flow basis, especially in Victoria, where more than half are not covering the borrowing costs of their investment mortgage from rental receipts (but are still hopeful of capital gains, and they can offset the losses thanks to tax breaks). Actually returns are much stronger in QLD and TAS.

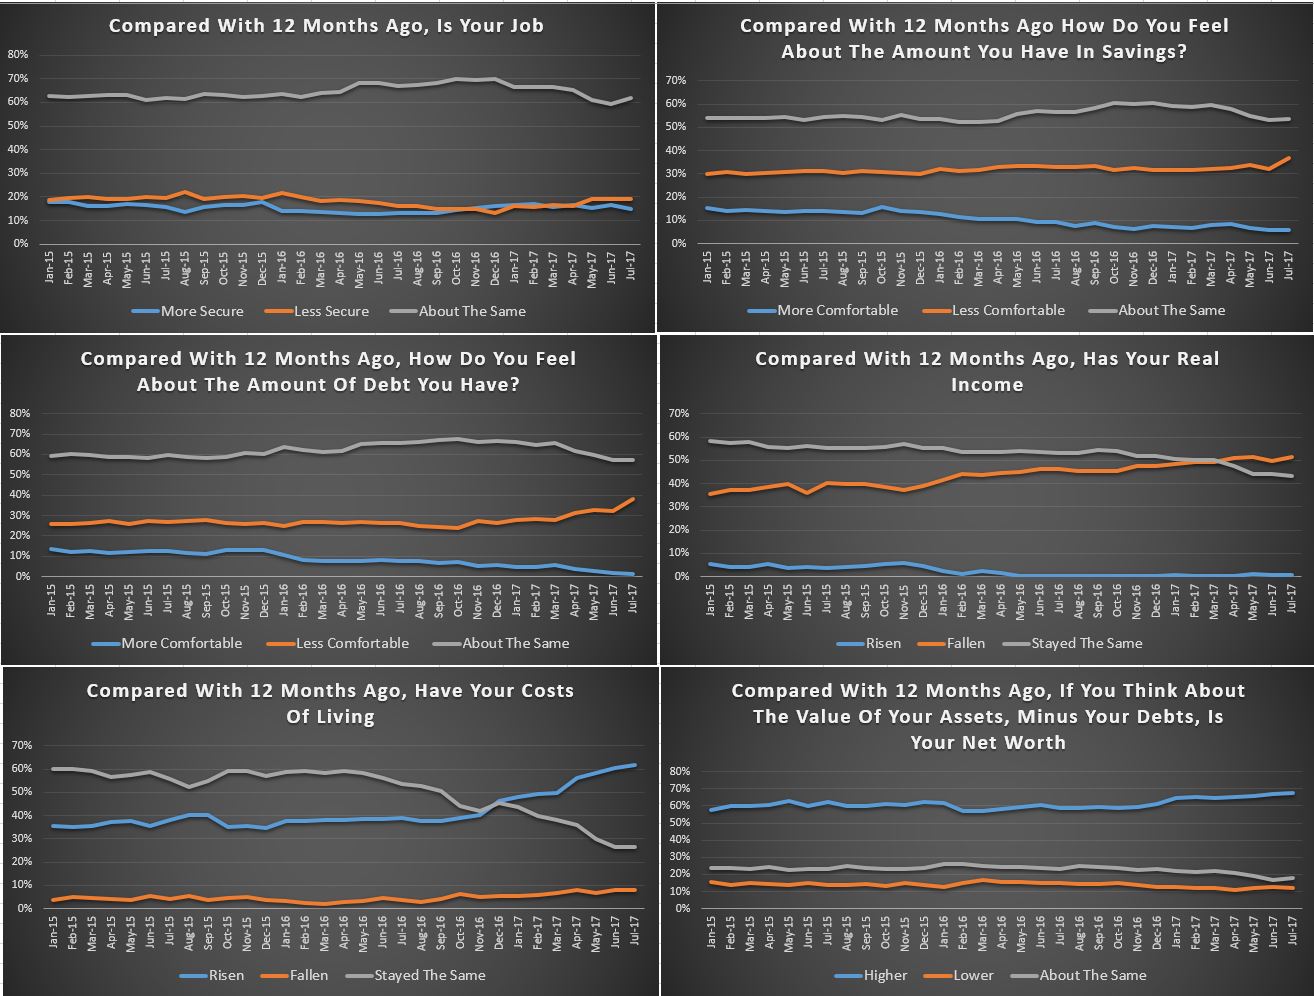
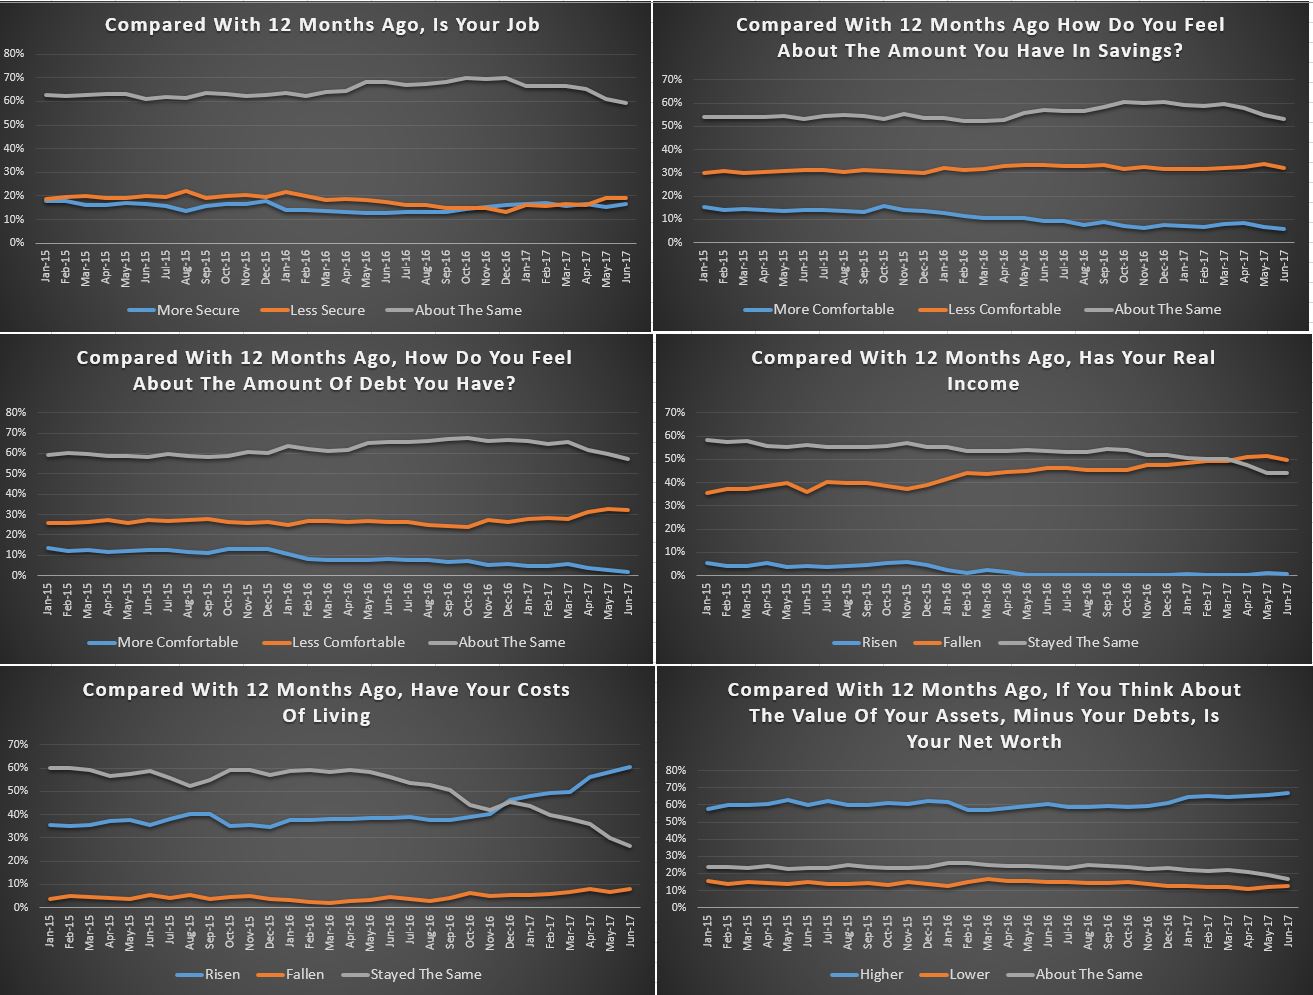
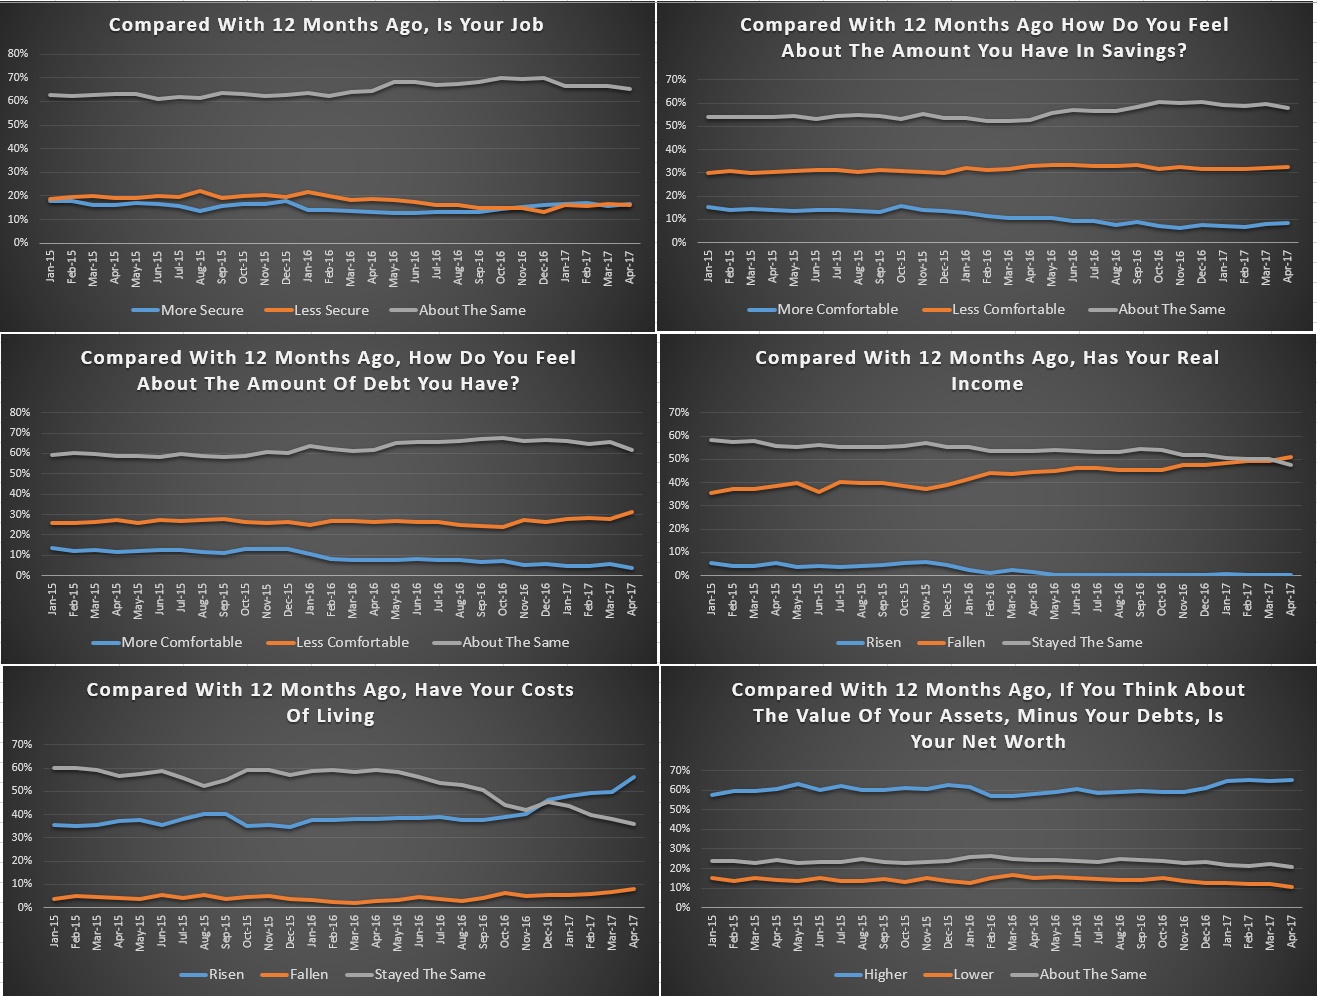
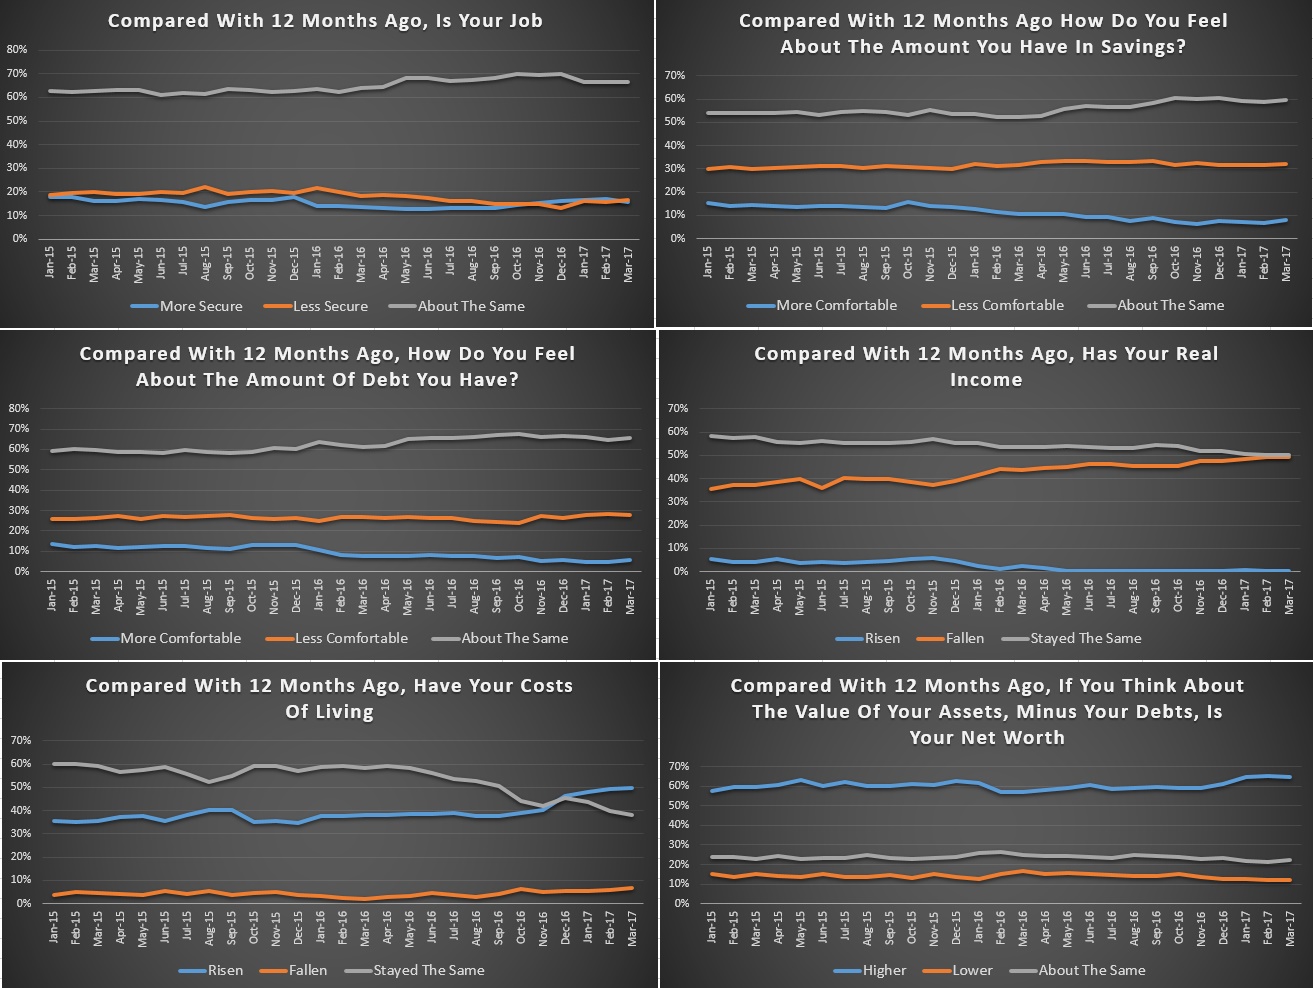
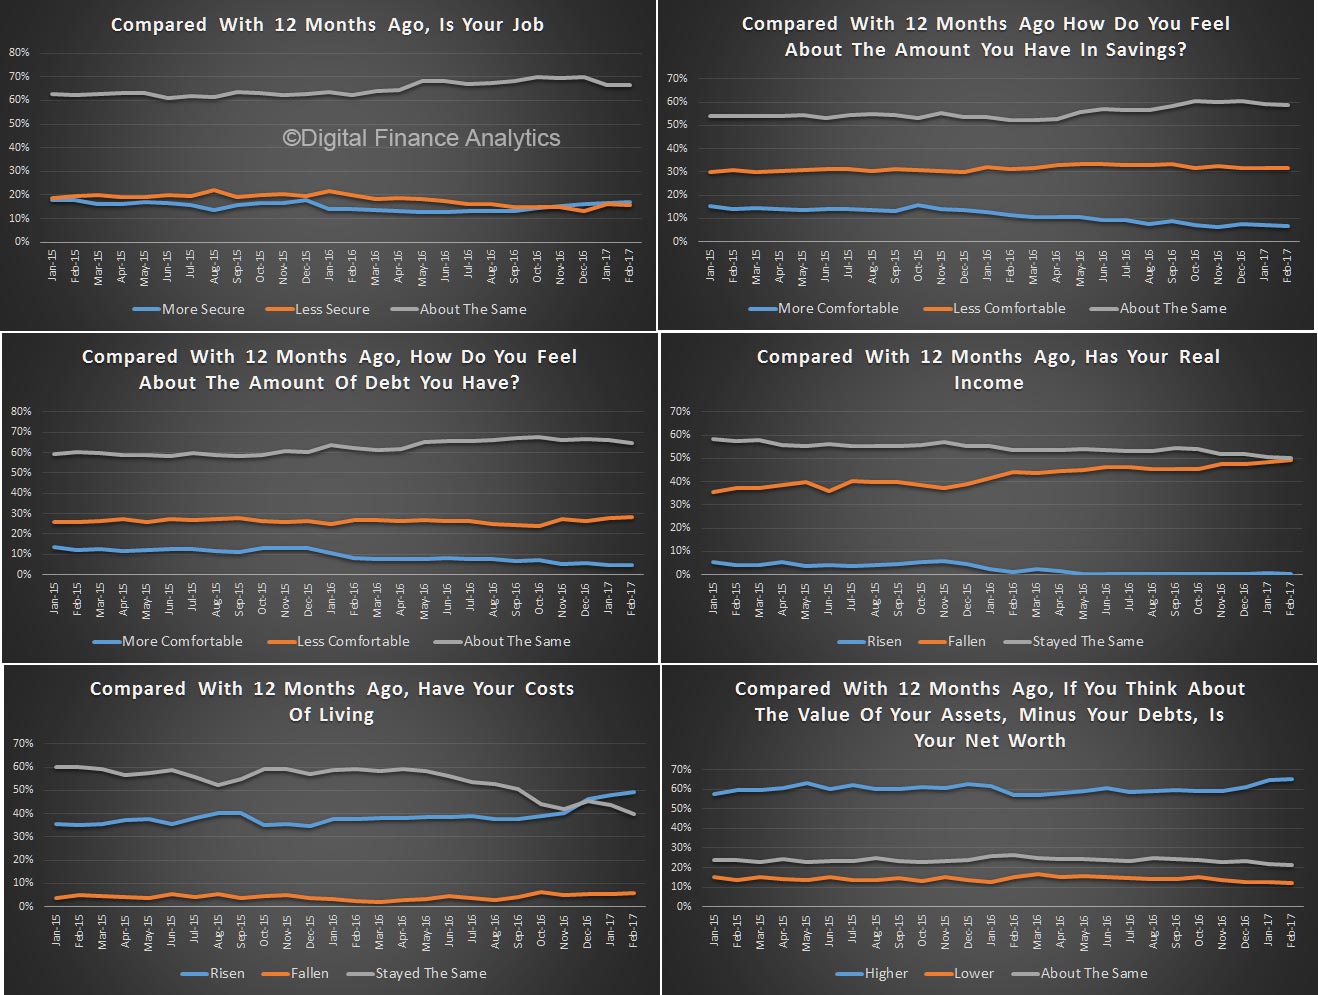
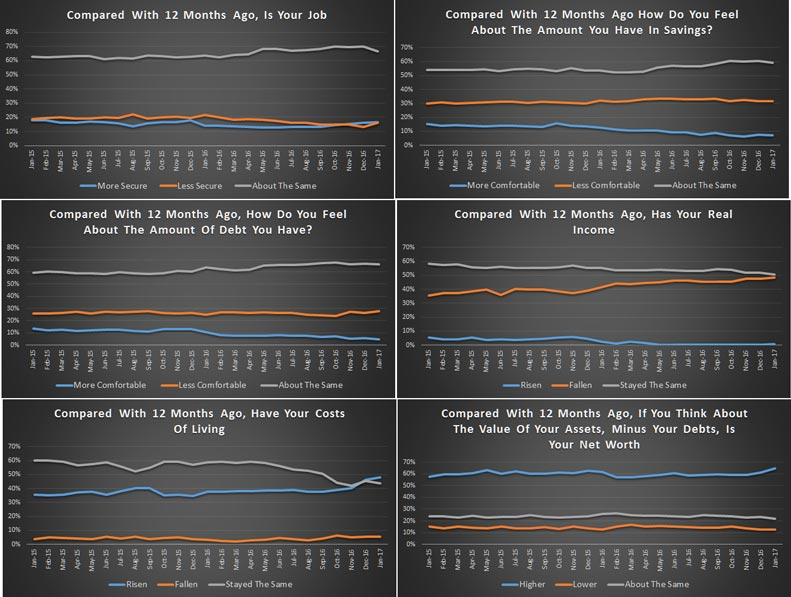
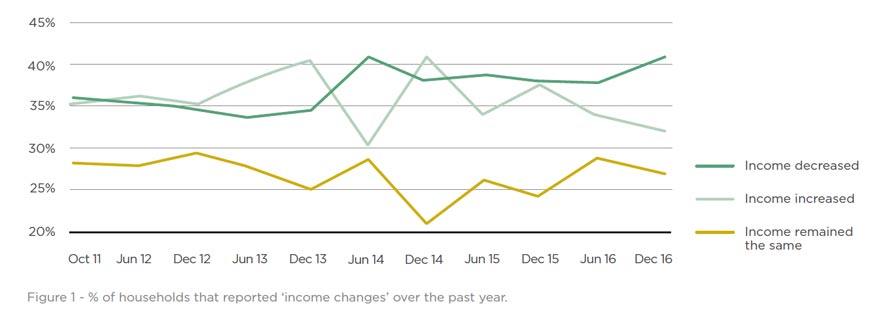
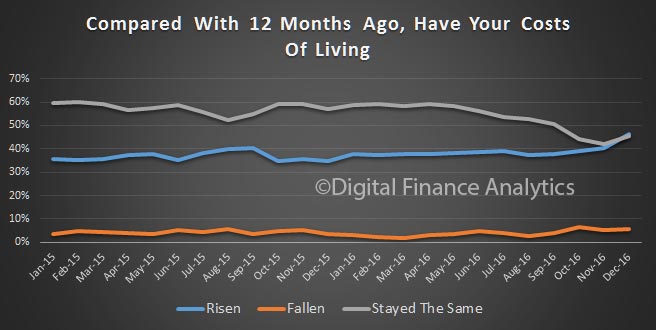
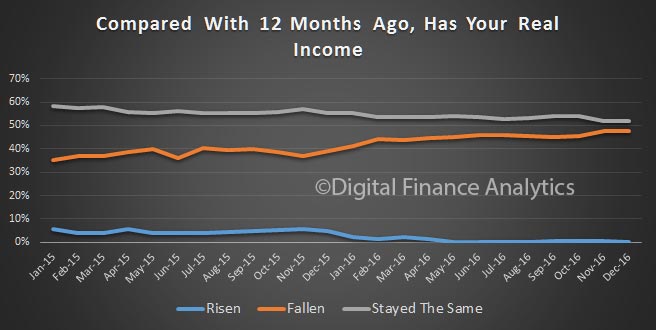
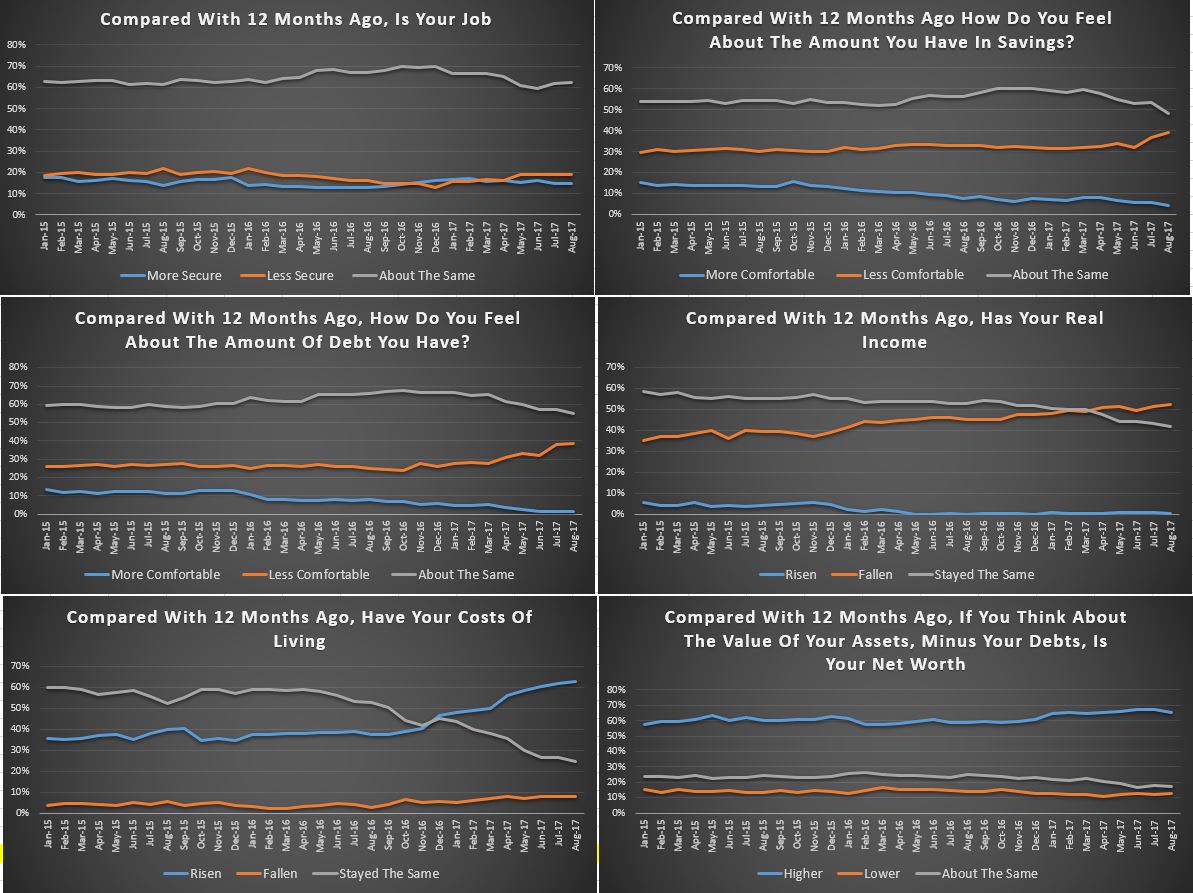
Looking at the scorecard, job security remained about the same this month, but there was a 1.7% fall in those more comfortable with their savings and a rise of 2.5% of those less comfortable – thanks to lower interest rates on deposits as banks seek to build margin.  The debt burden remained a concern, with a small rise in those worried about meeting repayments on outstanding loans.  Incomes are still under pressure, with more saying their incomes in real terms have been devalued, down 1%, to 52% of households.  Costs of living continue to rise for 63% of households, and only 7% saw a fall. 65% of households said their overall  net worth rose again, thanks mainly, to home prices rising. Some in WA, QLD and WA reported a fall, directly due to house values continuing to slip.

Given the fact that the dynamics of the economy seem to be locked in place with lower income growth, rising costs of living, and the property market adjusting to the new regulatory environment, we expect confidence to continue to drift lower in the months ahead. There is no obvious circuit breaker available in the current low interest rate, low growth environment. The leading indicators suggest that the recent positive momentum in the property market may be short lived.

By way of background, these results are derived from our household surveys, averaged across Australia. We have 52,000 households in our sample at any one time. We include detailed questions covering various aspects of a household’s financial footprint. The index measures how households are feeling about their financial health. To calculate the index we ask questions which cover a number of different dimensions. We start by asking households how confident they are feeling about their job security, whether their real income has risen or fallen in the past year, their view on their costs of living over the same period, whether they have increased their loans and other outstanding debts including credit cards and whether they are saving more than last year. Finally we ask about their overall change in net worth over the past 12 months – by net worth we mean net assets less outstanding debts.

We will update the results again next month.

Household Finance Confidence Continues To Fall

Digital Finance Analytics has released the July results from our Household Finance Confidence Index, which shows a further fall, with momentum decaying.

The average score was 99.3, down from 99.8 last month and below the neutral setting. However, the average score masks significant differences across the dimensions of the survey results. For example, younger households are considerably more negative, compared with older groups.

This is strongly linked with property owning status, with those renting well below the neutral setting (and more younger households rent these days), whilst owner occupied home owners are significantly more positive. We also see a fall in the confidence of property investors, relative to owner occupied owners.

Across the states,  we see a small decline in confidence in NSW from a strong starting point, whilst VIC households were more confident in July.

The driver scorecard shows little change in job security expectations, but lower interest rates on deposits continue to hit savings. Households are more concerned about the level of debt held, as interest rate rises bite home. The impact of flat or falling incomes registers strongly, with more households saying, in real terms they are worse off. Costs of living are rising fast, with the changes in energy prices, child care costs and council rates all hitting hard. That said, the continued rises in home prices, especially in the eastern states meant that net worth for households in these states rose again, which was not the case in WA, NT or SA.

Sentiment in the property sector is clearly a major influence on how households are feeling about their finances, but the real dampening force is falling real incomes and rising costs. As a result, we still expect to see the index fall further as we move into spring, as more price hikes come through. In addition, the raft of investor mortgage rate repricing will hit, whilst rental returns remain muted.

By way of background, these results are derived from our household surveys, averaged across Australia. We have 52,000 households in our sample at any one time. We include detailed questions covering various aspects of a household’s financial footprint. The index measures how households are feeling about their financial health. To calculate the index we ask questions which cover a number of different dimensions. We start by asking households how confident they are feeling about their job security, whether their real income has risen or fallen in the past year, their view on their costs of living over the same period, whether they have increased their loans and other outstanding debts including credit cards and whether they are saving more than last year. Finally we ask about their overall change in net worth over the past 12 months – by net worth we mean net assets less outstanding debts.


Household Finance Confidence Breaks Down

Digital Finance Analytics has today released the Household Finance Confidence index to June 2017, and the news is not good. Overall the index has dropped below the neutral setting and appears to be trending lower. The current reading is 99.8% compared with 100.6 in May.

The fall is being driven by a confluence of issues, none new, but now writ large. Households are seeing the costs of living rising (especially power costs, child care costs and council rates), whilst household income remains depressed and is falling in real terms. Returns on deposits actually fell as well, so mortgage repricing is not being matched by better saving rates. The costs of mortgage repayments rose.

The most significant fall in confidence was in the property investor segment, where loan repricing has been more pronounced, whilst rental incomes are hardly growing. They are also concerned about slowing capital appreciation. However it is still true that property owners have their confidence buttressed relative to property inactive households who are more likely to be renting, and see no rise in their net worth.

Looking across the states, confidence is still highest in the booming states of NSW and VIC, though down a bit; whilst WA is recovering a little from lows earlier in the year.

Looking at the scorecard, households are more concerned about the amount of debt they hold, real incomes continue to fall and costs of living continue to rise. This despite job security not being a major concern. Take home pay however is.

We expect to see the index fall further as we move into spring, as more price hikes come though (e.g 20% uplift in electricity for many). The raft of mortgage rate repricing still has to work though and income growth will remain contained. Sentiment in the property sector is clearly a major influence on how households are felling about their finances, but the real dampening force is falling real incomes.

By way of background, these results are derived from our household surveys, averaged across Australia. We have 52,000 households in our sample at any one time. We include detailed questions covering various aspects of a household’s financial footprint. The index measures how households are feeling about their financial health. To calculate the index we ask questions which cover a number of different dimensions. We start by asking households how confident they are feeling about their job security, whether their real income has risen or fallen in the past year, their view on their costs of living over the same period, whether they have increased their loans and other outstanding debts including credit cards and whether they are saving more than last year. Finally we ask about their overall change in net worth over the past 12 months – by net worth we mean net assets less outstanding debts.


Household Finance Security Wobbles Again In April

Today we release the latest monthly edition of our household finance confidence index for April 2017, which show a fall from 102.5 to 101.5, just above the neutral setting.

The index is drive from the results of our household surveys, and highlights some important movements, mostly related to the recent changes in the property market.

Property Investor levels of confidence weakened, thanks to rising mortgage interest rates and concerns about property prices and pre-budget speculation about changes to negative gearing. In fact owner occupier households are now more confident than investors. As usual households without property interests have a significantly lower level of confidence about their financial status.

The results by state shows that NSW leads the way, with households there still enjoying the glow of stronger employment and economic growth, to say nothing of high home prices. More people of course own property than not. VIC continues to weaken, costs of living appear to be accelerating there (especially child care and school fees, plus energy and council rates). Most other states saw a small rise, though from a position below the 100 neutral point. The divergence across the states is becoming more extreme.

Looking at the scorecards, whilst job security is about the same, households were less comfortable with their savings, and debt. Mortgage rate rises are working their way through, and many households with deposits in the bank are still seeing lower returns.

Falling real incomes are a strong factor in the mix, together with rising costs of living. these combined explain the rise in mortgage stress. Net worth is still improving thanks to home price appreciation, other than in WA, regional QLD and TAS.

By way of background, these results are derived from our household surveys, averaged across Australia. We have 52,000 households in our sample at any one time. We include detailed questions covering various aspects of a household’s financial footprint. The index measures how households are feeling about their financial health. To calculate the index we ask questions which cover a number of different dimensions. We start by asking households how confident they are feeling about their job security, whether their real income has risen or fallen in the past year, their view on their costs of living over the same period, whether they have increased their loans and other outstanding debts including credit cards and whether they are saving more than last year. Finally we ask about their overall change in net worth over the past 12 months – by net worth we mean net assets less outstanding debts.


Household Finance Confidence Wobbles

Digital Finance Analytics has released the latest edition of the Household Finance Confidence index, to end March 2017. The index fell slightly to 102.5 from 103.4, but is still slightly above a neutral setting.

Looking at the property segments, we find that whilst owner occupied households are a little more confident, property investor confidence fell, thanks to the recent noise about rising mortgage rates, possible changes to tax breaks and questions about future capital gains.

Looking across the states, confidence remains highest in NSW, but fell slightly in VIC. There were slight improvements in the other states.

Here is the scorecard which drives the index. Most striking is the fall in real incomes and small rises in concerns about job security. As interest rates rise, more households are concerned about debt. Despite this, property owning households saw their net worth rise.

By way of background, these results are derived from our household surveys, averaged across Australia. We have 52,000 households in our sample at any one time. We include detailed questions covering various aspects of a household’s financial footprint. The index measures how households are feeling about their financial health. To calculate the index we ask questions which cover a number of different dimensions. We start by asking households how confident they are feeling about their job security, whether their real income has risen or fallen in the past year, their view on their costs of living over the same period, whether they have increased their loans and other outstanding debts including credit cards and whether they are saving more than last year. Finally we ask about their overall change in net worth over the past 12 months – by net worth we mean net assets less outstanding debts.

Household Finance Security Index Higher Again In February

We have published the February 2017 edition of the Digital Finance Analytics Household Finance Confidence index (FCI) today, which shows a further small rise from the January 102.7 to 103.4. This is above the long term neutral setting, and after a significant dip in the past couple of years, the FCI is maintaining positive momentum.

However, the positive boost in predominately centered on momentum in the property market, with both owner occupied and investment property holders in positive territory, whilst those excluded from the property market, including renters and those living with family or friend get none of the upside, so their financial security is degrading further. This highlights the risks if the property market momentum were to reverse, and the bind that regulators face at the moment – do you keep the current settings and allow the market to continue to run, or tighten and risk reversing household sentiment and thus spending?

The state by state picture shows how uneven the confidence is, with households in the eastern states significantly more positive that in WA or SA.  WA grinds down, thanks to the pressure on the economy there, falling home prices and flat to falling incomes. Will the election result today make a difference?

Finally, here is the scorecard, which shows that real income in under pressure (up 1%), costs of living are rising (up 1%), concerns about debt levels are up a little (thanks to recent rate increases) but net worth is being bolstered by strong home price growth and rising stock markets.  The property sector is firmly linked to household confidence, and vice-versa.

By way of background, these results are derived from our household surveys, averaged across Australia. We have 26,000 households in our sample at any one time. We include detailed questions covering various aspects of a household’s financial footprint. The index measures how households are feeling about their financial health. To calculate the index we ask questions which cover a number of different dimensions. We start by asking households how confident they are feeling about their job security, whether their real income has risen or fallen in the past year, their view on their costs of living over the same period, whether they have increased their loans and other outstanding debts including credit cards and whether they are saving more than last year. Finally we ask about their overall change in net worth over the past 12 months – by net worth we mean net assets less outstanding debts.

Consumers won’t react the same to higher interest rates

From The Conversation.

The Reserve Bank today kept interest rates at a record low of 1.5%. Such low rates create economic uncertainty – and if Australia’s historical GDP growth is anything to go by, consumers face more uncertainty than the bottoming out of interest rates would usually suggest.

This is because high house prices lead home-owners to feel wealthy, yet the economy as a whole does not convey a message of wealth to all consumers.

Boom and bust come and go, and sometimes you can be forgiven for feeling economic déjà vu. But how might Australians react to record low rates this time around? Business moves in cycles over time, so economists sometimes look to history as a guide to what might happen next.

A flattening out of interest rates can mean many possibilities for consumers and businesses. Historical GDP growth rates would indicate that the business cycle is at the same stage as in 2011. But what this means for consumers depends on how the other economic “stars” align. The indicators from 2011 are able to provide a model of how consumers may react over the coming years.

Does 2011 provide a model?

The relationship between interest rates and unemployment has been of interest since target interest rates were introduced in 1990.

The rise in unemployment from 4% to 6% between July 2008 and May 2009 occurred at the same time as the Reserve Bank rapidly slashed the target interest rates.

However, with the Reserve Bank now unlikely to reduce interest rates any further, the impact on unemployment and other pointers for consumer behaviour may be different this time compared to 2011.

To predict consumer behaviour in the current uncertain conditions, the most appropriate method would be to consider past situations where GDP has gone up, and reflect on changes to key consumer indicators.

Based on Australia’s current GDP growth rates, and those of the last few decades, we are most likely at the “February 2011” stage of the business cycle – when growth was at 1.9%.

Based on the business cycle method of anticipating future consumer indicators, we would expect the trend to continue. Consumers would save the same or less of their income. And consumer sentiment would remain flat.

However, with property prices at all-time highs in capital cities, it is possible this will counteract rising interest rates when it comes to consumer expectations because there are conflicting messages. On the one hand, consumers feel wealthy because of property prices. However, they are expecting their mortgage repayments to increase when interest rates start to tick up.

In this environment it is expected that unemployment remains steady, as it has since 2009, with the sharemarket remaining flat. It is expected that as the sharemarket remains flat (or modestly increases) across developed countries, the price of gold continues to rise.

We can make these sorts of predictions, if 2011 is a guide to what will happen in the coming years.

ASX

But using 2011 as a benchmark to help predict future trends relies on the basic academic assumption that the points of reference (2011 and 2017) are identical. The world of 2011 was vastly different from the world today – it was almost naively uncomplicated.

Further dampening effects?

The differences between 2011 and 2017 will likely result in further dampening effects on the economic recovery. One of the major potential dampeners is Australia’s relatively high level of government debt.

The reduction in government debt in 2007 occurred almost simultaneously with the global financial crisis, higher consumer saving rates and a steady decline in GDP growth each quarter.

Hence, core economic fundamentals (such as how cutting government spending when the economy is already shaky will likely result in a greater negative GDP impact than when the economy is strong) deem that if the current government takes steps to reduce debt, this could have further dampening effects on the economy. This is despite a bottoming out of interest rates, which indicates the economy is projected to be on the way up.

Today’s world poses many challenges to forecasting how consumers will behave. One of the primary issues is high levels of debt (both for consumption and for property), which means a rise in interest rates will directly impact Australians. However, high property markets give consumers a feeling of wealth, despite the extreme lack of diversification across asset classes, and property that is hard to sell.

These competing forces mean consumers are likely to view formal government announcements with more scrutiny. As statements are made about improving economic prospects, individual consumers are feeling financial strain.

Combine these forces with increasing market complexity, product advances, geopolitical issues and climate change, and a certain level of unease is weighing on Australian minds, which goes over and above the likely increase in mortgage repayments.

A lot has changed since 2011

Technology disruptions are likely to further reduce trust in institutions, particularly banks, but may ultimately give consumers a greater feeling of empowerment and control.

In 2011, technological financial disruption was just a sparkle in Bitcoin’s eye. Now, technological disruption covers every sector imaginable. Many consider the future economy will be the collaborative economy.

The collaborative economy is one in which consumers and businesses share their resources (for a fee). This increases efficiency and saves cost to the end consumer.

For example, AirBnB (the largest accommodation provider in the world, which owns no accommodation) connects people who have extra space with travellers who are seeking an authentic, low-cost experience while travelling.

If the shift toward the collaborative economy continues, large institutions – particularly banks – will find it more difficult to make the significant profits they are used to.

Since 2011, consumers across the world have shifted to more community-based banking systems and have lent directly to others to achieve higher interest rates than bank deposits – particularly in a low-interest-rate environment. This trend is likely to continue.

Coupled with decreasing trust in institutions, it makes it unlikely that the predicted trends will be identical to those in 2011.

Author: Lecturer in Accounting, Finance and Economics, Griffith University

Household Finance Confidence Slips After Christmas Binge

We have released the latest edition of the Digital Finance Analytics Household Finance Confidence Index, to end January 2017 today, which is a barometer of households attitudes towards their finances, derived from our rolling household surveys.

The aggregate index fell slightly from 103.2 in December to 102.68 during January, but is still sitting above a neutral measure of 100, and the trend remains positive. However there are a number of significant variations within the index as we look across states and household segments. These variations are important

First, the state scores are wider now than they have ever been, with households in NSW the most positive, at 110, whilst households in WA slip further to 81. Households in VIC and SA also slipped a little, whilst households in QLD were a little more positive.

The performance of the property market is the key determinate of the outcomes of household finance confidence, with those holding investment property slightly more positive than owner occupied property owners, whilst those who are renting, or living with family or friends are significantly less positive. Whilst some mortgage holders have received or expect to see a lift in their mortgage rate, this is offset by strong capital growth in recent months. The NSW property holders, especially in greater Sydney are by far the most positive. Renters in regional WA, where employment prospects are weaker, are the least positive.

Looking in detail at the drivers of the index, we see a rise by 1% of households who are felling less secure about their employment prospects – especially those in part-time jobs – and more are saying they are under employed.

In terms of the debt burden, there was a 4% rise in those less comfortable about the debt they hold, thanks to rising mortgages, the Christmas spending binge and higher mortgage rates.

More household are saying their real incomes have fallen, up 3%, whilst those who say their costs of living have risen was up 8%.

To offset these negative indicators however, some households reported better returns from term deposits and shares, as well as a significant boost to capital values on their property. Those who said their net worth had risen stood at 64%, up 5% from last month.  The property sector is firmly linked to household confidence, and vice-versa.

By way of background, these results are derived from our household surveys, averaged across Australia. We have 26,000 households in our sample at any one time. We include detailed questions covering various aspects of a household’s financial footprint. The index measures how households are feeling about their financial health. To calculate the index we ask questions which cover a number of different dimensions. We start by asking households how confident they are feeling about their job security, whether their real income has risen or fallen in the past year, their view on their costs of living over the same period, whether they have increased their loans and other outstanding debts including credit cards and whether they are saving more than last year. Finally we ask about their overall change in net worth over the past 12 months – by net worth we mean net assets less outstanding debts.

Job issues a drag on Aussie households

Income cuts, record-high job insecurity and high rates of underemployment are putting stress on households’ financial comfort, according to ME’s latest Household Financial Comfort Report.

The Report shows a marked long-term deterioration in Australian households’ ‘comfort with income’, which remains at its lowest level since the Report began in 2011, at 5.55 out of 10.


Record low income gains highlight widening gap between rich and poor

ME consulting economist and Report co-author, Jeff Oughton, said the reasons for income worries were clear.

“Only 32% of households reported ‘income gains’ over the past year – one of the lowest levels since the first survey in 2011 and down from the corresponding figure of 38% 12 months ago,” said Oughton.

Oughton said income gains were more likely to be reported by those with higher incomes and wealthier Australians.

Almost one in two (or 46%) of households with incomes over $100,000 reported ‘income gains’, compared to 17% of households earning under $40,000. Conversely, 41% of households earning less than $40,000 reported income losses, compared to only 13% of those earning over $100,000.

“The rich appear to be getting richer, while the rest of Australia is struggling – there’s a divide across households,” said Oughton.

Households earning an annual income above $200,000 reported very high overall financial comfort of 7.10 out of 10 in December, compared with ME’s overall household financial comfort index (5.41 out of 10).

“We’re seeing a shift in the composition of jobs as the economy moves away from mining and manufacturing with many employees leaving longer-term jobs and taking up lower-paying less-permanent jobs, which is having a negative impact on their financial comfort,” said Oughton.

ABS data shows wage growth at historical lows over the past two years to the September quarter. ME’s Report supports this, highlighting low wage growth continued in the whole of 2016 and is causing financial discomfort for many households, exacerbated by job insecurity and underemployment.”


Job insecurity and underemployment

In addition to income cuts, high levels of underemployment and record high ‘job insecurity’ were also contributing to households’ historically low comfort with income.

“One in three Australian households (34%) reported ‘job insecurity’ – a record high and an increase of 9 points over the year to December 2016,” said Oughton.

“Furthermore, 56% of households felt that they would ‘struggle to find a new job within two months if they became unemployed’, an increase of 3 points over the past year, while only 37% said it would be ‘easy to find a job’, down 3 points in the past 12 months.”

“Despite Australia’s relatively low official unemployment rate of 5.8% in December 2016, ME’s Report shows 60% of part-time employees would like to ‘increase the hours they work’ and 70% of casual workers want to ‘change from casual to permanent employment’,” said Oughton.


Tighter purse strings

The proportion of households saving increased 3 points to 51%, with these households saving an extra $58 each month on average.

“Arguably reflecting tougher labour market conditions outweighing the impact of rising (net) wealth, households tightened their purse strings over the six months to December, saving more where they could and overspending less.

“It’s an increased conservatism that will be contributing to a drag on growth as Australia’s economic transition continues,” said Oughton.

Meanwhile, those households ‘spending more than they earn each month’ (9% of households) also cut back, reducing their overspending by an average of $55 less each month. Consistent with these findings, overall household comfort with cash savings rose by 3% to 4.94 out of 10 in the latest Report.


Other findings:

‘Single parents’ doing it the toughest: ‘Single parents’ reported the lowest levels of financial comfort the Report has seen (4.34 out of 10) – a 3% decrease in the six months to December 2016.

‘Gen X’ down in the dumps: ‘Gen X’s’ financial comfort decreased by 5% to the lowest level on record (4.92 out of 10), reflecting lower comfort across all key drivers with the biggest falls in comfort around debt (down 8% to 5.21) and incomes (down 6% to 5.19).

‘Retirees’’ financial comfort on the up: ‘Retirees’’ household financial comfort rose by 8% to 6.23 out of 10. Likely due to current majority of retirees not being faced with pending superannuation and pension changes, and having ridden the continued wave of growth in the property market and renewed strength in equity markets. Retirees’ ‘comfort with both their investments and wealth’ rose by 11% in the last six months, and their ‘ability to cope with a financial emergency’ is the highest of all household cohorts.

WA rebounds, at least temporarily: Financial comfort in WA increased by 6% to 5.34 out of 10, reversing the record low results seen in the previous Report (5.02 out of 10). Many key drivers of financial comfort rose, with double-digit gains in ‘investments’ and ‘cash savings’.

South Australians feeling the pinch: South Australians experienced an 8% decrease in financial comfort during the six months to December 2016. Many key drivers of financial comfort fell, with recent adverse weather and energy disruptions potentially weighing, at least temporarily, negatively on household comfort.

Positive Property News Supports Household Finance Confidence

The latest Digital Finance Analytics Household Finance Confidence Index, to end December is released today. Overall household confidence is buoyant, and above the neutral setting. Sitting at 103.2, it is up from 100.02 in November.

The property “fairy” has been generous in that property is the key to the index at the moment, with positive news on home price rises, and the effect of the low interest rates following the last RBA cash rate cut flowing through. Home owners with an investment property have now overtaken the confidence score of owner occupied property holders, but both are higher. Those households who are not property active however continue to languish.

We see significant state variations, with those in NSW and VIC most confident, whilst those in WA, although slightly higher, is significantly off the pace.  The impact of changes to the first owner grant there will not flow through into the results for some time to come.

The impact of positive property news has swamped a couple of the negative indicators. For example, more households are saying their costs of living have risen in the past 12 months.

In addition, real incomes, after adjusting for inflation are static or falling. Very few have had any pay rises above inflation, and many none at all.

So, it seems the future of household confidence is joined at the hip with the future of property. In the light of our recent mortgage default modelling, in a rising interest rate market, this may be a concern as we progress through 2017. But at the moment, households are having a party!

By way of background, these results are derived from our household surveys, averaged across Australia. We have 26,000 households in our sample at any one time. We include detailed questions covering various aspects of a household’s financial footprint. The index measures how households are feeling about their financial health. To calculate the index we ask questions which cover a number of different dimensions. We start by asking households how confident they are feeling about their job security, whether their real income has risen or fallen in the past year, their view on their costs of living over the same period, whether they have increased their loans and other outstanding debts including credit cards and whether they are saving more than last year. Finally we ask about their overall change in net worth over the past 12 months – by net worth we mean net assets less outstanding debts.