The latest edition of the DFA Household Finance Confidence Index (FCI) is released today, using data from our household surveys up to the end of November 2015. The index moved up a little, from 90.73 to 91.46, but still below the neutral setting of 100. So overall households remain cautious about their financial state in the run up to Christmas.
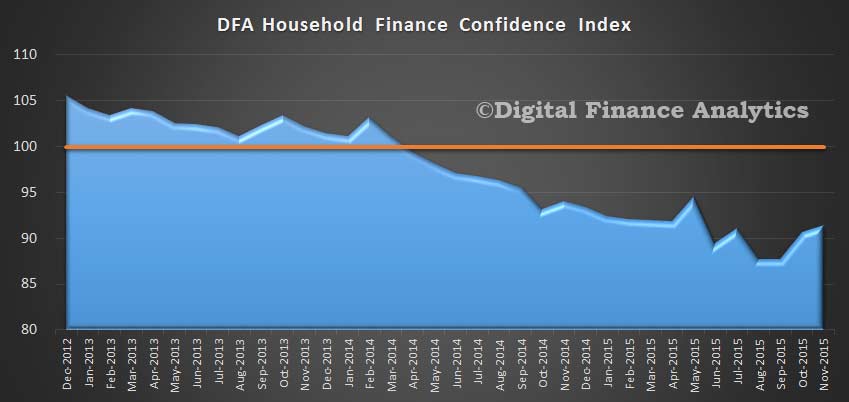 The results are derived from our household surveys, averaged across Australia. We have 26,000 households in our sample at any one time. We include detailed questions covering various aspects of a household’s financial footprint. The index measures how households are feeling about their financial health. We discuss the findings in the video below.
To calculate the index we ask questions which cover a number of different dimensions. We start by asking households how confident they are feeling about their job security, whether their real income has risen or fallen in the past year, their view on their costs of living over the same period, whether they have increased their loans and other outstanding debts including credit cards and whether they are saving more than last year. Finally we ask about their overall change in net worth over the past 12 months – by net worth we mean net assets less outstanding debts.
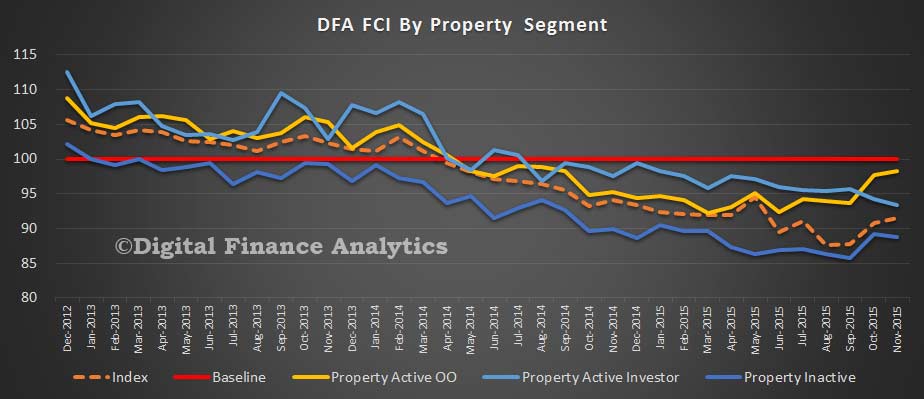
One of the more interesting aspects of the research highlights that households who are property investors continue to have their overall confidence eroded, driven by the higher costs of finance and doubts about the prospect of future capital growth. This echoes the fall-off in investment lending we have been tracking in recent weeks. The downturn in investor confidence is most marked in NSW. On the other hand, owner occupied property owners have become relatively more confident, thanks to continued low interest rates. Those households who are property inactive (renting, or seeking to buy) remain the least confident sector.
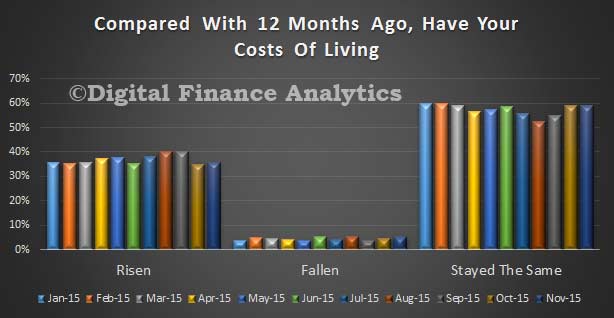
 Looking at the elements which drive the index, we find that 35.5% of households say their costs have increased in the past year, up by 0.6% from last month, whilst 5% say their costs have fallen. 59% say there has been no net change, thanks to lower mortgage interest costs over the year, helping to offset other rising costs. Low inflation levels are helping.
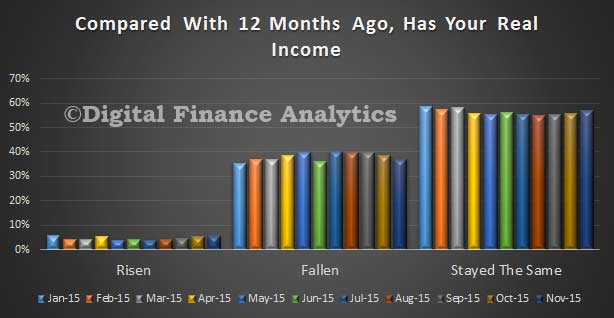
 Income growth remains under pressure, with 5% saying their income has rising in the part year (after inflation), and 37% saying their real incomes have fallen, whilst 57% said there was no change. Many have not received any rise in pay over the past year, and are relying on more overtime to lift take-home wages. One respondent said ” we are simply running harder, just to stand still”.
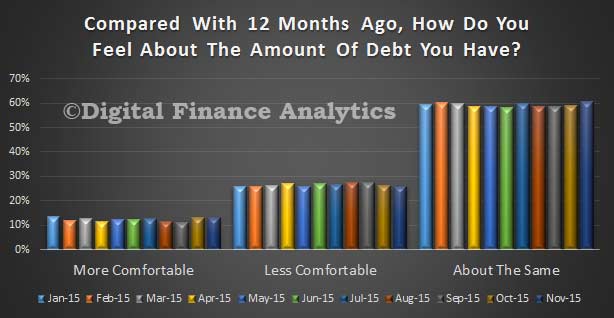
 Looking at debt levels, 61% said they had more debt than last year, 23% said there was no change, and just 15% said their debt was lower (up by 1.6% last month). Mortgages continue to be the main burden, and some households (those generally more affluent) are continuing to reduce their credit card and loan debt. We did also note a continued rise in small loans, from households under financial stress.
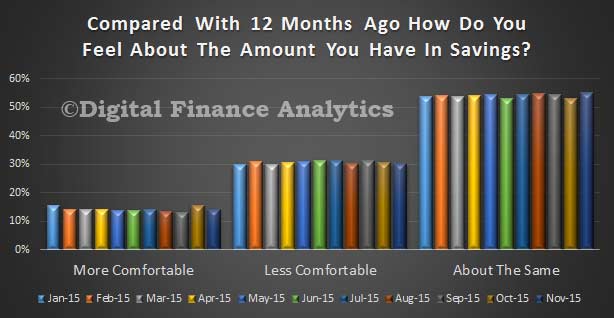
 Many households have little money in the bank for a rainy day, but of those who are saving, 14% said they were more comfortable with their savings than a year ago which is down 1.5%, and linked directly to continued low rates of return available on many bank deposit accounts. Around 30% were less comfortable, because they had to dip into their savings to pay the bills, and in the run up to Christmas, down a little from last month. Several commented on recent stock market falls, and the risks to their investments running into 2016.
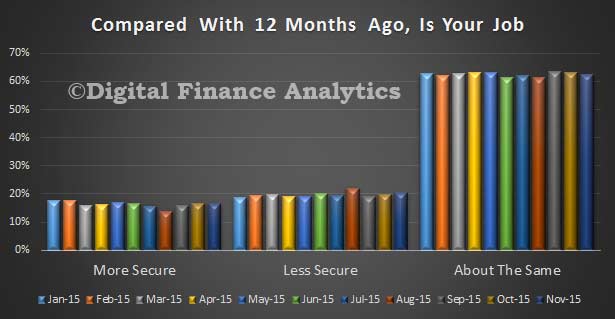
 Job security was quite varied, depending on region and industry. Those employment in (lower paid) service industry jobs – for example in healthcare in NSW, were the most confident, whilst those in mining, agribusiness and construction, especially in WA and SA were more concerned. 17% felt more secure than a year ago, 62% felt about the same, and 20% felt less secure. Younger households felt less secure than more mature households.
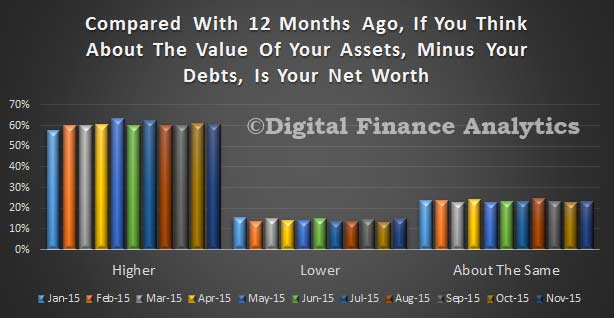
 Finally, 60% of households said their net worth was higher than a year ago, down a little from last month, thanks to recent stock market adjustments, and property coming off in several locations. 15% said their net worth was lower (a rise of 1.6% compared with last month), and 23% said there was no change.
 We think it quite likely we will see continued improvement in coming months, although if house prices start to tumble, or interest rates were to rise, this would have an immediate negative impact. We would also observe that households remain cautious, and whilst we expect something of a spending boom over Christmas, it looks like it will be tempered by limited increases in personal credit, and lack of available savings.
 Within the property segments, we saw little change in owner occupied households whilst there was a small rise in property investor households confidence, as talk of negative gearing changes dissipated and property price growth remained quite robust, this despite offsets created by rising interest rates. Property inactive households remained the least confidence, especially as rental growth is still above income growth, so housing is becoming ever more expensive.


