Airbnb regulation needs to distinguish between sharing and plain old commercial letting

From The Conversation.

Airbnb and other short-term letting websites have been a hot topic of debate for some time. In New South Wales, it seems the state government is on the verge of announcing a new short-term letting policy. Our research suggests about a quarter of Airbnb properties in the city are essentially commercial short-term letting operations.

But as cities like Berlin and Barcelona have learned, regulating these platforms is not always easy. Enforcing restrictions against individual hosts can be costly. Airbnb has also challenged regulations limiting short-term letting.

At the same time, there has been a lot of hype about platforms like Airbnb as leaders of a new “sharing economy”. This has made some governments wary of interfering with a potentially lucrative economic driver.

How do you tell if it’s sharing or business?

To ensure these new platforms are regulated effectively, it’s important that we understand exactly what they do, and the impacts they’ve having. Despite Airbnb’s efforts to promote itself as being all about sharing, there’s actually a mix of activities happening on its platform. In a new research paper, we examined these different activities, to better identify how Airbnb is being used and whether the platform should be viewed as a “sharing economy” superstar.

Overall, we found that in late 2016, about a quarter of Sydney’s Airbnb listings were best viewed as short-term letting businesses, rather than examples of the sharing economy in action. The figure was greater for other global cities we looked at – 26% in New York, 28% in London and Hong Kong, and a hefty 49% in Paris.

So how did we reach this conclusion? To start, we needed a definition of the “sharing economy”. We took this to mean economic activity involving the sharing of excess capacity in an asset or service, which is driven by a sharing attitude.

We then took a close look at listing data from the five cities and identified two categories of use:

  1. House sharing, which includes advertising part of a house (a private or shared room) or a whole house for a small portion of the year (up to 90 days). These uses suggest that the property is otherwise meeting someone’s permanent housing needs.
  2. Traditional short-term lets, meaning properties permanently offered for short-term rental, thus preventing their use as long-term housing. This includes properties available or booked for more than 90 days per year, and those where the host has multiple listings.

By categorising listings this way, we get a clearer sense of whether Airbnb is really being used to share spare housing capacity, or to run commercial rental accommodation.

Unfortunately, Airbnb keeps tight control over data about the use of its platform. This makes it challenging to quantify these uses.

To get around this, a few organisations have scraped and collated data from Airbnb’s website. While much existing research uses a dataset from Inside Airbnb, our research complements this work by using a dataset produced by the company AirDNA. While neither dataset is perfect, together they provide an increasingly clear picture of Airbnb’s impact.

What did our research find?

Our findings show a significant share of Airbnb hosts are using the platform to engage in economic activity that existed long before Airbnb did – that is, dwellings are used as serviced apartments, B&Bs or holiday rentals. This is commercial activity, not sharing. These properties aren’t just “excess” unused housing space and there’s no “sharing attitude” involved.

While commercial properties are not the majority of listings, other research suggests that this activity nonetheless generates a larger proportion of Airbnb’s income than home-share activity. In many cities this activity is also already subject to planning laws and land-use regulations about “tourist accommodation”. This means these Airbnb listings are potentially in breach of existing laws.

Furthermore, by mapping the Sydney listings we can see that while these traditional short-term lets were only about a quarter of listings, they were overwhelmingly concentrated in suburbs with very tight rental markets.

LOCATION OF TRADITIONAL SHORT-TERM LETTING

LOCATION OF HOUSE SHARING

Another factor is the rapid growth of Airbnb since late 2016. Australia now has 87% more listings than in late 2016. That’s a lot of properties in popular neighbourhoods that might otherwise be long-term rentals. So not only is this commercial activity not “sharing” at all, it’s also potentially pushing renters into shared living elsewhere, by reducing the amount of available rentals.

What does this mean for regulation?

So where does this leave our regulators? In our view, any policy decision needs to account for the different uses of these platforms, and be particularly focused on the impact of commercial short-term letting. While house sharing also raises concerns – particularly in apartment complexes – it at least fits the “sharing economy” model and arguably provides some of the shared financial, social and environmental benefits sharing economy supporters claim.

At the same time, regulators need to act on the lack of transparency in debates about platforms like Airbnb. Without good data, it will be tough for regulators to target their efforts at the most problematic aspects of new technologies. As we conclude in our research paper:

If Airbnb is genuinely committed to the ideal of ‘sharing’, as it regularly claims, it should share its data with regulators, even if it is not made publicly available. Airbnb’s unwillingness to do so (to date) indicates its sharing rhetoric is more of a sales pitch than a guiding philosophy.

Authors: Laura Crommelin, Research Lecturer, City Futures Research Centre, UNSW; Chris Martin, Research Fellow, City Housing, UNSW; Laurence Troy, Research Fellow, City Futures Research Centre, UNSW

Home Prices Vs Gravity; Gravity Wins – The Property Imperative 02 June 2018

Welcome the latest edition of the Property Imperative Weekly to 2nd June 2018, our digest of the latest finance and property news with a distinctively Australian flavour.

Watch the video, listen to the podcast, or read the transcript.

The average home value fell in May 0.1% and took the annual change down (-0.4%) and into negative territory for the first time since October 2012 according to the latest CoreLogic index. May marked the eighth consecutive month-on-month fall since the national market peaked in September last year, taking the cumulative fall in dwelling values to 1.1% through to the end of May 2018. This was caused by weaker conditions in Sydney and Melbourne, although some regional centres did move higher. But the sheer weight of numbers means the overall index is hit when Sydney and Melbourne fall, as around 60% of properties are in these two centres.

The root cause of the falls is simple; credit is harder to get. Our surveys show that up to 40% of applications for mortgages are now being turned down, compared with just 5% a year ago, as lenders apply more forensic analysis of applications received. For example, as we discussed yesterday, CBA is now looking at applications with a loan to income of 4.5 times and above, – see our post  A Deeper Dive into Loan To Income Ratios. And I am getting more reports of households who are finding their available borrowing power is as much as 35% down on a year ago.

So unlike the small correction which occurred to the CoreLogic Index in 2015, as credit was harder to get briefly, and which reverted a few months later, we think it’s different this time.

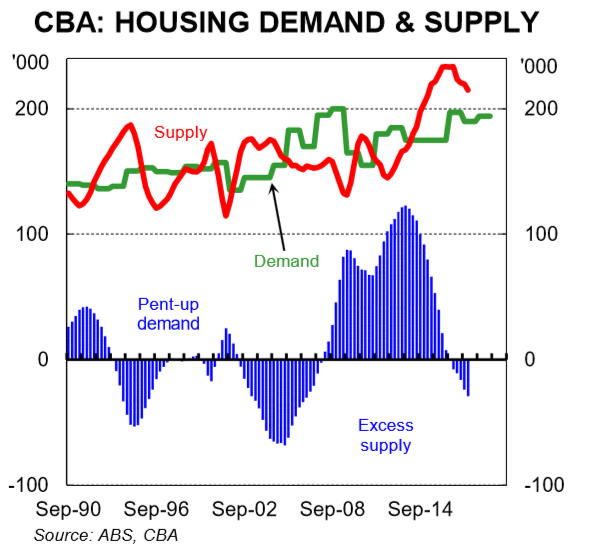
As we discussed in our post What’s Happening to Bank Lending?  the RBA released their credit aggregates to April 2018. Total mortgage lending rose $7.2 billion to $1.76 trillion, another record. Within that, owner occupied loans rose $6.4 billion up 0.55%, and investment loans rose just 0.14% up $800 million.  Personal credit fell 0.3%, down $500 million and business lending rose $6.3 billion, up 0.69%. The annualised stats show owner occupied lending is still running at 8%, while business lending is around 4% annualised, investment lending down to 2.3% and personal credit down 0.3%.  On this basis, household debt is still rising. But the Bank lending data from APRA showed that tighter lending standards are biting.  In fact, Westpac apart, all the majors reduced their investor property lending in April. Owner occupied loans grew by 0.29% or $3.1 billion to $1.07 trillion while investment loans fell slightly, down 0.01% or $42 million.  As a result, the relative share of investment loans fell to 34.14%.

Melbourne has taken over from Sydney as the weakest performing housing market over the past three months with a 0.5% fall in values over the month of May to be 1.2% lower, over the previous three months. This is the largest decline in Melbourne dwelling values over a three-month period since February 2012. We expected this, as Melbourne’s housing market was running ahead of Sydney, but recently auction clearance rates have been deteriorating, inventory levels are rising and transaction activity is tracking 12.9% lower than one year ago.

In Sydney home prices showed a month-on-month fall, down 0.2%, Perth was down -0.1%, Darwin down -0.2% and Canberra down -0.1%. Sydney was the only capital city other than Melbourne to record a decline in dwelling values over the past three months, with a 0.9% fall. Hobart’s impressive run of capital gains continued and is showing little signs of slowing down with dwelling values jumping 0.8% over the month to be 3.7% higher over the rolling quarter and 12.7% higher year-on-year. But of course it’s a small market.

Again we are seeing the strongest falls at the top end of the market, as we discuss last week. In Sydney, the most expensive quarter of the market has seen dwelling values fall by 7.1% since peaking compared with a 1.4% fall across the least expensive quarter of the market and a 3.3% decline across the broad ‘middle’ of the market. Similarly, in Melbourne, the most expensive quarter of the market is down 3.3% since peaking, while the broader middle market saw dwelling values fall by 0.8%. The most affordable quarter of properties did not decline at all, remaining at record high values. Because of the price differential, units are performing a little better than houses.

It is also worth looking in more detail at the regional areas, as we see significant variations. CoreLogic says that across the regional markets, Geelong retained its position as the best performing area outside of the capital cities with dwelling values up 10.2% over the past twelve months. The top ten performing regional markets are a mix of satellite cities such as Geelong, Ballarat and Newcastle, as well as lifestyle markets such as the Sunshine Coast, Southern Highlands, Shoalhaven and Coffs Harbour. Regional housing trends are also now seeing less drag from the mining regions. Although the weakest performing areas are generally still linked to the mining and resources industry, the declining trend has eased or even levelled across many of these markets. Mackay in QLD was the worst performing area down 10.6% year on year.

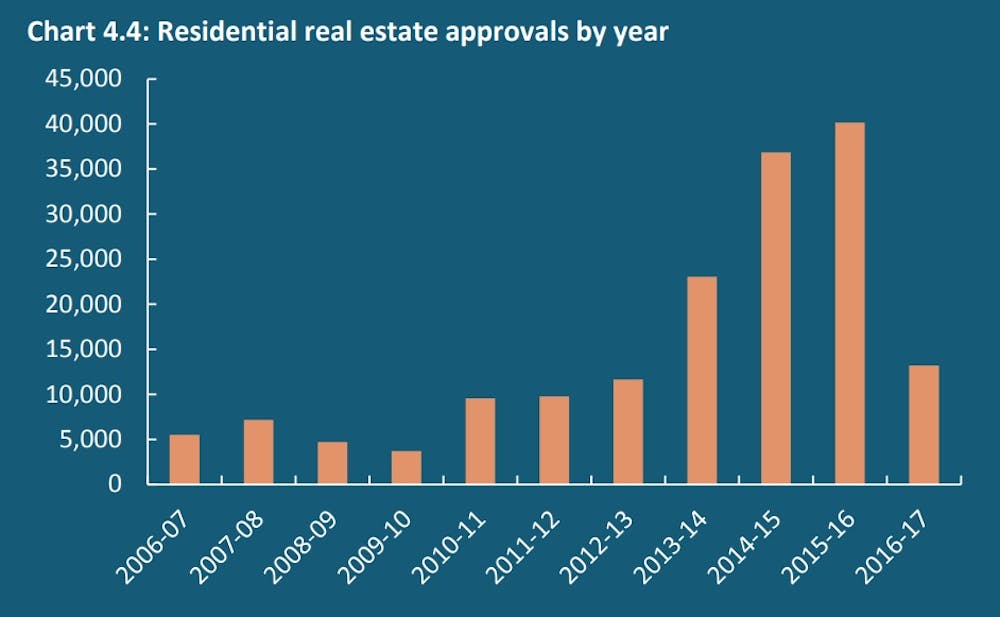
Credit availability apart, demand for property is falling, with investors still coy about buying, and some in fact looking to sell before prices fall further. And the latest data from the Foreign Investment Review Board shows that the number of foreign buyers have fallen.  Whereas in the year 2015-16 saw 40,149 approvals granted, totalling A$72.4 billion, the figure for the following year was just 13,198 approvals, totalling A$25.2 billion. On these numbers, the foreign property investment boom looks to be over. By the way, the data is still only reported at a high-level, and so we do not have much insight below the top line numbers from the FIRB. This needs to be addressed.

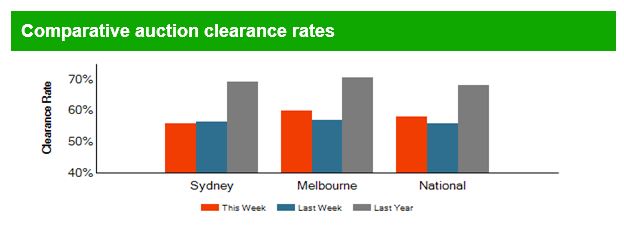
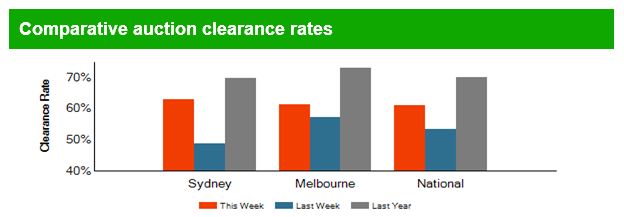
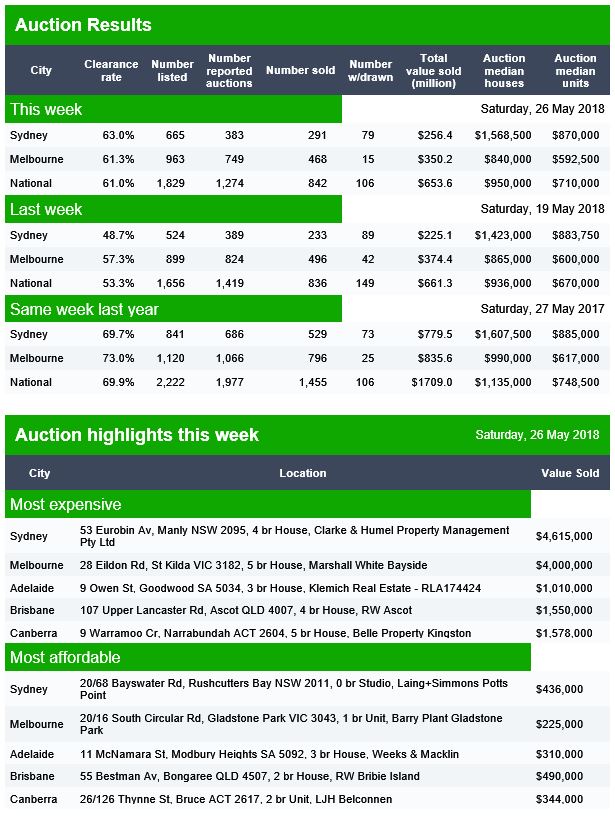
All this is reflected in the weaker auction clearance results. CoreLogic reported that the overall final auction clearance rate fell to 56.2 per cent last week; the third consecutive week where the weighted average has progressively declined. There were 2,297 homes taken to market which was only slightly higher than the week prior, when 56.8 per cent cleared. The last time clearance rates were tracking at a similar level was in early 2013 though then volumes were down thanks to the January lull.

In Melbourne the final clearance rate dropped below 60 per cent, with 59 per cent of auctions successful down on the 62 per cent the previous week. In Sydney, both auction volumes and the final clearance rate increased last week, with 814 auctions held returning a final auction clearance rate of 56.1 per cent, which was higher than the 54 per cent over the previous week. Adelaide, Canberra and Perth all saw a week-on-week improvement in clearance rates, while Brisbane and Tasmania’s clearance rate fell. Across the non-capital city regions, the highest clearance rate was recorded across the Hunter region, with 72.4 per cent of 54 auctions successful.

CoreLogic is tracking 2,121 capital city auctions this week, down slightly on last week’s 2,297, with weekly volumes remaining relatively steady over past month while the weighted average clearance rate has continued to weaken.  Over the same period one year ago, there was a considerably higher 2,578 auctions held.

So, have no doubt, prices have further to fall – Gravity is winning, in markets where on a fundamental basis property is still over valued by up to 40%.

The lift in the minimum wage by 3.5% for more than 2 million Australian which was announced this week will lift wages to $719.20 a week a rise of an extra $24.30 for a 38-hour week, from July 1. Trade Unions wanted an increase of $50 a week, arguing it would help Australians grappling with the rising cost of living. The increase may add up to 0.5 per cent to the Wage Price Index, which has been bumping along at, or near, historic lows of 2 per cent growth annualised for almost three years. But as 80 per cent or so workers not on a minimum wage, we are not sure this will have any visible impact on home price moves.

The Big Banks had a further terrible week, as the ACCC confirming that criminal cartel charges are expected to be laid by the Commonwealth Director of Public Prosecutions against ANZ, Deutsche Bank and Citigroup, as its alleged the joint lead managers took up approximately 25.5 million shares of and ANZ share placement in 2015. This represented approximately 0.91% of total shares on issue at that time. This is a criminal case, rather than civil, and carries potentially much higher fines – at 10% of turnover as well as imprisonment. ANZ share price was down significantly, despite still been the darling among the big 4 for many analysts!

The ACCC also warned more cartel cases are in the works.

Separately, CBA said that an investigation was initiated after a concern raised about internal CBA emails being inadvertently sent to email addresses using the cba.com domain prior to April 2017 when the bank acquired ownership of the cba.com domain.  CBA’s email domain is cba.com.au. CBA acting Group Executive Retail Banking Services Angus Sullivan said: “We want our customers to know that we are committed to being more transparent about data security and privacy matters.  “Our investigation confirmed that no customer data has been compromised as a result of this issue. We acknowledge however that customers want to be informed about data security and privacy issues and we have begun contacting affected customers.” CBA’s chare price was down to a five year low, in reaction to the battery of bad news in recent times, as well as weaker home lending trends.

And at the Royal Commission more poor bank behaviour was revealed in the handling of small business customers, thanks to errors and more deliberate intent.  As we discussed in our post The Problem with Small Business Lending, banks make a risk assessment of a business from the perspective of loss of a loan as a prudent banker, not the overall business performance. The commission is not recommending that any additional statutory obligations should be imposed for small business lending. But the banks, and ASIC have issues to answer, as outlined in the closing statements. I felt ASIC’s approach to regulation was shown up.

The royal commission also announced the new focus for the hearings that will commence on Monday, 25 June in Brisbane and end on Friday, 6 July in Darwin. Misconduct in regional financial services is one of the key issues that first ignited calls for a royal commission by advocates like Nationals Senator John Williams.

Turning to the broader financial market scene, the volatility index – the VIX,  is still sitting around 13, somewhat elevated compared with a few months ago, but well off its highs.  But markets were rocked by the return of tariff tantrums and geopolitical uncertainty in the Eurozone before shifting to US domestic issues as a bullish jobs report helped steady risk appetite. The unemployment rate fell again, though wages remained pretty flat. Private payrolls grew by 223,000 for the May, a sharp uptick from the 163,000 in April, which beat economists’ forecast of 189,000. That provided the impetus for U.S. stock to recoup some of their losses which followed fears that a global trade war beckons. U.S. tariffs on steel and aluminium imports from Canada, Mexico and European Union were triggered, drawing retaliatory measures from all three of the United States’ allies. U.S. markets were also disturbed by Italian political turmoil, which has since abated after Giuseppe Conte was sworn in as Italy’s new Prime Minister. The S&P 500 closed roughly flat for the week.

Crude oil prices adding to their 5% loss last week, with a 3% slump this week following an expansion in U.S. oil output and uncertainty on whether OPEC and its allies would ease limits on production. As the OPEC meeting slated for June 22 draws closer, traders remained wary of the oil-cartel easing production limits despite a Reuters report mid-week, citing a Gulf source, OPEC and its allies would stick to production curbs, which have helped slash the glut in global supplies. Fears that limits on the production-cut agreement could be eased overshadowed a weekly Energy Information Administration report showing U.S. crude supplies unexpectedly fell by 3.6 million barrels in the week ended May 25. Crude futures settled 1.8% lower on Friday as data showed U.S. oil rigs increased, pointing to signs of growing domestic output.

The US dollar scraped its third-straight weekly win after a strong jobs report Friday helped the greenback recover some of its early-week losses, paving the way for the Federal Reserve to hike rates in June and helping the greenback steady against its rivals. The greenback suffered heavy losses on Wednesday after uncertainties in Italy, but the last-ditch talks by Italy’s Five-Star Movement and League were successful as Giuseppe Conte was sworn in as Italy’s new Prime Minister on Friday. The dollar rose 0.24% to 94.18 against a basket of major currencies on Friday.

Gold prices were unable to add to their gains from last week, posting a weekly loss as the prospect of the further Fed rate hikes in the wake of the upbeat jobs report reduced demand. Analysts warned, however, that a single jobs report, albeit solid, was not enough to warrant a faster pace of rate hikes.  “Average hourly earnings at 2.7% year-on-year is within the range it has trended since mid-2016 and not enough to warrant a faster pace of rate hikes,” analysts at CIBC said in a note.

Upward pressure on funding will come from higher US rates if the Fed does move in June as expected. The US 10 Year Treasury rose 0.25% on Friday, and if off its recent lows, on the expectation of rate hikes ahead.

Bitcoin saw lower lows this week but its test of $7,000 was met with a wave of buying, stoking hopes of a recovery in the popular crypto. Some analysts said earlier this week that the $7,000 region triggered some “very key” support for bitcoin, opening the door to a possible recovery. Yet, traders continued to adopt a cautious approach, appearing unwilling to make a meaningful return to the crypto space as data showed the crypto total market cap remained stagnant compared to last week. The total crypto market cap was roughly unchanged from a week ago at $329 billion. Over the past seven days, Bitcoin fell 0.09% on the Bitfinex exchange, Ethereum fell 2.69%, while Ripple XRP rose 0.79% on the Poloniex exchange.

So overall, we think the home price data will continue to deteriorate further against a backcloth of international financial uncertainly.  In his opening statement to the Senate Economics Legislation Committee, Wayne Byres, APRA Chairman said that Australians can be reassured that the finance industry is financially sound, and that the financial system is stable. So that’s OK then!

Before I sign off, I wanted to highlight our planned live question and answer session which is scheduled for next Tuesday, at 8 PM Sydney Local Time. This will be streamed via YouTube, and I plan to take questions live via the built in YouTube Chat facility, as well as answer questions which I have yet to address in my posts from earlier conversations. The session will be posted as a normal post afterwards, so you can choose to send questions through over the next few days, join me live on Tuesday at 8 pm, or watch the session afterwards. I hope to see you there and remember to mark your diary. I have put it up as a scheduled event on YouTube.

Auction Results 02 June 2018; Gravity ON

Domain has released their latest preliminary auction clearance results for today.  Momentum appears to be easing further, and the number of withdrawn properties is on the rise. More evidence of why home prices are falling.

In Sydney, of the 670 listed, there were 336 reported auctions, 91 withdrawn, and a preliminary clearance rate of 56%, already lower than last week’s final measure of 56.5%.

In Melbourne, 942 were listed, 740 auctions reported and 463 sold, at 60%, compared with 57% last week’s final rate. The result will fall lower.

Brisbane listed 72 properties. reported 38 auctions and just 19 sold, at a clearance rate of 48%. Adelaide listed 69, reported 34 and sold 21 at 54% – 5 were withdrawn.  Canberra listed 63, reported 53, sold 34 and 4 were withdrawn, giving a Domain clearance rate of 60%.

In this video we discuss how the results are collated and whether they can be trusted.


Australia’s foreign real estate investment boom looks to be over

From The Conversation.

Australia’s Foreign Investment Review Board (FIRB) reported this week that foreign residential real estate approvals dropped significantly in the 2016-17 period.

Whereas 2015-16 saw 40,149 approvals granted, totalling A$72.4 billion, the figure for the following year was just 13,198 approvals, totalling A$25.2 billion. On these numbers, the foreign property investment boom looks to be over.

This is bad news for the property and financial industries, who are already feeling the pressure of weak household income growth, tighter lending restrictions on local borrowers, and a slowing in housing market activity in key Australian cities.

FIRB suggests that declining demand from China is a factor in the overall decline in overseas approvals. Chinese demand may have been weakened by a range of factors, including the new FIRB application fees, Chinese overseas direct investment capital controls, and the changing global economy.

But if the cycle is moving from boom towards bust, we have learned several things along the way.

Lesson 1: We still need more data

In 2014 the House of Representatives Standing Committee on Economics undertook an inquiry into foreign investment in residential real estate. It acknowledged the growing public disquiet about the level of this foreign investment, adding that:

…there is no accurate or timely data that tracks foreign investment in residential real estate. No one really knows how much foreign investment there is in residential real estate, nor where that investment comes from.

Four years on, FIRB is still flagging the limitations of data collection and analysis. Without fine-grained data, it’s hard to forecast how much, if at all, the injection of foreign capital can push up local house prices.

The latest figures come with a caveat. The approvals data represent potential investment, rather than actual investment. There are key differences between the two. Potential investors might, for example, seek approval for multiple properties while only intending to buy one of them.

We need the government to collect more extensive and detailed data on individual foreign real estate investment, and make it publicly available. This needs to cover more than approvals data at the city level, but data on investment levels in neighbourhoods or even individual housing developments.

Lesson 2: People on the property ladder are less hostile to foreign buyers

Data from Sydney reveals widespread concern about foreign investment. Almost 56% of Sydneysiders believed foreign investors should not be allowed to buy residential real estate in Sydney. Only 17% of respondents in our study thought the government’s regulation of foreign housing investment was effective.

Just over half of Sydneysiders say they would not want Chinese investors buying properties in their suburb. And 78% thought foreign investment was driving up housing prices in greater Sydney.

Yet those who have real estate investments were more likely to support foreign investment than those who don’t. This suggests that Sydneysiders with equity in the housing market, such as homeowners or investors, might view foreign buyers pushing up housing values as positive. And they might fear that the new decline in foreign investment might depress their assets.

Lesson 3: Housing is built with specific buyers in mind

When Chinese real estate investment started to rise significantly in 2013-14, property developers scrambled to model this new emerging market. The real estate media rushed to map out where Chinese investors were keenest to buy, and how best to design and market property developments to this new foreign client base.

In early 2012, Larry Schlesinger quoted the demographer Bernard Salt as saying:

The growing numbers of Chinese and Indian migrants in Australia means property investors need to consider the cultural sensitivity of the residential property they purchase to ensure they maximise the resell value.

Between 2013 and 2017, property developers, both local and foreign, regularly contacted me to ask if I had any up-to-date research on foreign investors’ consumer preferences and market forecasts. I did not. But there was no shortage of advice out there, covering everything from feng shui-informed housing design to the key needs of foreign university students.

Some global real estate agents suggested to their clients that they could buy an Australian home to accommodate their child while they were studying at an Australian university, and then use the capital gain from the property sale to pay back the tuition fees.

Many property developers were formulating medium- to long-term development pipelines that included the foreign capital and consumer preferences of foreign investors. It is unclear, now, whether much of this housing stock will ever be built. If it is, will it suit the changing future needs of our cities, or address our ongoing housing affordability problems?

In other words, what sorts of properties will be left as the legacy of the recent foreign real estate investment mania?

Lesson 4: Racialised housing debates are simplistic and harmful

We need to take care not to conflate domestic Chinese-Australian buyers with international Chinese investors. Much of the media coverage of the new report features stereotyped images of Asian families buying an Australian home. But given the foreign investment rules and logistics involved, these pictures are far more likely to depict Chinese-Australians than foreigners.

Understanding the long-term migration and education plans of the investors is important too. Different investor groups will interact with the city in different ways, and their impact on society can be vastly different too. For example, super-rich absentee investors will have a different impact on neighbourhood life compared with that of middle-class migrants or international students.

If the federal government wants to court foreign investment, then better education about the possible risks and benefits of individual foreign real estate investment is needed. Our research suggests that the government’s pro-foreign investment stance must be accompanied with strategies to protect intercultural community relations in Australia.

Lesson 5: The boom-bubble-bust cycle goes on

In 1982, Maurice Daly wrote in his classic book Sydney Boom, Sydney Bust that the:

…fluctuation in property prices recorded for Sydney have been caused by the forces linking the city to the Australian economy and to the remainder of the world.

Daly charted the influx of foreign people and capital into Sydney between 1850 until 1981, as wealth was channelled through the financial services sector and into urban real estate. Along the way, he observed that one “group to attract the abuse of the general population were the Chinese”.

Domestic and foreign real estate investment have long been connected to the financial services industries, and the built environment is central to creating and storing surplus capital. Australian cities continue to be heavily influenced by global money today.

A key lesson is that domestic and foreign housing booms, bubbles and busts are thus better understood as cycles within our housing and financial system, rather than as a set of short-term ruptures to this system.

We need to think about the collective impacts of domestic and foreign real estate investment over the long-term in our cities if we are serious about addressing housing inequality.

Author: Dallas Rogers, Program Director, Master of Urbanism. School of Architecture, Design and Planning, University of Sydney

Auction Clearance Momentum Eases Further

The preliminary data from CoreLogic, which will correct lower, reports a rate of 59.7% was recorded across Australia’s capital cities, which is below from 60.3% the previous week. Slightly more properties were up for auction than the previous week  at 2,287.

But so far only  1,772 reported back and of that 1,058 cleared while 714 failed to sell. More than 500 are outstanding, and that could take the final rate down towards the 56.8% last week.

Clearance rates for units continued to outperform those for houses, coming in at 64.9% and 57.6%.

Melbourne, Australia’s busiest auction market, drove the national decline last week where a preliminary clearance rate of 60.9% was recorded across 1,132 auctions held, falling from a preliminary reading of 64.2% in the prior week when 1,033 properties went under the hammer. They are predicting a final rate below 60%, compared with 62% last week.

Sydney may be a little higher this week, at 62.7% compared with improvement on the 60.8% last week on a preliminary basis.  But again, there are a large number of auctions yet to report. Sydney last week achieved a final rate of 54%.

Across the smaller capitals, preliminary clearance rates improved in Adelaide and Perth but fell in Brisbane and Canberra.

Auction Results 26 May 2018

Domain have released their latest preliminary clearance results for today. More evidence of slowing trends.

In Sydney  665 properties were listed and 291 were sold. 79 were withdrawn.  Last week Sydney ended up with a 48.7% clearance result, so it will be interesting to see if there is any final recover today, as more results come in.

Melbourne listed 963 properties and 468 sold with 15 withdrawn. Last weeks final result was 57.3%.

Brisbane listed 82 and sold 22, with 3 withdrawn, Adelaide listed 57 and sold 25, with 6 withdrawn and Canberra listed 62 and sold 36 with 3 withdrawn.

For more on how the results are collated, and how believable they are see, see our video “Auction Results Under The Microscope”.


The Crunch Is Nearer Now – The Property Imperative Weekly 26 May 2018

Welcome to our latest summary of finance and property news to the 26th May 2018 with a distinctively Australian flavour.

Watch the video, listen to the podcast, or read the transcript.

I had a number of interesting discussions with people who follow our analysis of the property market this past week.  One in particular which stood out was from Melbourne who told me that in February 2017 he decided to sell his home, and got an indication it would sell conservatively for 1.3 million dollars. After a delay he took it to auction in August 2017 and struggled to see $1.25 million. But that property is now worth $1.15m a $150,000 drop from Feb 2017 to May 2018 or 11%.  He also told me that back in 2017 he could have got a mortgage of $980,000, but now, on the same financial basis he can only access $670,000 today.

That in a nutshell is what is happening in the major markets, with people’s mortgage borrowing power being curtailed, and as a result home prices are falling. And they will fall further.

We had a bevy of analysts revising down their forecasts for future home prices this week. It is tricky to determine the extent of any fall ahead, and most predictions will of course be wrong. But the more significant factor in play is the significant change in the atmospherics around the housing sector. More are going negative. And when the largest lender in Australia signals they expect a fall, even a mild one, this is significant.

Recently Morgan Stanley said it is predicting property prices could fall by about 8% in 2018, and lending by more than a third. Morgan Stanley suggests there’ll not only be further price weakness in the months ahead, but also the likelihood of renewed softening in building approvals. It says these two factors will likely weigh on household consumption and building activity, seeing Australian economic growth decelerate, rather than accelerate, this year.

CBA has also gone negative on housing, now forecasting a mild correction. Gareth Aird, senior economist at CBA says that Australian residential property prices have fallen over the past six months. Additional declines appear likely over the next 1½ years due to a further tightening in lending standards, a continued lift in supply, potentially higher mortgage rates and more rational price expectations from would-be buyers. But he says a hard landing, however, looks unlikely and “is not our central scenario”.

We discussed this analysis in more detail in our recent release “Another Bank Goes Negative On Housing” which is still available.  And remember CBA is the largest mortgage lender for owner occupied loans. Until recently they were bullish on prices, so this reversal is significant.

And UBS, who called the top of the market earlier than most, says macroprudential tightening ‘phase 3’, is a ‘game changer’ that will materially further tighten credit ahead, with higher living expense assumptions & debt to-income limits cutting borrowing capacity ~30-40%. Indeed, they says, housing is already weakening more quickly than our bearish view, with home loans dropping by ~10% since Aug-17, before the full Royal Commission impact. We have shifted our base case towards our ‘credit tightening scenario’, where home loans falls ~20%, credit growth drops to ~flat, prices fall persistently, & the RBA holds for longer. This coupled with record housing supply in coming years & a slump in foreign buyers sees us downgrade our house price outlook to fall 5%+ over the next year; below our prior 0 to -3% y/y. They conclude that housing activity will correct & prices to fall; still with downside risk: We still expect commencements, activity & prices to have an ongoing ‘downturn’ until at least 2019 – with downside risk from a ‘credit crunch’ scenario amid regulatory tightening & the Royal Commission. But housing should not ‘crash’ without (unexpected) RBA rate hikes or higher unemployment. So that’s ok then…

CoreLogic added some colour to the question of home prices by assessing home price growth across each decile, which confirms that values have fallen fastest at the premium end of the market. The broad trend findings in the CoreLogic May Decile Report showed that values have been falling on an annual basis across the 10th decile (the premium end of the market), while all other valuation deciles enjoyed positive (albeit restrained) growth over the twelve months to April 2018. National dwelling values were 0.2% higher over the 12 months to April 2018 – the slowest annual rate of growth since values fell -0.3% over the 12 months to October 2012.  Analysing deeper at a decile level, it was only the most expensive 10% of properties that recorded a fall in values over the year (-4.3%) and all other sectors recorded annual growth greater than 0.2%.

In Sydney the most expensive decile, have fallen 7.2% over the past year, while in Melbourne the same decile fell just 2.4%. In contract the cheapest 10% of houses rose 1.5% in Sydney, and 11.9% in Melbourne over the past year. This is thanks partly to first home buyer stamp duty concessions implemented by both state governments from 1 July 2017. But be warned, if Perth is any guide, the top of the market falls first, but other sectors soon follow. This is one reason why we continue to hold the view prices will drop further than many analysts are predicting.

The credit tightening is real, borrowing power is being reduced, and investors are voting with their feet. We continue to see investors planning to exit the market before prices fall further.  If you want further evidence, look no further than the latest auction clearance rates. CoreLogic says the combined capital city auction market continues to soften throughout 2018; while volumes have remained relatively steady over each of the last 3 weeks the weighted average clearance rate has continued to decline. Last week, the combined capitals returned a final auction clearance rate at a record year-to-date low of 56.8 per cent, the last time clearance rates were tracking at a similar level was in early 2013.  With 2,100 homes taken to auction last week almost half of these failed to sell, over the same period last year the clearance rate was a much higher 73.1 per cent across 2,824 auctions.

In Melbourne, the final auction clearance rate increased last week across a slightly lower volume of auctions, with 62 per cent of the 1,033 auctions reported as selling, up on the previous week when the final clearance rate across the city dropped below 60 per cent (59.8 per cent- 1,099 auctions).

Sydney’s final auction clearance rate fell to 54 per cent last week, the lowest recorded since late 2017, with 672 homes taken to auction which was lower than the week prior when 787 auctions were held and a higher 57.5 per cent cleared.

Across the remaining auction markets, Adelaide was the only capital city to see a rise in clearance rate last week with volumes also increasing across the city.

This trend is set to continue with CoreLogic currently tracking 2,164 auctions, increasing slightly on last week’s final figures which saw 2,100 auctions held. Sydney is expected to see the most notable difference in volumes this week; increasing by 15 per cent on last week with a total of 775 homes scheduled for auction.  Australia’s other largest auction market Melbourne is set to host 1,064 auctions this week, remaining somewhat consistent on the 1,033 auctions held last week at final results.  In any case there are doubts about the auction stats, as we discussed in “Auction Results Under the Microscope”.

Across the smaller auction markets, Tasmania is the only other auction market to see a rise in week-on-week volumes, with Adelaide and Perth down more than 30 per cent on last week, while Brisbane and Canberra’s volumes are down to a lesser degree.

When compared to activity last year, both volumes and clearance rates were tracking considerably higher, with 2,885 auctions held on this same week one year ago when the success rate of auctions were tracking consistently above the 70 per cent mark throughout the first half of 2017; a much different trend to what we are currently seeing.

All the indicators are for more falls.

As the property market rotates, and demand slackens, property developers with a stock of newly built, or under construction dwellings – mostly high-rise apartments are trying tactics from deep discounting, cash bribes, or 100% mortgages to persuade people to buy. Remember there are around 200,000 units coming on stream over the next year or two and demand is falling.  So we were interested to see (thanks to a tip off from our community) a WA initiative which was recently announced by Apartments WA – “Backed by the foundations of the BGC Group – Western Australia’s largest residential home builder and largest private company, we make your buying journey a seamless process from finding you the right apartment, assisting with obtaining finance, right through to settlement and key handover”.

They have coined the “Preposit”.  In essence a buyer gets to live in a property, whilst saving for a deposit, and when that deposit is accumulated, they can complete a purchase. It’s a way to get currently vacant apartments occupied by people who ultimately may buy.   They call it ” the Afterpay© of the real estate industry”.   The weekly payments, would cover the equivalent of rent and saving for a deposit. Finance is provided by Perth based Harrisdale Pty Ltd trading as The Loan Company. They hold a financial service licence. There are few details on the Preposit site, and we have no idea of the financial arrangements below the surface. So we suspect any prospective buyer should ask some hard questions about the overall risks and real effective costs. Remember that they are not an Authorised Depository Institution, so any money “saved” with them for a deposit could be at risk. I put in a call to the company, who said they would call back to discuss “Preposit”, but they never did!

I have been following the latest rounds of hearings at the Royal Commission into Misconduct in the Banking, Superannuation and Financial Services Industry, which is exploring lending for small businesses.

It’s been quite dramatic, with stories of business owners with impossible dreams, walking into commercial ventures which had a limited chance of success. The banks on the stand appear to have made procedural mistakes, and when things go wrong often went for the jugular to cover their losses. This included relying on guarantees even if it meant selling the guarantors property, and the case studies included sad stories of people losing their homes.  This included a disabled pensioner, blind and riddled with medical problems; her daughter, a budding small business operator. Or an ambitious woman trying her hand at running a pie shop with the hope of retiring early.

But the way the story is presented is only half the story. Yes, the banks failed in their duties on occasions, but on the other hand many businesses need finance if they are to start, and banks want to lend. What is really going wrong?

My theory is there small businesses are not get access to the advice they need to make a balanced assessment as to the viability of their operation.  By default, they assume if the bank provides funding then the business must be viable – but this is not necessarily so. The bank is only concerned with protecting their loan, and ensuring they can cover the risk of loss – this is not the same as considering the business in the round. We discussed this analysis in more detail in our recent release “The Problem With Small Business Lending”.   And remember about 53 per cent of the nation’s 2.2 million small to medium businesses need finance to continue trading.

The Australian Financial Review reported on our recent research on the Bank of Mum and Dad funding business start-ups. More than 33,000 business owners are estimated to have seed finance – or ongoing financial support – from loans that are secured with their parents’ home, analysis of home ownership and borrowing numbers reveals. The average cash injection is about $56,000 but loans typically range from few hundred dollars to more than $1 million, the analysis reveals. But while the number of parents providing direct cash support to their siblings’ business is increasing there has been a big fall in the number willing to put their houses on the line. That’s because of increased understanding that a lender could foreclose if there a default, which means parents’ best intentions risk the threat of homelessness by prodigal sons or daughters, according to financial advisers. said the number of parents guaranteeing a loan with their homes has fallen by about 8 per cent in the past year. This is because of the greater focus on financial advice and a better understanding of the risks involved with a guarantee, plus thanks to the strong rises in property there is more equity in a property.

Next, we look at the latest from the US where the adjustments to the Dodd-Frank Act (DFA) – sound familiar?) are expected to be signed into law next week. The changes ease the capital and regulatory requirements for smaller institutions and custody banks by raising the systemic threshold to $250 billion from $50 billion for enhanced prudential standards (EPS), reduce stress testing requirements and modify applicability of proprietary trading rules (the Volcker Rule). The legislation reduces regulations for U.S. small to mid-size banks in particular, while only providing de-minimis regulatory relief to the largest U.S. banks. The change to the systemic threshold reduces the number of banks subject to heightened regulatory oversight to 12 from 38. Regulators will still have discretion to apply EPS to banks with $100 billion-$250 billion in assets. Banks above $250 billion in assets would not see much benefit from the legislation.

Fitch Ratings says stress testing has provided discipline for banks and is an important risk governance practice that is considered in its rating analysis. The elimination or meaningful reduction of stress testing would likely have negative ratings implications. And this at a time when debt is very high.

Moody’s says the return of a 3% 10-year Treasury yield is making itself known in the housing industry. Markets have already priced in a loss of housing activity to the highest mortgage yields since 2011. They conclude that just as it is overly presumptuous to predict the nearness of a 4% 10-year Treasury yield, it is premature to declare an impending top for the benchmark Treasury yield. Thus far in 2018, the 11% drop by the PHLX index of housing-sector share prices differs drastically from the accompanying 3% rise by the market value of U.S. common stock. In addition, the CDS spreads of housing-related issuers show a median increase of 78 bp for 2018-to-date, which is greater than the overall market’s increase of roughly 23 bp. Finally, 2018-to-date’s -1.97% return from high-yield bonds is worse than the -0.13% return from the U.S.’ overall high-yield bond market. Despite the lowest unemployment rate since 2000, the sum of new and existing home sales dipped by 0.7% year-over-year during January-April 2018. All this shows the impact on the housing sector as rates rise.

The highest effective 30-year mortgage yield in seven years has depressed applications for mortgage refinancings. For the week-ended May 18, the MBA’s effective 30-year mortgage yield reached 5.01% for its highest reading since the 5.04% of April 15, 2011. The effective 30-year mortgage yield’s latest fourweek average of 4.95% was up by 63 bp from the 4.32% of a year earlier. March 2018’s 7% yearly drop by the NAR’s index of home affordability showed that the growth of after tax income was not rapid enough to overcome the combination of higher home prices and costlier mortgage yields. March incurred the 17th consecutive yearly decline by the home affordability index. The moving three-month average of home affordability now trails its current cycle high of the span-ended January 2013 by 23%.

And according to the  latest from The St.Louis Fed On The Economy Blog, individuals who were in financial distress five years ago were about twice as likely to be in financial distress today when compared with an average individual. They argued that financial distress is not only quite widespread but is also very persistent. They show that the share of households with past financial distress increased from approximately 6.6 percent in 1998 to 12.2 percent in 2016. They conclude that households that have encountered an episode of financial distress in the past are 1.5 times more likely to delay payment today, compared to average households.

Why is this US data relevant to us? Well first, the debt levels in the US are significantly lower than here as home prices relative to income are lower there. We have more households in financial difficulty as a result. Second, the higher rates are likely to impact local funding costs here, which will put pressure on local banks funding costs, and third, higher rates will further tighten credit availability, and as in the US, this is likely to impact the construction sector – so expect to see more unnatural acts to try to attract buyers into a falling market – to which I reply, caveat emptor – let the buyer beware!

Finally, the latest data from S&P Global Ratings using their Mortgage Performance Index (SPIN) to March 2018 shows a rise in arrears – they increased to 1.18% in March from 1.16% in February and there was a significant hike in 90+ defaults.  WA and NT continue their upward trends, both above 2% and rising.  Home loan delinquencies fell in New South Wales, Queensland, South Australia, and the Australian Capital Territory in March. Of note, mortgage arrears in South Australia appear to have turned a corner; the state’s March 2018 arrears of 1.35% are well down from a peak of 1.81% in January 2017. This reflects a general improvement in economic conditions in South Australia, in line with national trends. Western Australia remained the state with the nation’s highest arrears, sitting at 2.37% in March.

But S&P says say arrears more than 90 days past due made up around 60% of total arrears in March 2018, up from 34% a decade earlier. This shift partly reflects a change in the reporting of arrears for loans in hardship that came in response to regulatory guidelines. Even accounting for this, however, there has been a persistent rise in this arrears category, though the level of arrears overall remains low.  And I recall Wayne Byers recent comment to the effect that at these low interest rates, defaults should be lower!

The pressure on households is set to continue. The crunch is getting nearer.

More Weird Initiatives To Drag Buyers Into The Property Market

As the property market rotates, and demand slackens, property developers with a stock of newly built, or under construction dwellings – mostly high-rise apartments are trying tactics from deep discounting, cash bribes, or 100% mortgages to persuade people to buy. Remember there are around 200,000 units coming on stream over the next year or two and demand is falling.

Building approvals are also slowing. There is an air of desperation.

So we were interested to see (thanks to a tip off from our community) a WA initiative which was recently announced by Apartments WA – “Backed by the foundations of the BGC Group – Western Australia’s largest residential home builder and largest private company, we make your buying journey a seamless process from finding you the right apartment, assisting with obtaining finance, right through to settlement and key handover”.

They have “invented” the “Preposit”.  In essence a buyer gets to live in a property, whilst saving for a deposit, and when that deposit is accumulated, they can complete a purchase. Its a way to get currently vacant apartments occupied by people who ultimately may buy.   They call it ” the Afterpay© of the real estate industry”.   The weekly payments, would cover the equivalent of rent and saving for a deposit.

Finance is provided by Perth based Harrisdale Pty Ltd trading as The Loan Company. They hold a financial service licence.

There are few details on the Preposit site, and we have no idea of the financial arrangements below the surface. So we suspect any prospective  buyer should ask some hard questions about the overall risks and real effective costs. Remember that they are not an Authorised Depository Institution, so any money “saved” with them for a deposit could be at risk.

I put in a call to the company, who said they would call back to discuss “Preposit”, but they never did!

This is what the sponsored content on rewa says:

A new way of buying has hit the property market, allowing prospective buyers to live in their home, whilst saving for their deposit.

In a unique first for WA, “Preposit” is the Afterpay© of the real estate industry and means you can ‘move in today and pay for it tomorrow’.

The Apartments WA exclusive product allows you to move into an apartment immediately, then begin to make weekly payments that are stored away for you until you’ve saved your deposit.

Apartments WA Sales Manager Chad Toquero said Preposit addresses one of the biggest stumbling blocks in home ownership – the deposit.

“Preposit appeals to all buyers who can afford the loan repayments but are finding it difficult to save for a deposit – there is nothing else like this in the market and Preposit appeals to those looking to buy and those who are currently renting but want to own their own home in the future.”

Apartments WA have also partnered with Loan Co to offer their clients access to a wide range of lenders. As each person’s financial circumstance, and thus borrowing capacity is different, Loan Co will work with each individual to pre-qualify them for a loan upfront. Preposit just allows the buyer to live in the property, while saving for their deposit.

This new way of purchasing is flexible, negotiable and customised to suit the needs of every individual.

Mr Toquero believes Preposit has the potential to make home-ownership become a reality for more people.

“We want Preposit to make home ownership easier for those who want to take advantage of the property market now and their only hurdle is saving for a deposit,” he said.

“The only catch is you have to be able to afford your mortgage repayments and pre-qualify for a loan.

“As long as you can afford the repayments but don’t quite have the deposit right now, we can get you into one of our apartments.”

Here is their FAQ.

What is Preposit ?​
Preposit is a unique initiative created by Apartments WA to help people save for their deposit, whilst being able to live in the apartment at the same time.

So how does it work?
We help you find your dream apartment and then introduce you to our finance experts to work out how much you can afford to borrow. The difference between the purchase price and what you can borrow is the deposit you’ll need to save. Once you receive finance pre-approval to purchase the apartment, we give you the keys to move in and you start saving for your deposit in weekly payments. We then store away these payments away until your deposit amount is achieved, which we give back to you as your deposit toward purchasing the apartment.

Is there a minimum amount required to qualify for Preposit?
No. Everyone’s individual situation is different, and we’ll work through finding the best solution for you.

What properties is Preposit applied to?
We have a range of apartments in selected areas across Perth currently available.

Is this a Government Scheme or Shared Equity?
No. Apartments WA understands that saving for a deposit is one of the biggest hurdles when looking to buy a property. And we want to help.

Sounds too good. What’s the catch?
There’s no catch. You agree to purchase the property upfront, and then get to move in whilst you save for your deposit. Once you’ve reach your deposit amount, you settle on the apartment and then its yours.

How do i know if i eligible?
Complete our enquiry form and we’ll give you a call.

2 in 5 Aussies do not understand LMI

More than two in five prospective home buyers have admitted to not understanding Lenders Mortgage Insurance (LMI), according to new data.

This chimes with our research on the topic of LMI from our own surveys. In fact the confusion varies by type of buyer, and who is protected.  First Time Buyers are a particular concern. See our previous post “Is Lenders Mortgage Insurance a Good Thing“.

Mortgage Choice and CoreData’s new Evolving Great Australian Dream 2018 whitepaper found 42.1% of respondents said they were not sure what LMI was, yet a third (32%) said they would need to pay it in order to get into the property market.

“Our data found that a majority of home buyers are in the dark when it comes to Lenders Mortgage Insurance and what it entails,” Mortgage Choice Chief Executive Officer Susan Mitchell said.

“According to our survey, only 32.1% of prospective buyers accurately stated that LMI is designed to protect the lender if a borrower can’t repay their mortgage.

“Another 8.2% of respondents thought LMI protected the borrower, while 17.6% believed it protected both the borrower and the lender,” said Ms Mitchell.

The research found that 44.8% of women did not to understand what LMI was, compared to 37.35% of men.

Buyers aged 29 and under (47.3%) were the most likely not to know what LMI was, while the 50 to 59 age group (40.75) had the highest proportion of buyers who knew what LMI was.

On a state by state comparison, Victoria (46%) had the highest proportion of buyers who did not know what LMI was, followed by Queensland (40%) and Western Australia (39.6%). NSW buyers topped the states when it came to correctly defining LMI at 34.6%.

Ms Mitchell said it was concerning that such a large proportion of Australians had either a limited or no understanding of LMI and that mortgage brokers can play an educational role for borrowers.

“For many first home buyers, LMI is likely to be a cost they have to pay to get into the property market, particularly if they do not have a deposit that is at least 20% of the purchase price,” she said.

“The reality is that saving for a home deposit is a major challenge for first home buyers and this has been the result of strong price growth over the last few years.

“According to CoreLogic, the median dwelling value in Australia is $554,605, and for a first home buyer to avoid LMI, they would need to save $110,921 for a 20% deposit and they would still need to have additional funds to cover costs such as legal fees and stamp duty.

“That is quite large sum to save and it only increases if a buyer is looking in cities such as Sydney and Melbourne.

“While LMI on the surface seems like a fee to be avoided, it does have the benefit of helping a buyer purchase a home with a smaller deposit, thereby allowing them to get onto the property ladder sooner rather than later.

“A buyer can choose to delay their property purchase to save a sufficient deposit, but the reality is property prices have risen consistently and the longer they delay, the more likely they are to miss an opportunity.

“Ultimately, in the long run, LMI is a fairly small expense in the overall cost of purchasing a home.”

Ms Mitchell said first home buyers could avoid LMI altogether if they were able to receive some sort of financial boost or a have a guarantor on their loan.

“First home buyers can avoid LMI by having a parent or family member go guarantor on their home loan, which then allows them to purchase without a 20% deposit” she said.

“In the case of the latter, it is important to note that lenders may require that any monetary gift must be held in an account for at least three months before home loan approval. Also, a lender may still require a borrower to demonstrate that they have 5% genuine savings.”

Ms Mitchell said it was important for first home buyers to have a good understanding of the purchase process.

“If you’re a first home buyer, you should speak to a mortgage broker who can guide you through the process of purchasing a property, from getting the best rate as part of the home loan application, through to settlement.

“They can explain the various options and costs involved, including LMI, thereby ensuring that you can confidently achieve your goal of home ownership,” concluded Ms Mitchell.

“As property prices continue to relax there has never been a better time for first home buyers to purchase. Therefore, it’s essential they have a clear understanding of LMI so that they know how it affects their ability to get into the market.”

Auction Volumes Continue To Fall Across The Combined Capital Cities

More evidence of a slowing property market as auction clearance rates continue to fall.

From CoreLogic.

There were 2,089 homes taken to auction across the combined capital cities this week, returning a preliminary auction clearance rate of 60.3 per cent. Last week, 2,279 auctions were held and the final clearance rate dropped to 58.2 per cent, the lowest clearance rate seen since December 2015 so it will be interesting to see what happens as the final result are collected early next week. Over the same week last year, auction volumes were higher with 2,824 homes going under the hammer across the combined capital cities, returning a clearance rate of 73.1 per cent.

2018-05-21--auctionstatistics

In Melbourne, Australia’s largest auction market, a preliminary auction clearance rate of 64.2 per cent was recorded across 1,028 auctions this week, up from 59.8 per cent across 1,099 auctions last week, the lowest clearance rate the city has seen since Easter 2014. One year ago, the clearance rate was a stronger 77.9 per cent across 1,326 auctions.

Auction clearance rate

There were 669 auctions held in Sydney this week returning a preliminary auction clearance rate of 60.8 per cent, compared to 57.5 per cent across 787 last week, and 74.0 per cent across 1,075 auctions one year ago.

Across the smaller auction markets, preliminary results show that Canberra was the best performing in terms of clearance rate with a 66.2 per cent success rate across 79 auctions.