The rapid growth of the giant online accommodation-sharing platform, aka Airbnb, is creating serious concerns about equity and the impacts on our cities and neighbourhoods as we know them. Our recent research shows that the patterns of Airbnb listings in Australia’s biggest cities are highly uneven. The findings suggest impacts on rental housing are likely to be biggest in high-end areas that appeal to tourists. Low-income areas are less affected.
Our research – focusing on the Sydney and Melbourne metropolitan regions – looked into three important questions:
Where are the listings?
Who is hosting Airbnb?
What are the impacts on rental markets?
Where are Airbnb listings located?
The maps below show the distribution of Airbnb offerings in the Sydney and Melbourne metropolitan regions. These also show the composition of listings: entire (house/apartment, shown in red) versus partial (room only or shared room, in blue).
In Sydney (shown above), Airbnb offerings are mostly concentrated in popular tourist areas. Interestingly, partial house/apartment listings spread out more to the middle and fringe suburbs. Entire house/apartment listings are more concentrated around the city centre and eastern beaches.
We see a similar pattern in Melbourne (above). Airbnb listings aggregate around the city centre but also extend beyond the inner core to the residential outskirts. However, the composition of listings (entire versus partial) has less effect on their distribution in Melbourne than in Sydney.
Interestingly, the cities have very different Airbnb market sizes. The populations of the two regions are almost on a par, but Sydney has almost twice as many Airbnb listings as Melbourne. The difference in entire house/apartment listings is even greater.
SEIFA is a suite of four summary measures created from Census information. For each index, every geographic area is given a SEIFA score. This shows how that area compares with others in Australia.
All areas are ordered from lowest to highest SEIFA score. This ranges from the lowest 10% of areas, which are given a score of 1, up to the highest 10%, with a score of 10.
Our analysis showed the sheer scale of inequity of Airbnb listings distribution. Over 95% of all entire house/apartment listings and about 87% of partial house/apartment listings (room only or shared room) in Sydney are in the socio-economically best-off areas (SEIFA deciles 9 and 10).
Airbnb offerings in Melbourne follow a similar pattern. Over 80% of entire house/apartment listings and about 70% of partial house/apartment listings are found in the best-off areas.
Our data analysis establishes that Airbnb hosting mainly occurs in the most affluent pockets of both regions.
What are the impacts on the rental market?
We also looked at the ratio of the size of the rental market to the size of Airbnb listings with specific attention to the socioeconomic status (using SEIFA) of each local government area in Melbourne and Sydney. This produced a few interesting observations, which help illustrate how local long term rental housing stock is, or could be, lost by conversion to Airbnb short-term listings.
In Sydney, there are no low socio-economic areas (SEIFA scores of 1-5) with high numbers of rental dwellings that also have high numbers of entire house/apartment Airbnb listings. This means that, to date, Airbnb is not displacing the rental stock in the most disadvantaged pockets of the Sydney metropolitan region.
Nevertheless, in a small number of high socio-economic areas (SEIFA scores of 8-10), the Airbnb market (entire listing only) represents sizeable proportions of the rental market. For the beachside location of Waverley (decile 10), for example, the number of Airbnb entire listings is almost equivalent to a quarter of the number of rental dwellings. Similarly, in Manly and Pittwater (both 10), Airbnb entire home listings are about 20% of the rental market size.
In other words, considering the very small size of Airbnb in comparison to the total rental market in Sydney – less than 3.5% – the overall impact can be expected to be minimal. However, the impact is not equally distributed, either geographically or socio-economically.
Indeed, the impact of Airbnb on the rental market is of concern in a limited number of areas in Sydney, mainly strategic tourism locations such as beachside areas. Although these are at the highest end of socio-economic spectrum, there is a danger of some local residents being pushed out of the most sought-after areas so tourists can move in.
The pattern in Melbourne is slightly different or, in a sense, less intense than in Sydney. Again, the general trend of high Airbnb listings in high socio-economic areas is observed.
The Melbourne CBD, which has a SEIFA score of 8, has the most Airbnb entire house/apartment listings. These listings represent the highest proportion, about 8%, when compared to the size of the local rental market. The pressure on the rental market, then, is far less than what we see in popular Airbnb spots in Sydney, such as Waverley, Manly and Pittwater.
We also see in Melbourne that popular rental areas in lower SEIFA areas have low numbers of entire house/apartment Airbnb listings. This confirms the Sydney hypothesis that the loss of rental supply is not yet a major concern at the lower end of the rental market.
The patterns we observed suggest that the pressure Airbnb puts on the rental market – at least at this point of time – is limited to a small number of high-end areas, mainly locations that are attractive to tourists. This represents a concern in terms of rental supply in these areas, where some local residents in the long-term rental market might be losing out to the short-term tourism market.
Authors: Tooran Alizadeh, Senior Lecturer, Director of Urban Design, University of Sydney; Reza Farid, Adjunct Research Fellow, Griffith University; Somwrita Sarkar, Senior Lecturer in Design and Computation, University of Sydney
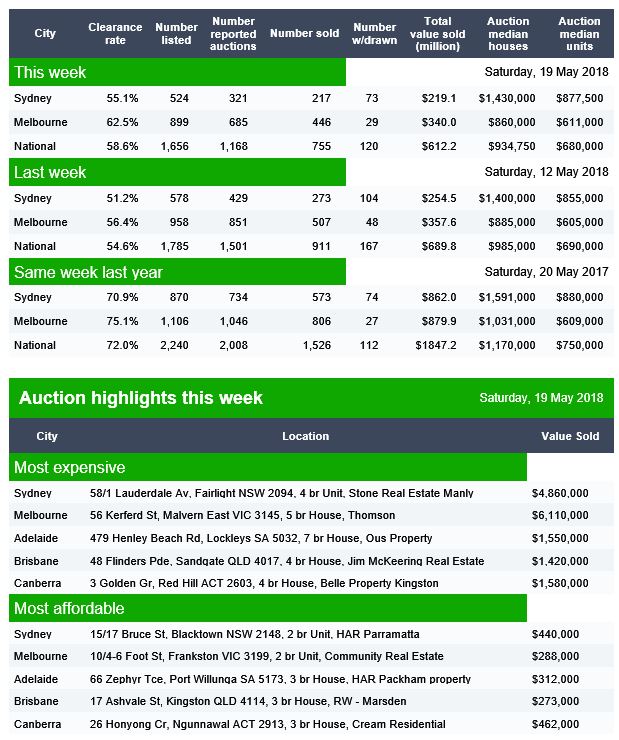
Domain have released their preliminary auction clearance results and the weakness in the stats continues, both in terms of volumes and clearance rates. The final results will settle lower still. They are way down on last years.
There is also a larger drop between those listed for auction compared with those auctioned.
In Canberra, 58 were listed for auction and 36 sold. In Brisbane 107 were listed and 27 sold. In Adelaide 68 were listed and 29 sold.
You can watch our recent video blog where we discussed how the auction results are calculated and how reliable they may be, especially in a falling market.
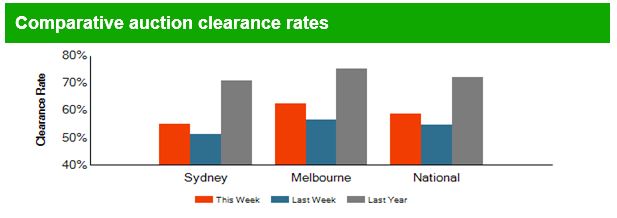
Preliminary clearance rate weakens and auction volumes drop slightly across the combined capital cities.
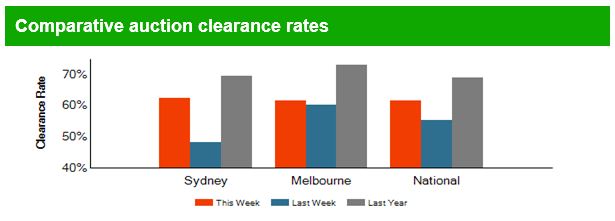
There were 2,245 homes taken to auction across the combined capital cities this week, returning a preliminary auction clearance rate of 61.0 per cent, while last week, 2,311 auctions were held and the final clearance rate came in at 62.1 per cent. Over the same week last year, auction volumes were higher with 2,409 homes going under the hammer across the combined capital cities, and the clearance rate was a stronger 72.8 per cent.
If we look at results by property type, units outperformed the house market this week with 63.6 per cent of units selling at auction, while 59.8 per cent of houses sold across the combined capital cities.
In Melbourne, Australia’s largest auction market, a preliminary auction clearance rate of 61.2 per cent was recorded across 1,090 auctions this week, down from 63.7 per cent across 1,144 auctions last week. One year ago, the clearance rate was a stronger 75.0 per cent across 1,098 auctions. There were 767 auctions held in Sydney this week returning a preliminary auction clearance rate of 62.5 per cent, compared to 63.1 per cent across 797 last week, and 74.5 per cent across 960 auctions one year ago.
Once clearance rates are finalised early next week, its highly likely they will be revised lower, with both Sydney and Melbourne clearance rates potentially falling below the 60% mark.
Across the smaller auction markets, preliminary results show that Canberra was the best performing in terms of clearance rate with a 77.1 per cent success rate across 80 auctions.
Back in January I published a video entitled “To Buy, Or Not To Buy, That IS indeed the Question” which addressed the question of should I buy property now. It’s still available, and as current as ever it was.
But as we have seen prices slide further, which we showed in yesterday’s edition of the Property Imperative Weekly, one question is coming up more often from our community. That is, should I SELL now – ever more relevant as the future direction looks to be south, so reducing the paper value of property – to which the answer is, it depends.
Once again, a necessary caveat, as this is not financial advice, and your mileage may vary, but I think there are some principles which are worth exploring in general terms. So today, I am going to touch on some of the most important ones.
Owner Occupiers
First, I think the answer will vary by the type of property holder. For those owning a property to live in – for owner occupation – to provide shelter – you may have reason to switch properties perhaps because of moving with a job, or to trade up, to get more space, or to trade down, to get a smaller place, and possibly release capital on the way through.
Now here is an important point. One property is worth one property. You only need one property. Just one. So at any point in the market cycle, if you sell to buy, you are crystallising value in your existing property at the point in time you sell, and commit to buy a new place at the same time. So in a relative sense, if you buy and sell, you transact at a specific point in time. And even if values have fallen, so you have lost some paper equity in your existing place, the property you are buying may well have fallen also, though of course different markets may be moving at different rates, and even different types of property may have moved differentially. But generally, selling and buying can actually be done at any time, provided of course there are properties to buy, and prospective purchasers for your existing place. It might be much harder if the market itself has frozen.
But often you will have a mortgage on your existing place and you are selling, and often that needs to be repaid from the proceeds of sale. That’s fine provided you have sufficient equity, even if the capital value has fallen, but could be a real barrier if the value of the mortgage is higher than the property – so called negative equity. And if fact, it is negative equity which can become the barrier to switching property, as we have seen in other markets where prices fell 30-40%.
But if you have sufficient equity to repay the mortgage, and need a mortgage on a new place, you may have to apply afresh. Of course bear in mind that lending standards may have become tighter so you might not be able to get the same value of loan as previously, and this is also true if your circumstances have changed. So it is worth checking this out early. Generally, mortgage borrowing power has been reduced in recent months.
Or perhaps your mortgage is portable.
In fact, loan portability is often a standard on all home loans – but you may have to ask, and sometimes it’s not obvious. This means if you choose to move houses, you can take your loan with you. So in this case you are to transfer your existing loan to another property without having to go through the process of refinancing. But you will need to ask the lender for the “hidden” rules and parameters, and generally, you may have to pay slightly more for the flexibility of portability. And overseas, some lenders even allowed negative equity to be transferred to facilitate a move.
Sometimes people will try to sell, rent, and wait for the market to fall further, before buying. That might work, but you are essentially taking a bet on the market. You might be right; you could be wrong. As I have said before predicting future home price movements is a mugs game, and most predictions will be wrong. There are too many moving parts.
Finally, if you are trading down, – seeking a smaller place, to release capital, you may want to bring the transaction forward, because larger value homes are falling faster than smaller ones. On the other hand, those seeking to trade up, and get a larger place might do better to wait, as prices may fall so you can get a larger place for less money. But again, you are betting on the market, and you may be wrong.
A Forced Sale
One other scenario to consider is being forced to sell, perhaps because the mortgage repayments are just too demanding. In fact, given we have nearly 1 million households in mortgage stress, and flat incomes, the number facing difficulty is increasing. Now the banks have an obligation to assist in cases of hardship, and they may be able to restructure the loan, or even waive interest payments for a bit in this case. They are also loathe to push people out of their homes – as a forced sale – as this risks significant negative publicity and also may reduce the value of the property in the process. But they often “encourage” stressed households to sell, and we are seeing a rise among these households. So households come to accept there is no way out but to sell. In this situation it is probably better to sell sooner rather than later, as in our experience in the current environment the cure rate is very low, unless the problem is created by a short term health or employment hiatus. But often it’s a matter of the income just consistently not covering expenditure. So selling in these circumstances can be a positive circuit breaker, and in a falling market, selling sooner may yield higher net returns.
Property Investors
So now to property investors. The equation here is quite different. We are already seeing some sassy property investors selling, to realise the capital gains they have achieved, remember value is not true value until it is crystallised. In some cases, this is to reinvest in the smaller markets of Adelaide and Hobart, where capital gains are for the moment still being seen. Though that may change.
For some investors, its simply that the net rental yield – the flow of rental payments, less the costs of managing and maintaining the property are now net negative, so unless you can see rapid capital growth and offset losses again other income it might be time to sell.
Our latest data shows that about half of all rentals are underwater on a cash flow basis, especially in Victoria and NSW. Some other states, such as Queensland are doing somewhat better, mainly because values have not lifted so high, and so mortgages relative to rental streams are smaller. So it pays to shop around – as the outcomes are remarkably different. The fact is for many, the true “all in” returns, even allowing for capital appreciation, are remarkably low – and many investors do not do the calculations to know the real picture. They would get a nasty surprise. And if capital values continue to fall, yields will drop also. And in addition, rental rates are more connected with incomes, than home prices, so changes in capital value, or even mortgage rates, do not get reflected in the majority of rents. This is a pre-tax picture by the way.
Talking of tax, the current generous tax incentives are used by many, especially more affluent households, to reduce their effective taxable income. This is why the Government can say that the majority of negatively geared investors do not have large incomes – it is stating the obvious, as net taxable income is after all the tax manipulation!
Some investors are choosing to sell, to lock in significant capital gains (and again the tax breaks are generous), fearing that values may fall ahead. Others are being forced to sell to meet or avoid higher mortgage repayments as they move from interest only loans to principal and interest loans. This is especially true for those holding multiple properties – and many have more than 5, and some more than 20 leveraged investment properties. So they sell to cover the costs on the remaining ones.
And once again it is important to remember mortgage underwriting standards are much tighter now – including a 20% haircut on rental streams to cover times when the property is vacant, a repayment assessment made on a pre-tax not post-tax position and on a principal and interest basis – even if applying for an interest only loan. And significantly more questions, and evidence required to get a loan if you are materially dependent on the rental streams to cover the costs of the mortgage.
Remember too that Labor would freeze negative gearing for most new transactions (but they do not plan retrospective changes, so existing negatively geared loans would be more attractive to retain) and they may still have tax breaks for newly built property. There are no details as yet.
Generally, in a downturn, its investors who flee the market first – as data from Ireland and the UK both show. This is why investor mortgages are more risky – the Bank of England says four times more likely to default.
So my perspective would be investors might seriously want to review their portfolios, and estimate the true net returns. Given many will have paper profits on capital gains over recent years, there is a strong logic to sell.
But again, it does depend on your view of future home price movements. As you know, we hold the view that prices are correlated with loan availability, and as because loans are now harder to come by, property prices have further to fall. They are at least 30% overvalued compared with their true economic value.
In Summary
So the bottom line is this. Property Investors have more of a burning platform to take action and consider selling before prices fall further. Down Traders also would be in a similar position as they are also seeking to lock in capital growth. On the other hand, Up Traders may prefer to wait – assuming prices will fall further. And those owners occupied sellers, who need to move, should probably, do so in any case, with the caveat that the mortgages available now will be smaller than they were a few months again.
Again, to reiterate, this is not financial advice, and it’s just my – hopefully informed – opinion, but you would need to get more specific guidance based on your individual circumstances.
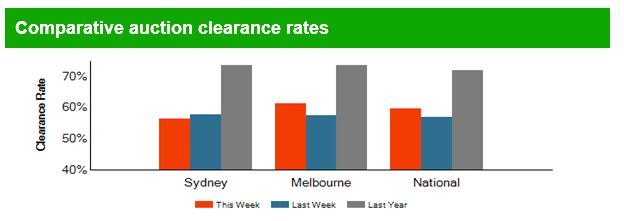
Sydney looks lower again, both in terms of volume and preliminary clearance, Melbourne is lower on volume, and the final rate will settle lower. So the lower momentum compared with last year continues
Brisbane listed 122 auctions, but sold 45 with 9 withdrawn, Adelaide listed 72 and sold 27, with 2 withdrawn, and Canberra listed 55 with 37 sold and 1 withdrawn.
Watch our video on whether these numbers are likely to be an accurate reflection.
The combined capital cities saw fewer homes taken to auction this week, with a total of 2,280 held, down on last week when 2,577 were held.
The lower volumes saw an improved preliminary clearance rate over the week, returning a 63.5 per cent success rate, increasing on the week prior’s final clearance rate which was the lowest weighted average result seen over the year-to-date with 60.3 per cent of properties selling.
Once again the combined unit market outperformed houses, returning a 67.7 per cent clearance rate, while a lower 61.7 per cent of houses sold. A similar trend is evident in CoreLogic indices which show the unit market outperforming house values as housing demand slides towards the more affordable segments of the market.
Although the preliminary clearance rate has shown a positive rise over the week, the trend in auction clearance rates, based on the more complete final results, clearly shows a downwards trend in clearance rates. Auction markets remain more buoyant than December last year, when Sydney clearance rates reached a low point of 52 percent, however the weaker auction results suggest housing market conditions are likely to remain relatively soft.
Looking at results over the corresponding year-to-date period last year, the capital city auction market was performing quite differently, with an average of 10 per cent more homes selling over the same period last year, while weekly volumes continue to show similar trends.
Melbourne returned a preliminary clearance rate of 63.5 per cent this week across 1,137 auctions, down on last week when 1,334 auctions took place and a higher 63.9 per cent cleared. In Sydney, 774 auctions were held this week with 66.9 per cent selling, increasing on last week when only 55.8 per cent of auctions were successful across a slightly higher 829 auctions.
Results were varied across the smaller auction markets this week, with Canberra and Perth recording a slight increase in week-on-week volumes, while the remaining markets saw fewer auctions take place. In terms of clearance rates, Canberra was the strongest performer this week with 74.2 per cent of homes selling, while only 18.2 per cent of Perth homes sold.
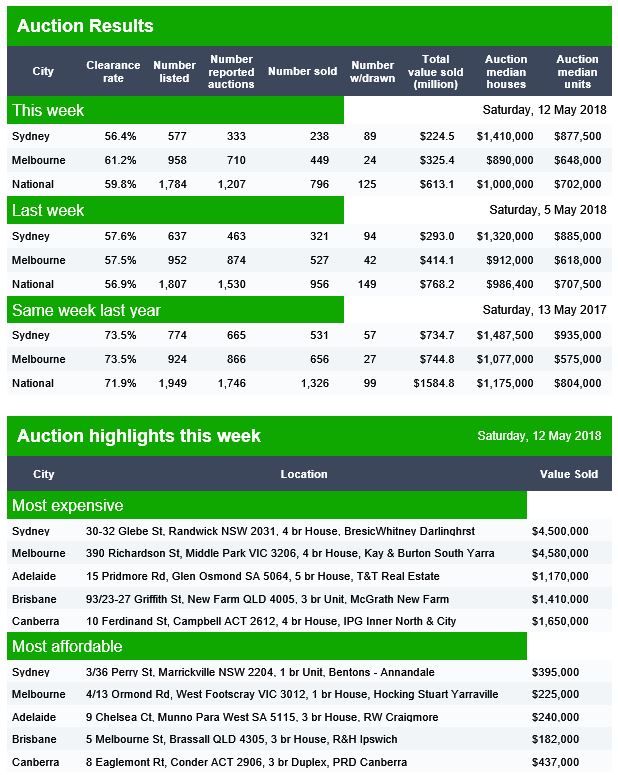
The trends are continuing with Sydney leading the way lower, with a final rate last week of 48.1% and a lower number of reported auctions this week. Melbourne is a little stronger, but still at a lower clearance rate than last year. We continue to see lower numbers of actual auctions, compared with listed, as more are withdrawn prior to auction, or rescheduled.
Brisbane had 72 listed for auctions, and 18 were sold, Adelaide had 69 listed and 26 sold, and Canberra had 75 listed and 49 sold. So in the smaller markets, Canberra looks the strongest. The final results will settle later in the week.
You can watch our video on how the results are collated and whether they are meaningful.
Auction results continue to track lower than last year and more are getting withdrawn before they go to auction. Comparing the listed with sold totals, we get below 50%!
We are also seeing more evidence of property with the “offers invited” sticker rather than the “for auction” label. You can watch our video on the reliability of auction results.
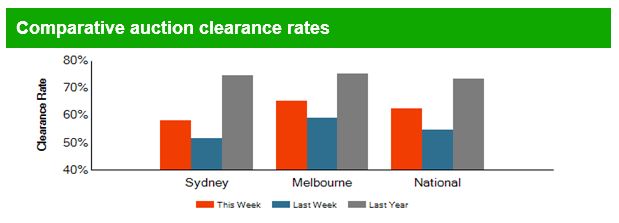
The number of homes taken to auction across the combined capital cities rose this week, with a total of 2,539 held, the higher volumes returned a preliminary clearance rate of 62.5 per cent. Last week, there were 1,799 capital city auctions returning a 62.2 per cent final clearance rate.The combined capital city auction market has seen a relatively steady performance over the year-to-date, with the average weighted clearance rate continuing to track around the low-to-mid 60 per cent range for most of this year despite the level of activity over each week.
Combined results split by property type show the smaller segment of the auction market continued to outperform for another week, with 64.4 per cent of units selling at auction while 61.6 per cent of houses sold this week.
Melbourne saw an increase in clearance rates and volumes this week, with a total of 1,326 Melbourne homes taken to auction returning a preliminary clearance rate of 65.5 per cent, up on the 63.6 per cent last week when a lower 914 auctions were held.
As volumes rose across Sydney this week, the preliminary clearance rate dropped below 60 per cent for the first time since the first week of February earlier this year. The preliminary clearance rate showed 59.8 per cent of the 805 auctions held reportedly sold, however this will likely revise lower as results are finalised early in the week.
Each of the smaller auction markets recorded an increase in auction activity this week; the higher activity saw week-on-week clearance rates strengthen across Adelaide, Brisbane and Perth, while Canberra and Tasmania returned lower clearance rates.
The latest preliminary results from Domain are in. The volumes are a little higher this week, and the clearance rates may be higher also, though they will settle lower. The rates though remain below those from last year.
Brisbane reported that of the 103 listed properties, 50 went to auction and 29 sold. Adelaide reported that of the 91 listed for auction, 48 were auctioned and 34 sold. Canberra reported 82 listed for auction, 62 reported auctions and 40 sold.
Welcome to the Property Imperative Weekly to 28th April 2018.
In this weeks digest of finance and property news we review the implications from the Royal Commission, the latest on the Westpac loans issue, APAC mortgage lending and rising near-prime non-bank lending.
In this week’s summary of the latest finance and property news we start with the Royal Commission into Financial Services Misconduct. The latest hearings wrapped up on Friday, with a litany of company breaches and illegal behaviour being called out. During the close, it was suggested AMP might face criminal prosecution for misleading the corporate regulator. But large institutions, adviser groups, individual advisers, industry associations and regulators all failed to meet our expectations.
I’ve been amazed by the coverage these issues are getting in the media, and also the surprise being expressed, as many industry insiders have been aware of significant issues for years. But then companies, with the deep pockets and aggressive stances have largely contained them. I think the live streaming of the sessions has had a significant impact, and it shows the power and reach of digital. But now, exposed is the lopsided focus on shareholder returns at all costs, even if customers are disadvantaged and laws are broken. In a way this mirrors the behaviour we saw in the previous rounds on lending practice.
It’s also worth noting that Kelly O’Dwer, who tried to defend the un-defendable on ABC Insiders last Sunday arguing that the Government did not drag their feet with regards to the calling of the Commission, did an about face saying on Friday “”With the benefit of hindsight we should have called it earlier, and I am sorry we didn’t, and I regret not saying this when asked earlier this week”. But Ms O’Dwyer maintains the Government was not sitting on its hands in the months leading up to the commission, and has again argued it used the time to strengthen regulations in the sector and beef up penalties for misconduct.
But we need to understand that corporates across many sectors actually exhibit the same type of behaviour, whether it is Telstra, who was fined by the ACCC this week for charging customers for online services, without their consent, Ford for failing to fix faulty vehicles, electricity providers allowing customers to sit on high priced non discounted tariffs, or Pay Day loan providers now offering instant loans via ATM type machines. I could go on.
We need to stand back, and think about the corporate values which all these examples signify –profit at all cost, and a willingness to sail close to the wind, without a moral compass, or worse just break the law. Whilst we can expect tighter laws, and higher fines ahead, I think we need a new philosophy of the company, which puts the interests of customers first, rather than last. Now that is a major challenge, but also an opportunity; and I am waiting for real leaders to take a stand. They are now all on notice.
Turning to the latest home prices and auctions, Corelogic reported that last week, the final auction clearance rate increased to 62.2 per cent after the prior week’s lowest level seen over the year-to-date, of 61.7 per cent. They say that volumes are around the 1,800- 1,900 level, much lower than last year. And of course there are still questions about the accuracy of the data, in the light of the higher number of property’s withdrawn prior to auction, as we discussed in our recent post “Auction Results Under the Microscope”
They say that Melbourne and Sydney returned an equal 63.6 per cent auction clearance rate last week, both higher than the prior week. Looking at volume of auctions, Melbourne recorded a slightly higher volume week-on-week with 914 held, increasing on the 873 the previous week, while Sydney saw a fall in activity with 588 auctions held, down on the 795 auction held the week prior. The performance across the smaller auction markets were mixed last week, with clearances rates improving in Brisbane and Tasmania, while Adelaide, Canberra and Perth all saw a fall in the final clearance rate over the week. Of the non-capital city regions, Geelong recorded the highest clearance rate with 85.3 per cent of auctions clearing last week.
This week, the number of auctions scheduled to take place across the combined capital cities is expected to rise, with 2,342 currently being tracked by CoreLogic, increasing from the 1,799 auctions held last week. Both Melbourne and Sydney is expected to see an increase in activity this week, with 1,218 homes scheduled for auction across Melbourne, while Sydney is set to host 737 auctions, increasing on the 914 and 588 auctions held last week respectively.
I posted on the latest UBS report recently, “On Mortgage Underwriting Standards and Risks”. They continued their forensic dissection of the mortgage industry with the release of their analysis of data from Westpac, which the lender provided to the Royal Commission. This was representative data from the bank of 420 WBC mortgages analysed by PwC as part of APRA’s recent review. APRA Chairman Wayne Byres found WBC to be a “significant outlier”, with PwC finding 8 of the 10 mortgage ‘control objectives’ were “ineffective”.
UBS says for the first time information on borrower’s Total Debt-to-Income ratios (not Loan-to-Income) has been made available. They found WBC’s median Debt-to-Income at 5.4x, with 35% of the sample having Debt-to-Income ratios of >7x. Further 46% of the mortgage applications had an assessed Net Income Surplus of <$250 per week.
This data raises questions regarding the quality of WBC’s $400bn mortgage book (70% of its loans). While WBC has undertaken significant work to improve its mortgage underwriting standards over the last 12 months, we expect it and the other majors to further sharpen underwriting standards given the Royal Commission’s concerns with Responsible Lending. This could potentially lead to a sharp reduction in credit availability.
So I was amused by a piece in the AFR from Christopher Joye, who argued that there was nothing to see here. PwC found that 38 of the 420 loans failed APRA’s loan assessment standards and should not, on this test, have been originated. He argued that on Thursday Westpac disclosed that PwC used a limited data file on each borrower, and once Westpac applied its full data file 37 of the 38 loans were, in fact, appropriately approved. And the one loan that should not have passed its credit scoring system is “currently ahead on its repayments”. Also, Westpac highlighted that 90 of the 420 loans have already been fully repaid, which combined with its other evidence suggests that the bank’s loan portfolio remains of a high quality. Westpac’s chief financial officer Peter King hammered this point home, noting that “our mortgage delinquencies and losses remain low both relative to historical and industry standards”. That’s important because Westpac has aggressively raised its interest-only loan rates, which should have propagated higher defaults. And he says …Contrary to Tony Abbott’s suggestion the regulators should be sacked in response to the royal Commission, APRA has generally been doing an excellent job. The housing boom kicked- off in 2013 and APRA has been hounding banks on loan serviceability standards since late 2014, when it introduced a raft of rules and established a prudential mortgage lending guide.
Trouble is, we know that in a low interest rates environment most loans will survive, it’s when rates rise that things start to go wrong. And the issues around HEM and APRA (and remember ASIC has commenced proceedings against Westpac) suggests they have questions to answer. So I did not find Joye convincing. I do not think the regulator has done a great job!
As I said the other day, the results from the UBS work raises two questions. First how much tighter will credit availability now be ahead? We continue to expect an absolute fall in loan volumes, and this will translate to lower home prices.
Second, is this endemic to the industry, or is Westpac really an outlier? From our data we see similar patterns elsewhere, so that is why we continue to believe we have systemic issues.
Income is being overstated and expenses understated.
Customers have multiple loans across institutions and these are not always being detected, so their total debt burden is higher than the bank sees.
Combined these are significant and enduring risks. Chickens will come home to roost! Especially if rates rise. In fact, UBS has now put a sell recommendation on Westpac.
Now back to APRA, the banking regulator announced plans to remove the investor loan growth benchmark and replace it with more permanent measures to strengthen lending standards. This could be seen as an easing strategy to allow banks to lend more freely, but I do not think it is. In fact, it underscores the tighter lending standard now being imposed.
In summary, for the 10 per cent benchmark to no longer apply, Boards will be expected to confirm that: i) lending has been below the investor loan growth benchmark for at least the past 6 months; ii) lending policies meet APRA’s guidance on serviceability; and iii) lending practices will be strengthened where necessary.
As part of these measures, APRA also expects ADIs to develop internal portfolio limits on the proportion of new lending at very high debt-to-income levels, and policy limits on maximum debt-to-income levels for individual borrowers. This they say provides a simple backstop to complement the more complex and detailed serviceability calculation for individual borrowers, and takes into account the total borrowings of an applicant, rather than just the specific loan being applied for.
Remember the Bank of England imposed limits on high loan to income loans a couple of years ago to cool the market, so in a sense APRA is belatedly following suit, having argued previously that everything in the mortgage garden was rosy. What a change of tune!
Combined these underscore that credit growth will continue to slow, and there will be intense focus on credit underwriting. If you want arguments as to why home prices will continue to drift lower and perhaps fall faster, you need look no further.
And high home prices and debt is not just an Australian thing. Fitch Ratings issued an interesting note saying that banks in Asia-Pacific (APAC) will face heightened property risks over the medium term, given their relatively high exposure to the sector and the susceptibility of heavily indebted household sectors to a rise in interest rates or unemployment.
Residential property risks are highest for Australian and New Zealand banks, and may remain elevated in the short term as low interest rates and high house prices continue to drive mortgage growth, albeit it a slower rate. Residential property loans accounted for 43% of Australian bank assets in December 2017, up from 39% five years earlier, while in New Zealand the share rose to 46% from 43%. Australian and New Zealand households also have some of the region’s highest debt burdens.
Hong Kong banks’ property risks are increasing, with the territory being one of the few markets where property lending has accelerated over the past year, while intense competition continued to pressure margins. Mortgages account for a relatively low proportion of system assets, but a sharp housing market downturn could hurt sentiment and expose vulnerabilities, as rising prices have boosted private-sector wealth, banks’ reserves and collateral valuations. Banks’ rising exposure to mainland Chinese property is driving real-estate lending growth.
Korea’s high household debt would make its economy less resilient to shocks, including a housing market downturn. Household debt ratios are unlikely to decline over the medium term. However, household assets are also relatively high and banks’ property exposure is healthy overall, with low delinquencies and moderate LTV ratios. The same is also broadly true for Singapore, where we expect a more buoyant property market to support bank lending in 2018.
APAC regulators have actively tightened macro-prudential measures in an effort to strengthen banking-sector resilience to potential property risks. These measures have helped cool property markets in Singapore and Taiwan, while the tight stance has generally bolstered loss-absorption buffers and supported lending standards. Nevertheless, continued rapid lending and a further rise in risk appetite could increase the prospects of negative ratings action in the medium term, particularly in the absence of commensurate reinforcement to buffers.
Household leverage has started to decline in the emerging markets where it is highest – Malaysia and Thailand. We expect some fallout from over-supply in Malaysia, but risks to banks should be manageable as their exposure to the more vulnerable segments has remained small. Strong commercial real-estate lending growth by Thai banks in 2017 reflected an improving operating environment and followed sluggish growth in previous years, although there are still risks associated with consumer lending. Real-estate lending growth has also remained high in the Philippines.
Chinese banks shifted toward retail banking and mortgage lending in 2017, amid pressures in the corporate and financial sectors. However, increases in household leverage have been from a low base and have not reached the levels of most developed economies, suggesting that any near-term risks from China’s household debt burden remain moderate. Bigger risks would emerge if household lending was left unchecked over the medium term.
They conclude that rapid mortgage lending growth, incrementally higher risk-taking and relaxed mortgage pricing amid competitive pressures are likely to have created vulnerabilities that could be tested by a change in economic conditions. Rising interest rates are a potential trigger, despite saying that monetary tightening will be much slower in APAC than in the US.
Worth remembering this as the US 10-year bond has moved above 3%. Here is the latest chart. This is further evidence of the continued rise in rates in the USA, as the FED executes its plan to reverse QE and take rates higher. This follows through to higher mortgage rates in the US, as shown by this chart.
This will indeed have consequences as the capital markets rates will follow, putting more pressure on local banks, who still fund significant portions of their books from overseas. This will continue to put pressure on the BBSW, and is likely to translate into higher mortgage rates ahead.
Next, CBA subsidiary Bank West has announced that it is implementing changes to its broker commission payment model, including changes to trail and the adoption of CIF recommendations, effective from 1 July. The bank is the first lender to make major moves to change broker remuneration following the ASIC remuneration review, Combined Industry Forum package reforms and the ongoing commissions. Bankwest has said that it is bringing in the changes to “align itself with evolving industry practice and regulator expectations”. The changes, which will be effective on settlements from 1 July 2018, include: The reintroduction of Year 1 trail commission. The reduction of trail commissions in Year 3 to 0.15 per cent and from Year 5 and onwards to 0.20 per cent. The adoption of the Combined Industry Forum (CIF) recommendations on paying commissions on utilised funds and net of offset. There will be no changes to the upfront commission rate.
Commenting on the industry recommendations, Bankwest said: “Bankwest has been a very long-standing supporter of the broker industry, going back to the very start some four decades ago, and we remain committed to brokers as a channel of choice for customers. We support the current upfront and trail model as well as the improvements to the model outlined in the ASIC review and the Combined Industry Forum (CIF) recommendations. We understand the lack of Year 1 trail has been outstanding for some time and we are pleased to reintroduce this to bring us back in line with the market. Our contract stipulates that trail commissions represent payment for continuous customer maintenance and services, and we believe trail remains warranted for brokers to ensure ongoing support is provided to customers they refer to Bankwest.”
Our own view is the broker commissions are likely to be replaced by a fixed service fee, following the Royal Commission revelations. We also think mortgage brokers and financial advisers should be regulated under a common set of best interest rules. You can watch our separate post “We Need Common Rules for Mortgage Brokers and Financial Advisers”.
Finally, this week, Non-bank lender, Bluestone Mortgages, has announced its entry into the near prime mortgage space. The move includes rate cuts of up to 2.25 basis points across its entire product suite, at a time when “PAYG and credit impaired customers are affected by the tightening criteria of traditional lenders”. It comes off the back of extra funding through the acquisition of Cerberus Capital Management. The Crystal Blue portfolio is being seen as particularly ambitious, comprising of full and alt doc products geared to support established self-employed borrowers and PAYG borrowers with a clear credit history. Bluestone Mortgages said, “The recent acquisition of the Bluestone’s Asia-Pacific operations by Cerberus Capital Management has enabled a number of immediate opportunities to be realised, most notably the assessment of our full range of products and to ensure they fully address market demands. This comes at an opportune time as a growing volume of self-employed, PAYG and credit impaired customers are affected by the tightening criteria of traditional lenders. Unlike big banks, we don’t have credit scorecards, which means we’re able to assess every borrower based on their merits and individual circumstances. We’re not one-size-fits-all by any means, which is increasingly appreciated.
So this is all playing out as expected. As the majors throttle back on new mortgage lending under tighter controls, the non-bank sector continues to pick up the slack. This is a concern as the regulatory environment for these lenders is weaker, with both ASIC and APRA now involved, ASIC from a responsible lending perspective and APRA from new supervision on the non-bank sector, despite their failure in the core banking sector. So we expect to see significant non-prime non-bank lending growth, ahead, which will stoke the current massively high household debts even higher.