The IMF published their latest assessment of Australia’s economy. It is relatively positive, though calls out risks in the housing sector and once again suggests tax changes would assist. They are also critical of attempts to segregate the property market into local and foreign buyers. There is a whole separate document on housing and risks in the system.
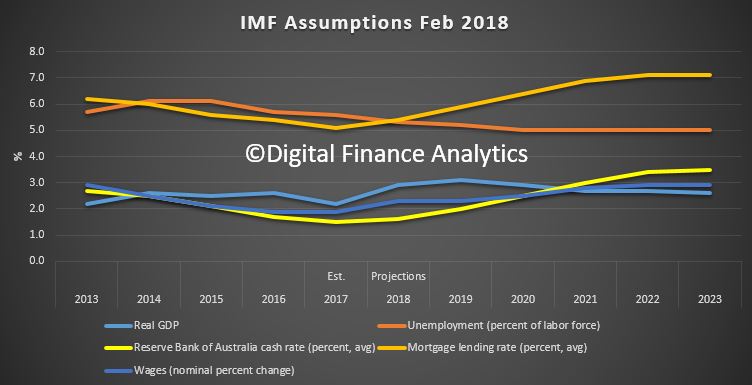
However, the underlying economic model assumptions are interesting. Most significant is the expected rise in average mortgage rates from 5.1% now, to 7.1% in 2021. That would cause some pain (and lift mortgage stress from ~920k to 1.25m households on our models).
They show unemployment drifting down to 5%, whilst there is a little improvement in GDP. The RBA cash rate rises to 3.25% in 2022/3. Overall wages growth drifts higher to 2.9% in 2023. House prices remain elevated, as does household debt, and debt to income rises, as interest rates climb.
On February 7, the Executive Board of the International Monetary Fund (IMF) concluded the 2017 Article IV consultation with Australia.
Australia has enjoyed a comparatively robust economic performance while adjusting to the end of the commodity price and mining investment booms of the 2000s. The recovery from these shocks has advanced further in 2017. Aggregate demand has been led by strong public investment growth amid a boost in infrastructure spending and private business investment has picked up, but private consumption growth has remained subdued. Employment growth has strengthened markedly over the year, although the economy is not yet back at full employment. Wage growth is weak and inflation is below its target range.
The macroeconomic policy stance has become more supportive with the infrastructure investment boost. The monetary policy stance is accommodative, with the current policy rate setting implying a real policy rate at zero relative to estimates of the real neutral long-term interest rate in the range of 1 to 2 percent. Infrastructure spending at the Commonwealth and State levels has increased by an average of 0.5 percent of GDP annually over the next 4 years relative to the last Article IV Consultation.
A housing boom has supported the Australian economy’s adjustment to the end of the boom, but has led to housing market imbalances and household vulnerabilities, which the authorities have addressed with a multipronged approach. The supply response to higher house prices has been strengthened, through increased spending on infrastructure, which helps increase the supply of accessible and developable land, and through zoning and planning reforms. The Australian Prudential Regulation Authority (APRA) used prudential policies to lower housing-related risks to household balance sheets and the banking system. Market entry for first-time home buyers has been facilitated through tax relief, grants, and support for accumulating deposits for down payments within the Superannuation framework.
Australian banks have further strengthened their resilience to negative housing and other shocks in 2017 and improved their funding profile. The capital adequacy ratio of the Australian banking system rose by another 0.8 percentage points through 2017, reaching 14.6 percent by end-September, with 10.6 percent in the form of Common Equity Tier 1 (CET-1) capital. The liquidity coverage ratio was comfortably above minimum requirements. By end-September 2017, many banks already had Net Stable Funding Ratios (NSFR) above the 100 percent required from January 1, 2018.
Recent structural policy efforts have focused on addressing infrastructure gaps, strengthening competition, and fostering research and development (R&D). Reforms to the competition law at the Commonwealth level, as proposed in the 2015 Competition Policy Review (the “Harper Review”), were enacted in November 2017, which should encourage more competitive behavior in the economy. The National Innovation and Science Agenda (NISA) seeks to strengthen R&D. In 2014, the government committed to reduce the gender gap in labor force participation by 25 percent by 2025 as part of the Brisbane Commitments in the G-20 process. The company tax rate for small companies with a turnover of up to A$50 million has been lowered from 30 to 27½ percent over the next 5 years.
Executive Board Assessment
Executive Directors commended Australia’s robust economic performance during the rebalancing of the economy in the wake of the mining investment boom of the 2000s. This has been helped by a resilient economy and strong policy frameworks. Directors noted that a more robust global outlook, employment growth, and infrastructure investment should help accelerate economic expansion. Nonetheless, while near‑term risks to growth have become more balanced, negative external risks could interact with domestic financial vulnerabilities and pose a threat to the recovery. Directors urged the authorities to maintain prudent policies, continue to address financial vulnerabilities, and raise long‑term productivity.
Directors agreed that continued macroeconomic policy support is needed to secure employment and inflation objectives. With inflation below target and the economy not yet back at full employment, the monetary policy stance should remain accommodative until stronger domestic demand growth and inflation are evident. Directors welcomed the more supportive fiscal policy stance due to infrastructure investment. They concurred that the Commonwealth budget repair strategy remains appropriately anchored by medium‑term budget balance targets. They noted that in the case of a more gradual recovery, Australia has the fiscal space to absorb this risk and protect spending for macrostructural reforms.
Directors considered appropriate the multipronged policy for addressing housing imbalances and vulnerabilities, including a tightening of prudential policies, a strengthening of housing supply, and targeted demand policies. They took note of the staff’s assessment that some policies are classified as capital flow management measures (CFMs) under the Fund’s Institutional View (IV), although their use has been consistent with the IV in most cases—in particular, that the CFMs have not substituted for warranted macroeconomic policies. In this context, many Directors raised the issue of intent and emphasized the need to consider the substance of the measures, and to assess their effectiveness in reducing financial stability risks. Some Directors, nonetheless, encouraged the authorities to consider measures that do not distinguish between residents and non‑residents where feasible (for example, on vacant properties). Directors noted that the housing policy package could be complemented by tax reform, including a gradual shift to more efficient property taxation through the introduction of a systematic land tax regime. Strong supply‑side policies will remain critical.
Directors highlighted that increased infrastructure investment should provide a welcome lift to productivity and longer‑term growth. Sustained structural policy efforts in promoting innovation and competition, upgrading labor force skills and reducing gender gaps, and advancing broad tax reform would complement these positive effects.
Michele Bullock, Assistant Governor (Financial System), spoke at the Responsible Lending and Borrowing Summit. She downplayed the financial stress in the system and concluded “while there are some pockets of financial stress, the overall level of stress among mortgaged households remains relatively low”. Of course, our own mortgage stress surveys tells a different story, but it does depend on definitions.
Four quick points to note. First, the RBA continues to rely on HILDA data from 2016, despite the changes in living costs, mortgage rates and flat incomes since then. They refer to more timely private datasets, but do not use them, because of “different methodologies.”
Next, she acknowledge that high household debt will be a consideration in terms of interest rate policy, as highly in debt households will be an economic drag on consumption. If debt is considered low, this leaves the door open to rate rises, sooner rather than later.
Third, she perpetuates the view that financial stress is highest among lower income households, but sees little evidence of difficulty among more affluent groups, and argues that many are well ahead with their mortgage repayments. We agree some are, but many more affluent households are also feeling the pinch!
Finally, she is of the view that of households with interest only loans coming up for review, those at risk of not being able to afford a P&I reset, and fall outside current lending standards is quite small (though need watching). That said she highlights risks in the investor portfolios. ” Indeed, the macro-financial risks are potentially heightened with investor lending”. We agree, this is 36% of the portfolio!
So, her conclusion is, move along, nothing to see here! We think the financial stress story is more significant, but there is no authoritative official data covering this topic. Surely a gap the RBA needs to close! Especially if home prices momentum continues to sag.
Thank you for the opportunity to be here today. The title of the summit, ‘Responsible Lending and Borrowing – Risk, Responsibility and Reputation’, really struck a chord with me because there has been much discussion over the past few years about housing prices and the increasing debt being taken on by the household sector.
The Reserve Bank’s interest in this area springs from both its responsibility for monetary policy and its mandate for financial stability. From the perspective of monetary policy, high debt levels will influence the calibration of interest rate changes. The more debt households have, the more sensitive their cash flow, and hence consumption, is likely to be to a rise in interest rates. Households with higher debt levels may also sharply curtail their consumption in response to an adverse shock such as rising unemployment or large falls in house prices, amplifying any economic downturn. My focus today, however, is on the potential risks to financial stability from this build up in debt. One of the key issues we have been focusing on is the extent to which rising household debt might presage stress in household budgets, with flow on effects to financial stability and ultimately to the economy. There has been a lot said and written about this issue in recent times, using a multitude of data sources and anecdotes. What I hope to do today is to put this information into some context to provide a balanced view on the current and prospective levels of household financial stress, and hence the implications for financial stability.
I want to make a couple of points at the outset. The first is that there are clearly households in Australia at the moment that are experiencing financial stress. By focusing on whether financial stress has implications for financial stability, I am not in any way playing down the difficulties some households are experiencing. There is a very real human cost of financial stress.
Second, some of the most financially stressed households are those with lower incomes which typically rent rather than borrow to buy a home. Access to suitable affordable housing for this group is clearly an important social issue. But given the topic of this summit and the potential link to financial stability, I am going to focus in this talk on household mortgage debt and the potential for financial stress resulting from this.
What is Financial Stress?
Definitions of financial stress are many and varied. One definition could be where a household fails to pay its bills or scheduled debt repayments on time because of a shortage of money. This is quite narrow – it captures only those households for which stress has already manifested in missed payments. A much broader definition of financial stress might be a situation where financial pressures are causing an individual to worry about their finances, or where an individual cannot afford ‘necessities’. These definitions might be good leading indicators of failures to meet debt repayments or defaults. So there is a role for a variety of indicators of stress.
One way of thinking about financial stress is in terms of a spectrum or a pyramid, running from mild stress to severe stress (Graph 1). At the mild end, the base of the pyramid, people may perceive that they are financially stressed when they have to cut back on some discretionary expenditure, such as a holiday or a regular meal out. Slightly further up the pyramid, they may not be able to pay bills on time, or might have to seek emergency funding from family. At the top of the pyramid – severe financial stress – a household might be unable to meet mortgage repayments or ultimately be facing foreclosure or bankruptcy.
Graph 1
The pyramid is wider at the bottom than the top reflecting the fact that there will always be more households in milder stress than in severe stress. For some households experiencing milder stress their circumstances might deteriorate and they will move to a more severe form of financial stress. But some others might continue to restrain spending on discretionary items so as to meet essential payments. Others might experience a change in circumstances that improves their financial position.
Triggers and Protections from Financial Stress
Most people don’t consciously set out to put themselves in a position of financial stress. Sometimes people might choose to stretch themselves initially in taking out a loan, perhaps even putting themselves into mild, temporary financial stress. But they would typically be doing so on the expectation that it will become more manageable over time as their income rises. More serious financial stress often only comes about by a combination of what turns out to be excessive debt and changed circumstances. A level of mortgage debt that looked manageable when it was taken out might become unmanageable if, for example, the primary income earner of a household becomes unemployed. Or if life circumstances change, such as through ill health, the birth of a child or breakdown of a relationship.
So what do conditions in the housing sector over the past few years suggest about the potential for financial stress? You are all familiar with the broad story. House prices have been rising rapidly, particularly in Sydney and Melbourne. At the same time, household mortgage debt has been rising while incomes have been growing relatively slowly. As a result, the average household mortgage debt-to-income ratio has risen from around 120 per cent in 2012 to around 140 per cent at the end of 2017 (Graph 2, left panel). Furthermore, the increasing popularity of interest-only loans over recent years meant that by early 2017, 40 per cent of the debt did not require principal repayments (Graph 3). A particularly large share of property investors has chosen interest-only loans because of the tax incentives, although some owner-occupiers have also not been paying down principal. This presents a potential source of financial stress if a household’s circumstances were to take a negative turn.
Graph 2
Graph 3
This is where lending standards come in. There is always a balance to be struck with lending standards. If they are too tight, access to credit will be unreasonably constrained, potentially impacting economic activity and restricting some households from making large purchases that they can afford. If they are too loose, however, borrowers and lenders could find risks building on their balance sheets which, if large enough, might have implications for financial stability. Over the past few years in Australia, regulators have been concerned that lending standards have erred on the more relaxed side. An exuberant housing market in some parts of the country and strong competition among lenders raised the question of whether financial institutions had been appropriately prudent in assessing a household’s ability to meet repayments.
In response, a number of measures were implemented by APRA and ASIC to strengthen mortgage lending standards. These measures have helped improve the quality of lending over the past couple of years. But there is still a large stock of housing debt out there, some of which probably would not meet the more conservative lending standards currently being imposed. How large a risk does this pose to financial stability? It depends on a number of things, including how lax the previous lending standards were, how much of the stock was lent under less prudent standards and the repayment patterns of borrowers. One way of assessing the risk though is to look at the level and trajectory of mortgage stress.
Measures of Financial Stress
There is no single measure that captures the level of financial stress. There are comprehensive surveys, such as the survey of Household, Income and Labour Dynamics in Australia (HILDA) and the Survey of Income and Housing (SIH), that are methodologically robust, but are only available with a lag. A number of private sector surveys are more timely but it can be harder to assess whether their methodologies are well focused on financial stress. There is also information on non-performing loans, insolvencies and property repossessions that is fairly timely and reliable, but is only an indicator of pretty severe stress. I am going to talk through a few measures and see what they imply about the current level of mortgage stress among Australian households.
Let’s start with some high-level data on debt and debt servicing. As I noted above, the average household mortgage debt-to-income ratio has been rising over recent years. In a sense, this is not really surprising. With historically low interest rates, households have been able to service higher levels of debt. Indeed, the debt-servicing ratio (defined as the scheduled principal and interest mortgage repayments to income ratio) has remained fairly steady at around 10 per cent despite the rise in debt (Graph 2, right panel). But these are averages. It is important to look at the distribution of this debt – are the people holding it likely to be able to service it?
Graph 4
The HILDA survey provides information on the distribution of household indebtedness and debt servicing as a share of disposable income. Looking only at owner-occupier households that have mortgage debt, the survey suggests that the median housing debt-to-income ratio has risen steadily over the past decade to around 250 per cent in 2016 (Graph 4, left panel).[1] However, the median ratio of mortgage servicing payments to income has been fairly stable through time, remaining around 20 per cent in 2016 (Graph 4, right panel). In fact 75 per cent of households with owner-occupier debt had mortgage payments of 30 per cent or less of income, which is often used as a rough indicator of the limit for a sustainable level of mortgage repayments.[2] This suggests that, as recently as 2016, mortgage repayments were not at levels that would indicate an unusual or high level of financial stress for most owner-occupiers. But there is a significant minority for whom mortgage stress might be an issue.
Other data sources suggest that the number of households experiencing mortgage stress has fallen over the past decade. The Census data show that the share of indebted owner-occupier households for which actual mortgage payments (that is, required and voluntary payments) were at or above 30 per cent of their gross income declined from 28 per cent in 2011 to around 20 per cent in 2016. And the 2015/16 Household Expenditure Survey indicates that the number of households experiencing financial stress has steadily fallen since the mid 2000s.
Furthermore, a large proportion of indebted owner-occupier households are ahead on their mortgage repayments. We have highlighted this point in recent Financial Stability Reviews. Total household mortgage buffers – including balances in offset accounts and redraw facilities – have been rising over the past few years as households have taken advantage of falling interest rates to pay down debt faster than required. In 2017, total owner-occupier buffers were around 19 per cent of outstanding loan balances or around 2 ½ years of scheduled repayments at current interest rates (Graph 5, left panel)). There is some variation in buffers. While one-third of outstanding owner-occupier mortgages had at least two years’ buffer, around one-quarter had less than one month (Graph 5, right panel). Not all of these loans, however, are necessarily vulnerable to financial stress. If households are building up other assets instead of building up mortgage buffers, they may still be well positioned to weather any change in circumstances.
Graph 5
All of this suggests that a large proportion of households have some protection against financial stress. There are, however, some households that are more vulnerable, probably those with lower income who cannot afford prepayments or those with relatively new mortgages who have yet to make many inroads.
Another way of measuring financial stress is by asking survey respondents to self-assess. For example, a survey might ask about the respondent’s ability to meet payments, the type of financial stress they have experienced, or whether they have had difficulty raising money in an emergency.
The HILDA survey also provides some information on this. In general, measures such as these indicate that financial stress for owner-occupiers with mortgage debt has not changed much over the past decade, and is actually lower than in the early 2000s. Around 12 per cent of such households indicated that they would expect difficulty raising funds in an emergency in 2016 (Graph 6). The survey also asks people what sort of financial difficulties they had experienced over the past twelve months. For example, did they have difficulty paying a mortgage or bills on time? Were they unable to heat their home or did they have to go without meals? Did they have to ask for financial assistance from family or a welfare agency? A bit less than 20 percent of owner-occupier households said they had experienced at least one difficulty in the past 12 months, but only 5 per cent reported experiencing three or more of these difficulties. Most of these indicators also suggest that, in line with some of the earlier data I noted, stress has declined since 2011, which probably largely reflects the fall in interest rates since that time.
Graph 6
Unfortunately, while the HILDA and SIH data are rich in terms of the information provided, they are not very timely. We have, for example, only just received the 2016 data. So much of the discussion on household stress relies on more timely private surveys. These surveys measure stress in different ways. Some focus specifically on mortgage stress. Others look at housing affordability, including for renters. And still others attempt to measure financial ‘comfort’ more broadly than just housing. Many of these suggest that housing stress has been increasing over the past year or so.
Looking at the history for which we have data for both the private and comprehensive surveys, it is a little difficult to reconcile their findings. But there do seem to be some methodological differences that mean some surveys might overstate financial stress somewhat. For example, in some of these surveys, self-assessed living expenses are used. If households include discretionary expenditure that could be cut back in an emergency, the amount of income available to meet scheduled repayments might be understated. Furthermore, if actual mortgage repayments are used, those households that are routinely ahead of their payments schedule might be assessed as having little spare income for emergencies when in reality they have been building up buffers and have surplus cash flow.
Most of the measures I have discussed so far are more in the nature of potential financial stress. For some households this will likely turn out to be temporary until their circumstances change. But others may find themselves in a prolonged period of belt tightening or, in the extreme, having to sell their property or default on their payments. In this latter case, financial stress will show up in non-performing loans on banks’ balance sheets and perhaps even in property repossessions or bankruptcies. What do these data tell us?
Banks’ non-performing housing loans have been trending upwards over the past few years, although they remain very low in absolute terms at around 0.8 per cent of banks’ domestic housing loan books (Graph 7). Much of this rise is attributable to a rise in non-performing loans in the mining-exposed states of Western Australia and Queensland – not unexpected given the large falls in employment and housing prices in some of these regions.
Graph 7
Personal insolvencies as a share of the population have remained fairly stable over the past few years. Applications for property possession as a share of the total dwelling stock have generally declined since 2010, with the exception being Western Australia (Graph 8). This indicates that financial stress has a high cyclical component, and there are likely to be some regions of the country that are in more difficult times than others. But the focus for financial stability considerations is largely a national rather than a regional perspective.
Graph 8
So my overall interpretation of these myriad pieces of information is that, while debt levels are relatively high, and there are owner-occupier households that are experiencing some financial stress, this group is not currently growing rapidly. This suggests that the risks to financial institutions and financial stability more broadly from household mortgage stress are not particularly acute at the moment.
Housing Investors
Most of my focus so far has been on owner-occupiers who account for around two-thirds of housing debt outstanding. But investment in housing has been growing strongly in recent years. So it is worth briefly considering the risk of financial stress emanating from this group of borrowers.
The risks to financial stability associated with investor mortgage debt are probably a bit different from those associated with owner-occupier debt. Investors tend to have larger deposits, and hence lower starting loan-to-valuation-ratios (LVRs) (Graph 9). They often have other assets, such as an owner-occupied home, and also earn rental income. Higher-income taxpayers are more likely to own investment properties than those on lower incomes, so may be better able to absorb income or interest rate shocks.
Graph 9
But investors have less incentive than owner-occupiers to pay down their debt. As noted above, many take out interest-only loans so that their debt does not decline over time. If housing prices were to fall substantially, therefore, such borrowers might find themselves in a position of negative equity more quickly than borrowers with an equivalent starting LVR that had paid down some principal. Indeed, the macro-financial risks are potentially heightened with investor lending. For example, since it is not their home, investors might be more inclined to sell investment properties in an environment of falling house prices in order to minimise capital losses. This might exacerbate the fall in prices, impacting the housing wealth of all home owners. As investors purchase more new dwellings than owner-occupiers, they might also exacerbate the housing construction cycle, making it prone to periods of oversupply and having a knock on effect to developers.
Data from the Australian Taxation Office (ATO) provide some information on housing investors. While not particularly timely, these data show that the share of taxpayers who are property investors has increased steadily over the past few years. In 2014/15, around 11 per cent of the adult population, or just over 2 million people, had at least one investment property and around 80 per cent of those were geared (Graph 10). Most of those investors own just one investment property but an increasing number own multiple properties. There has also been a marked increase in the share of geared housing investors who are over 60. These factors do not necessarily increase the risk of financial stress but they bear watching.
Graph 10
The recent increases in interest rates on investor loans, in response to APRA’s measures to reduce the growth in investor lending, has probably affected the cash flows of investors. Interest rates on outstanding variable-rate interest-only loans to investors have increased by 60 basis points since late 2016. However, over the past few years, lenders have been assessing borrowers’ ability to service the loan at a minimum interest rate of at least 7 per cent. So while interest rates and required repayments have likely risen, many borrowers should be relatively resilient to the recent changes.
Furthermore, a large proportion of interest-only loans are due to expire between 2018 and 2022. Some borrowers in this situation will simply move to principal and interest repayments as originally contracted. Others may choose to extend the interest-free period, provided that they meet the current lending standards. There may, however, be some borrowers that do not meet current lending standards for extending their interest-only repayments but would find the step-up to principal and interest repayments difficult to manage. This third group might find themselves in some financial stress. While we think this is a relatively small proportion of borrowers, it will be an area to watch.
Conclusion
The historically high levels of mortgage debt in Australia raises questions about the resilience of household balance sheets to a change in circumstances and the ability of the financial system to absorb a widespread increase in household financial stress. The information we have suggests that, while there are some pockets of financial stress, the overall level of stress among mortgaged households remains relatively low. Furthermore, the banking system is strong and well capitalised, and is supported by prudent lending standards. The risks to financial stability from this source therefore remain low although we will need to keep an eye on developments. Appropriately prudent lending standards will continue to play an important role in ensuring that the financial system remains stable and households borrow responsibly.
Speaking to the Conservative Party conference in September 2017, the UK prime minister, Theresa May, gave a stark assessment of the UK housing market which made for depressing listening for many young people: “For many the chance of getting onto the housing ladder has become a distant dream”, she said.
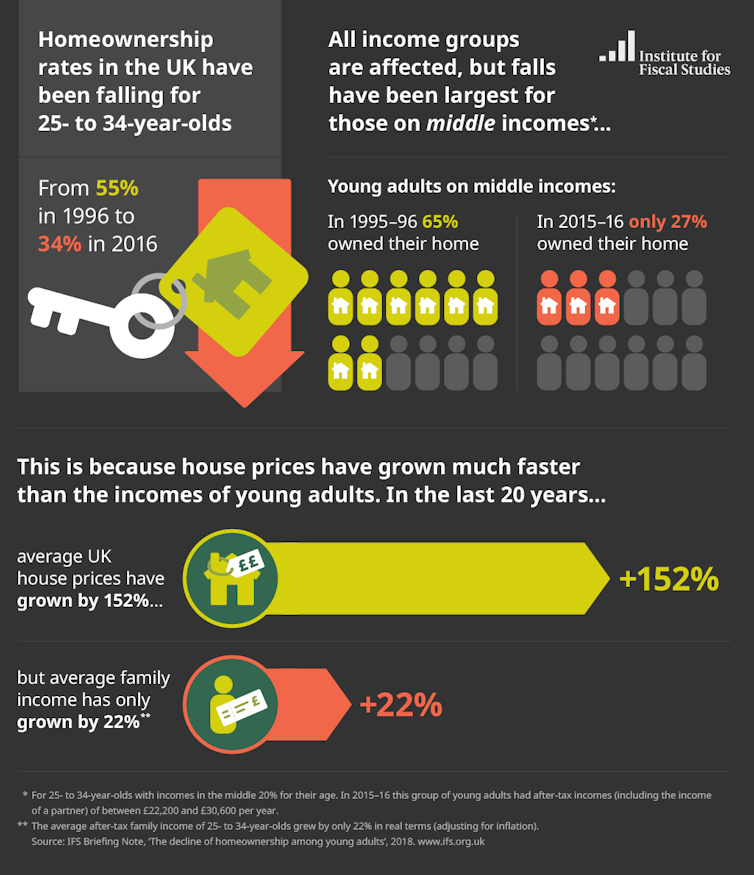
Now a new report by the Institute of Fiscal Studies (IFS) provides further, clear evidence of this. The study finds that home ownership among 25 to 34-year-olds has declined sharply over the past 20 years. Home ownership rates have declined from 43% at age 27 for someone born in the late 1970s, to just 25% for someone aged 27 who was born in the late 1980s.
The most significant decline has been for middle-income young people, whose rate of home ownership has fallen from 65% in 1995/6 to 27% now – most significantly hitting aspirant buyers in London and the South-East.
Causes and consequences
The IFS study lays the blame for all this on the growing gap between house prices and incomes. Adjusting for inflation, house prices have risen 150% in the 20 years to 2015/16, while real incomes for 25 to 34-year-olds have grown by 22% (and almost all of that growth happened before the 2008 crash).
But, as the report acknowledges, the problem goes much deeper than this. Home ownership rates differ by region. Although there has been a decline in home ownership rates for young people across all areas of Great Britain, the decline is less significant in the North East and Cumbria as well as in Scotland and the South West. The biggest decline in ownership has been in the South-East, the North-West (excluding Cumbria) and London.
So a person aged 25 to 34 is more than twice as likely to own their own home in Cumbria, as their counterpart in London. Worse, young people from disadvantaged backgrounds are less likely to own their own homes – even after controlling for differences in education and earnings. Home ownership continues to reflect a deeper inequality of opportunity in our society.
More houses needed
Part of the problem is that both Labour and Conservative governments have seen housing as a single, stand-alone market and have focused their attention on what is happening to prices in London. But housing is a number of different markets, which have regional variations and different interactions between the owner-occupier, private rented and social rented sectors.
Regional variations in house prices for similar sized properties reflect the imbalances of the economy: it is heavily reliant on financial services, which are concentrated in London, while the public sector makes up a significant share of many local economies – particularly in the North. Migration from across the UK to overcrowded and expensive areas – such as London and the South-East – have put property prices in those areas even further out of reach for would-be buyers.
To make matters worse, both Labour and Conservative governments have routinely failed to build enough houses. While the current government’s aim to build 300,000 new properties a year by 2020 is welcome, it is simply not enough to meet the backlog in demand – let alone address the fundamental affordability problem.
Where homes are being built, they’re often the wrong types of homes, in the wrong places. Family homes are being built, despite there being some four million under-occupied such properties across the country.
Not that long ago, government was reducing the housing stock in many parts of the North, through the disastrous Housing Market Renewal programme. Houses are currently being sold in smaller cities such as Liverpool and Stoke-on-Trent for just £1. And none of the government’s actions suggest that ministers understand these issues, or are prepared to address them.
House price inflation – and the awful affect it is having on home ownership rates for young people – is part of a wider problem of the global asset bubble. This bubble has seen huge increases in the price of assets – stocks, housing, bonds – in high income countries such as the UK. Successive governments have helped to fuel this through quantitative easing, ultra-cheap money and successive raids on pension funds.
What’s needed to address this asset bubble is a substantive increase in interest rates. But while this may slow the growth in house prices, the sad truth is it will do nothing to make housing more affordable for most young people.
Author: Chris O’Leary, Deputy Director, Policy Evaluation and Research Unit and Senior Lecturer, Manchester Metropolitan University
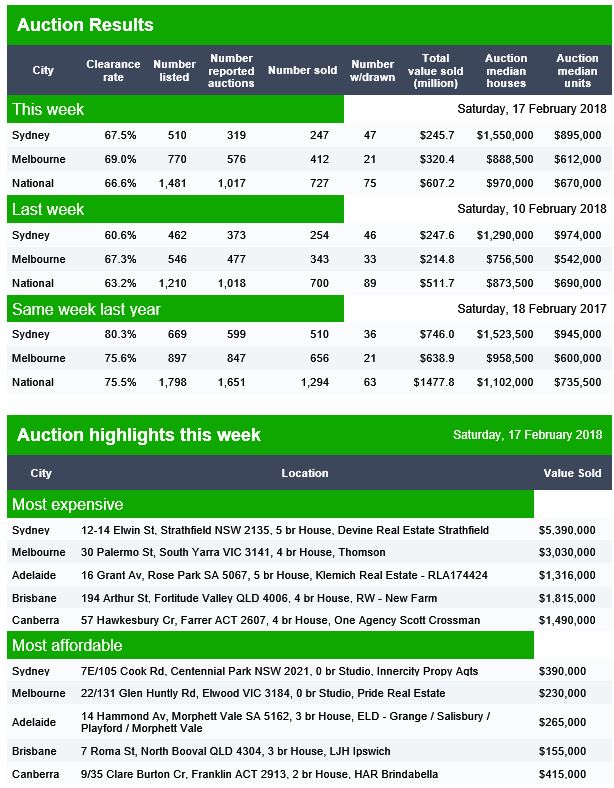
As auction volumes return to more normal levels after the festive period slowdown, auction clearance rates are holding higher than late 2017.
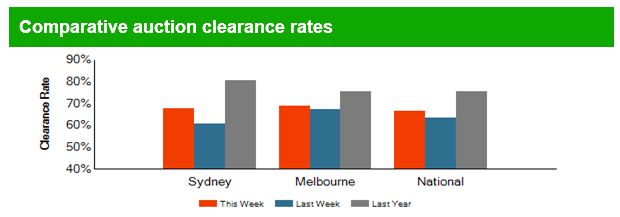
A preliminary auction clearance rate of 69.1 per cent was recorded across the combined capital cities as auction activity ramped up this week, with a total of 1,963 homes taken to auction, increasing from the 1,490 auctions held last week when (based on final results) 63.7 per cent cleared. While auction activity has increased over the last couple of weeks coming out of the slowdown, volumes are increasing at a slower pace than what was seen over the equivalent period last year (2,291).
Sydney’s preliminary clearance rate was recorded at 74.3 per cent across 718 scheduled auctions; well above the trend over the final quarter of 2017 where auction clearance rates were tracking in the low 50 per cent range. A preliminary auction clearance rate of 70.7 per cent was recorded across Melbourne, which is unchanged from last week’s final clearance rate, however volumes increased this week with 923 auctions held up from 619 last week.
This will be the first week in some time where Sydney has outperformed Melbourne, however as final results are collect it will be interesting to see how this revises.
The performance across the smaller auction markets was varied this week, with Adelaide recording a preliminary auction clearance rate of 67.3 per cent, while only 12.5 per cent of auctions were successful in Tasmania.
Looking at results by broad property types, Sydney houses were the best performing market this week, with 74.6 per cent of properties selling, followed closely by Melbourne’s unit market with 74.1 per cent of units selling, which was higher than Sydney’s units.
Domain released their preliminary clearance results for today. All centres are tracking below this time last year, and of course the preliminary results will settle lower in a few days. But the striking observation is the lower volumes, 1,294 a year ago, compared with 727 sold this week. Anyone want to argue against the view the market is softening? Our surveys suggest we will see more of this ahead, as property investors stand on the sidelines, and the backlog of first time buyers is soaked up. Also vendors are having to accept lower bids to close a deal, which will put further downward pressure on prices.
Brisbane cleared 42% of 92 scheduled auctions, Adelaide 69% of 50 auctions and Canberra 57% of 59 scheduled auctions.
Listen, You Can Hear the Screws Tightening On Mortgage Lending. Welcome to The Property Imperative Weekly to 17th February 2018.
Watch the video, or read the transcript.
In this week’s digest of finance and property news we start with Governor Lowe’s statement to the House of Representatives Standing Committee on Economics. He continued the themes, of better global economic news, lifting business investment and stronger employment on one hand; but weak wage growth, and high household debt on the other. But for me one comment really stood out. He said:
it would be a good outcome if we now experienced a run of years in which the rate of growth of housing costs and debt did not outstrip growth in our incomes in the way that they did over the past five years.
This is highly significant, given the fact the lending for housing is still growing faster than wages, at around three times, and home prices are continuing to drift a little lower. So don’t expect any moves from the Reserve Bank to ease lending conditions, or expect a boost in home prices. More evidence that the property market is indeed in transition. The era of strong capital appreciation is over for now.
There was lots of news this week about the mortgage industry. ANZ and Westpac have tightened serviceability requirements. Westpac recently introduced strict tests of residential property borrowers’ current and future capacities to repay their loans. The change is said to be intended to identify scenarios that might affect borrowers’ capacity to pay back their loans. These scenarios include having dependents with special needs that might require borrowers to spend on long-term care and treatment. ANZ has added “a higher level of approval for some discretions” used in its home loan policy for assessing serviceability, reducing approvals outside normal terms.
Talking of lending standards, APRA released an important consultation paper on capital ratios. This may sound a dry subject, but the implications for the mortgage industry and the property market are potentially significant. As part of the discussion paper, APRA, says that addressing the systemic concentration of ADI portfolios in residential mortgages is an important element of the proposals. They have FINALLY woken up to the risks in the system, just years too late! We have significant numbers of loans in the system currently that would now not pass muster. More about that next week.
Their proposals, which focus in on mortgage serviceability, would change the industry significantly, as lower risk loans will be more highly prized (so expect low rate offers for lower LVRs), whilst investment loans, and interest only loans are likely to cost more and be harder to find. Combined this could certainly move the market! The proposals introduce “standard” and “non-standard” risk categories.
As well as increasing the risk weights for some mortgages, they also continue to close the gap between the advanced (IRB) internal approach used by large lenders, and the standard approach used by smaller players. Those in transition (e.g. Bendigo Bank) may find less of an advantage in moving to advanced as a result. You can watch our separate video on this important topic.
Whilst the overall capital ratios will not change much, there is a significant rebalancing of metrics, and Banks will more investment and interest only loans will be most impacted. So getting an investment loan will be somewhat harder and this will impact the property market. The proposals are for consultation, with a closing data 18 May 2018.
Another data point on the property market came from a new report by Knight Frank which claims that in 2017, one-third of Australian residential development sites were sold to Chinese investors and developers. The share of sales to Chinese buyers has tripled since 2013, but decreased from the 38 per cent recorded in 2016. The level of Chinese investment in residential development sites varied from state to state: in Victoria, 38.7 per cent of residential site sales were to Chinese buyers; in New South Wales, 35.6 per cent of residential site sales were to Chinese buyers, and in Queensland, Chinese buyers comprised 7.4 per cent of total residential site sale volumes. So this is one factor still supporting the market, though in Australia, the Australian Prudential Regulatory Authority has encouraged local financial institutions to impose stricter controls, while in China the government has attempted to moderate capital outflow with China’s Central Bank imposing new rules for companies which make yuan-denominated loans to overseas entities.
The data from the ABS on Lending Finance, the last part of the finance stats for December, really underscores the slowing momentum in investment property lending, especially in Sydney (though it is still a significant slug of new finance, and there is no justification to ease the current regulatory requirements.) The ABS says the total value of owner occupied housing commitments excluding alterations and additions rose 0.1% in trend terms, total personal finance commitments fell 0.2%. Revolving credit commitments fell 1.4%, while fixed lending commitments rose 0.5%. There was a small rise in lending for housing construction, but overall mortgage momentum looks like it is still slowing and the mix of commercial lending is tilting away from investment lending and towards other commercial purposes at 64%, which is a good thing.
There is an air of desperation from the construction sector, as sales momentum continues to ease, this despite slightly higher auction clearance rates last week. CoreLogic said the final auction clearance rate was 63.7 per cent clearance rate across almost double the volume of auctions week-on-week (1,470). Over the week prior, a clearance rate of 62.0 per cent was recorded across 790 auctions. Both auction clearance rate and volumes were lower than what was seen one year ago, when a 73.2 per cent clearance was recorded across 1,591 auctions. There is significant discounting going on at the moment to shift property, and some builders are looking to lend direct to purchases to make a sale. For example, Catapult Property Group launched a new lending division that will help first home buyers get home loans with a deposit of only $5,000. The Brisbane-based company encourages first home buyers in Queensland to enter the real estate market now by taking advantage of the state government’s $20,000 grant that is ending on 30 June 2018. This is at a time when lenders are insisting on larger deposits, and are applying more conservative underwriting standards.
Economic data out this week showed that according to the ABS, trend unemployment remained steady at 5.5%, where it has hovered for the past seven months. The trend unemployment rate has fallen by 0.3 percentage points over the year but has been at approximately the same level for the past seven months, after the December 2017 figure was revised upward to 5.5 per cent. The ABS says that full-time employment grew by a further 9,000 persons in January, while part-time employment increased by 14,000 persons, underpinning a total increase in employment of 23,000 persons. The fact is that while more jobs are being created, it is not pulling the rate lower, and many of these jobs are lower paid part time roles – especially in in the healthcare sector. In fact, the growth in employment is strong for women than men. A rather different story from the current political spin!
In a Banking Crisis, are Bank Deposits Safe? We discussed the consequences of recently introduced enhanced powers for APRA to deal with a bank in distress this week. There were several well publicised Government bail-out’s of banks which got into problems after the GFC. For example, the UK’s Royal Bank of Scotland was nationalised. This costs tax payers dear, so there were measures put in place to try to manage a more orderly transition when a bank gets into difficulty and raises the question of “Bail-in” arrangements. Take New Zealand for example. There regulators have specific powers to grab savings held in the banks in assist in an orderly transition in the case of a failure, alongside capital and other bank assets. And, given the New Zealand position (and the tight relationship between banking regulators in Australia and New Zealand), we should look at the position in Australia. Are deposit funds in Australia likely to be “bailed-in”? Well, the Treasury confirmed that because deposits are not classified as capital instruments, and do not include terms that allow for their conversion or write-off, they cannot be ‘bailed-in’. But we have a catch all clause in APRA’s powers that says they can grab “any other instrument” and deposits, despite the Treasury reassuring words, is not explicitly excluded. So I for one cannot be 100% convinced savings will never be bailed-in. And that’s a worry! I recall the Productivity Commission comment last week, that financial stability had taken prime place compared with competition (and so customer value) in financial services. The issue of bail-in of deposits appears to be shaping the same way. You can watch our separate video discussion on this important topic.
The first round of public hearings for the Banking Royal Commission will focus on lending, including mortgages, credit cards and car loans; we heard during the opening session. The Commission highlighted the large size of the lending market, and the significant number of submissions they have already received on misconduct in this area, including relating to intermediaries, commission and advice. In addition, as part of the opening address, we were told that some of the major players were unable to provide the full range of misconduct information that Commission requested. Some players offered a few case studies, and were then asked to provide more detail over the past 5 years (as opposed to 10) but said they could not meet the required deadline. Based on the opening round, Banks are going to find this a painful process. Not least because The Commission is publishing information on the sector. In its first release, it pointed to declining competition in the banking sector, with the number of credit unions falling due to consolidation and the major banks holding 75 per cent of total assets held by ADIs in Australia. The paper noted that five of the 20 listed companies that make up the ASX20 are banks, noting that the major banks have “generally achieved higher profit margins than other types of ADIs” with a profit margin of 36.4 per cent in the June quarter 2017. They also underscored that Australia’s major banks are “comparatively more profitable” than some of their international peers in Canada, Sweden, Switzerland and the UK.
We expect to hear more from the Royal Commissions on unfair and predatory practices. To underscore this there was some good news for Credit Card holders, with new legalisation passed in parliament to force Credit card providers to scrap unfair and predatory practices. However, the implementation timetable is extended into 2019. The reforms include:
Requiring affordability assessments be based on a consumer’s ability to repay the credit limit within a reasonable period (from July 2018). This tightens responsible lending obligations for credit card contracts.
Banning unsolicited offers of credit limit increases (from January 2019). At the moment, whilst the law forbids providers from making these sorts of offers in writing, offers can be made by phone and other mediums. This loophole has been exploited, but will now be closed.
Simplifying how credit card interest is calculated, especially, banning the practice of backdating interest rate charges. Currently, some providers were attracting new customers with promotional low rate, or no rate offers, say for the first month. But, if a customer failed to pay off in full a credit card bill after the first month, the credit card company was often retrospectively applying the new interest rate to previous purchases. This was allowed in the banks’ small print, but the government said the practice did “not align with consumers’ understanding and expectation about how interest is to be charged”. This will be banned, from next year.
Requiring credit card providers to have online options to cancel cards or to reduce credit limits (from January 2019). At the moment, some card providers force customers to come into a bank branch to reduce limits or terminate cards, and when they did come in were often persuaded not to do it. The asymmetry between fast credit card approvals online, and slow cancellation will end.
So another week highlighting the stresses and strains in the banking sector, and the forces behind slowing momentum in the property market. And based on the stance of the regulators, we think the screws will get tighter in the months ahead, putting more downward pressure on mortgage lending home prices and the Banking Sector. Something which the RBA says is a good thing!
CoreLogic’s final auction results are out for last Saturday. Higher than last week, but significantly lower than last year at this time.
Last week, the final auction clearance rate increased across the combined capital cities, returning a 63.7 per cent clearance rate across almost double the volume of auctions week-on-week (1,470).
Over the week prior, a clearance rate of 62.0 per cent was recorded across 790 auctions. Both auction clearance rate and volumes were lower than what was seen one year ago, when a 73.2 per cent clearance was recorded across 1,591 auctions.
As the property market cools, some developers are getting into the lending game (and of course outside APRA supervision). First Time Buyers are significant targets.
Property developer Catapult Property Group has launched a new lending division that will help first home buyers get home loans with a deposit of only $5,000.
The Brisbane-based company encourages first home buyers in Queensland to enter the real estate market now by taking advantage of the state government’s $20,000 grant that is ending on 30 June 2018.
Catapult director for residential lending Paul Anderson said first home buyers do not require a 20% deposit plus fees to enter the property market.
“There are many banks that are happy to finance a purchase from as little as 5% deposit and in some cases even less than that,” he said. “When working with property specialists such as Catapult Property Group who have the builder, broker and financial advisors under the one roof, it’s possible to secure a loan with as little as $5,000.”
To get a home loan with a minimal deposit, the company requires that applicants have a full-time job with a stable employment history, a consistent rental payment record, and a clear credit score.
Borrowers may also need to get lenders’ mortgage insurance.
“Mortgage insurance on a $450,000 home purchase with a minimal deposit usually ranges from $7,000 to $14,000, which is added to your mortgage. This is a more realistic means of entering the property market than trying to save a potentially unattainable amount of around $100,000 for a deposit,” said Anderson.
The company says it has almost $130m of residential projects in Queensland and NSW.
A suitable construction funding model is the critical missing ingredient needed to deliver more affordable housing in Australia. Aside from short-lived programs under the Rudd government, we have seen decades of inconsistent and fragmented policies loosely directed at increasing affordable housing. These have failed to generate anything like enough new supply to meet outstanding needs.
Our latest research looked at recently built, larger-scale affordable housing projects in contrasting markets across Australia. We examined each scheme’s cost, funding sources and outcomes. We then developed a housing needs-driven model for understanding the financial and funding requirements to develop affordable housing in the diverse local conditions across the country.
Up to now, the key stumbling block has been the “funding gap” between revenue from rents paid by low-income tenants and the cost of developing and maintaining good-quality housing. The Commonwealth Treasury acknowledged this problem last year. And the problem is greatest in the urban areas where affordable housing is most needed.
What does the new model tell us?
The Affordable Housing Assessment Tool (AHAT) enables the user to calculate cost-effective ways to fund affordable housing to meet specified needs in different markets. It’s a flexible interactive spreadsheet model with an innovative feature: it enables users to embed housing needs as the driver of project and policy, rather than project financial feasibility driving who can be housed.
Affordable housing developments have recently been relatively sparse. However, our research highlighted the varied and bespoke funding arrangements being used.
Despite this variety, too often project outcomes are driven purely by funding opportunities and constraints, rather than by defined housing needs. One notable constraint is the fragmented nature of affordable housing subsidy frameworks both within and across jurisdictions.
Our case study projects generated a diversity of housing outcomes. This can be seen as an unintended positive of the bespoke nature of affordable housing provision as a result of the need to “stitch together” gap funding from multiple sources on a project-by-project basis.
Equally though, the lack of policy coherence and fit-for-purpose funding added cost and complexity to the development process. By implication, this leads to a less-than-optimal outcome for public investment. Despite providers’ best efforts, current approaches are not the most efficient way to deliver much-needed affordable housing.
What are the lessons from this research?
We applied the model to typical housing development scenarios in inner and outer metropolitan areas and regions. By doing so, we identified six key lessons for funding and financing affordable housing delivery.
1) Government help with access to land is central to affordable housing development and enhances long-term project viability.
Especially in high-pressure urban markets, not-for-profit housing developers cannot compete with the private sector for development sites. High land costs, particularly in inner cities where affordable housing demand is most extreme, can render financial viability near impossible. Having access to sites and lower-cost land were two of the most important components of feasible projects.
2) Government equity investment offers considerable potential for delivering feasible projects and net benefit to government.
How governments treat the valuation of public land with potential for affordable housing development must be reviewed. Conventionally, even where affordable housing is the intended use, governments typically insist on a land sale price based on “highest and best use”.
It would be preferable in such cases to treat the below-market value assigned to public land as a transparent subsidy input. This would mean the sale price reflects the housing needs that the development seeks to meet. That is, the land value should be priced as an affordable housing development for a specific needs cohort.
By retaining an equity stake, government could account for its input as an investment that will increase in value over time as land values appreciate.
3) Reducing up-front debt load and lowering finance costs are critical to long-term project viability.
Debt funding imposes a large cost burden over a project’s lifetime. This is ultimately paid down through tenant rents. Reducing both the cost and scale of private financing can have a significant impact on project viability.
The analysis reinforces the rationale for the Australian government’s “bond aggregator” facility for reducing financing costs for affordable housing projects. But this must come in tandem with other measures to reduce up-front debt.
4) Delivery across the range of housing needs helps to meet overall social and tenure mix objectives. This also can help improve project viability through cross-subsidy.
Mixing tenure and tenant profiles can enable affordable housing providers to produce more diverse housing that meets the full range of needs.
Cross-subsidy opportunities arising from mixed-tenure and mixed-use developments can also enhance project feasibility. By improving a provider’s financial position, this helps advance their long-term goal of adding to the stock of affordable housing. And, by providing welcome flexibility, this enables organisations to better manage development risk across different markets and cycles.
5) The financial benefit of planning bonuses is limited
Inclusionary zoning mechanisms impose affordable housing obligations on developers through the planning system. This approach potentially offers a means of securing affordable housing development sites in larger urban renewal or master-planned areas.
However, our research demonstrated that planning bonuses allowing increased dwelling numbers in return for more affordable housing have little beneficial impact on project viability. This is because the additional dwellings allowed generate additional land and/or construction costs but no matching capacity to service a larger debt.
However, planning bonuses can be useful as part of a cross-subsidy approach. In this case, they may support project viability, without necessarily resulting in any additional affordable dwellings.
6) Increasing the scale of not-for-profit provision offers financial benefits that help ensure the long-term delivery of affordable housing.
Our analysis supports the case for targeting public subsidy to not-for-profit developers (government or non-government) to maximise long-term social benefit. Investing in permanently affordable housing ensures the social dividend of affordable housing can be continued into the future.
Comparable subsidies are not preserved when allocated to private owners. They will seek to trade out at some stage, capitalising the subsidy into privatised gain.
The results of our case study analyses and modelling highlight the need to develop comprehensive funding and subsidy arrangements that account for different costs in different locations. These arrangements also must be integrated nationally to support affordable housing delivery at scale.
This study reiterates the common finding of research over the last decade: both Commonwealth and state/territory governments need to develop a coherent and long-term policy framework to provide housing across the full spectrum of need.
Authors: Laurence Troy, Research Fellow, City Futures Research Centre, UNSW; Bill Randolph, Director, City Futures – Faculty Leadership, City Futures Research Centre, Urban Analytics and City Data, Infrastructure in the Built Environment, UNSW; Ryan van den Nouwelant, Senior Research Officer – City Futures Research Centre, UNSW; Vivienne Milligan, Visiting Senior Fellow – City Futures Research Centre, Housing Policy and Practice, UNSW
This week across the combined capital cities, auction volumes continued to increase with 1,464 homes taken to auction returning a preliminary clearance rate of 67.7 per cent, increasing from 62.0 per cent across 790 auctions last week, although this is likely to revise down over the week. Over the same week last year 1,591 auctions were held, while the clearance rate was a stronger 73.2 per cent. Adelaide and Perth were the only cities to see clearance rates fall over the week, while volumes increased everywhere except Adelaide. The strongest preliminary clearance rate was recorded in Melbourne (72.5 per cent), followed by Adelaide (68.9 per cent).

 They show unemployment drifting down to 5%, whilst there is a little improvement in GDP. The RBA cash rate rises to 3.25% in 2022/3. Overall wages growth drifts higher to 2.9% in 2023. House prices remain elevated, as does household debt, and debt to income rises, as interest rates climb.