A significant proportion of the Australian economy is at risk if the property market takes a fall, according to data released today. That’s a problem because the sector is not really productive, simply riding the back of inflating home prices, mortgages and debt.
The property industry now employs more people than any other sector, according to a new report by AEC Group.
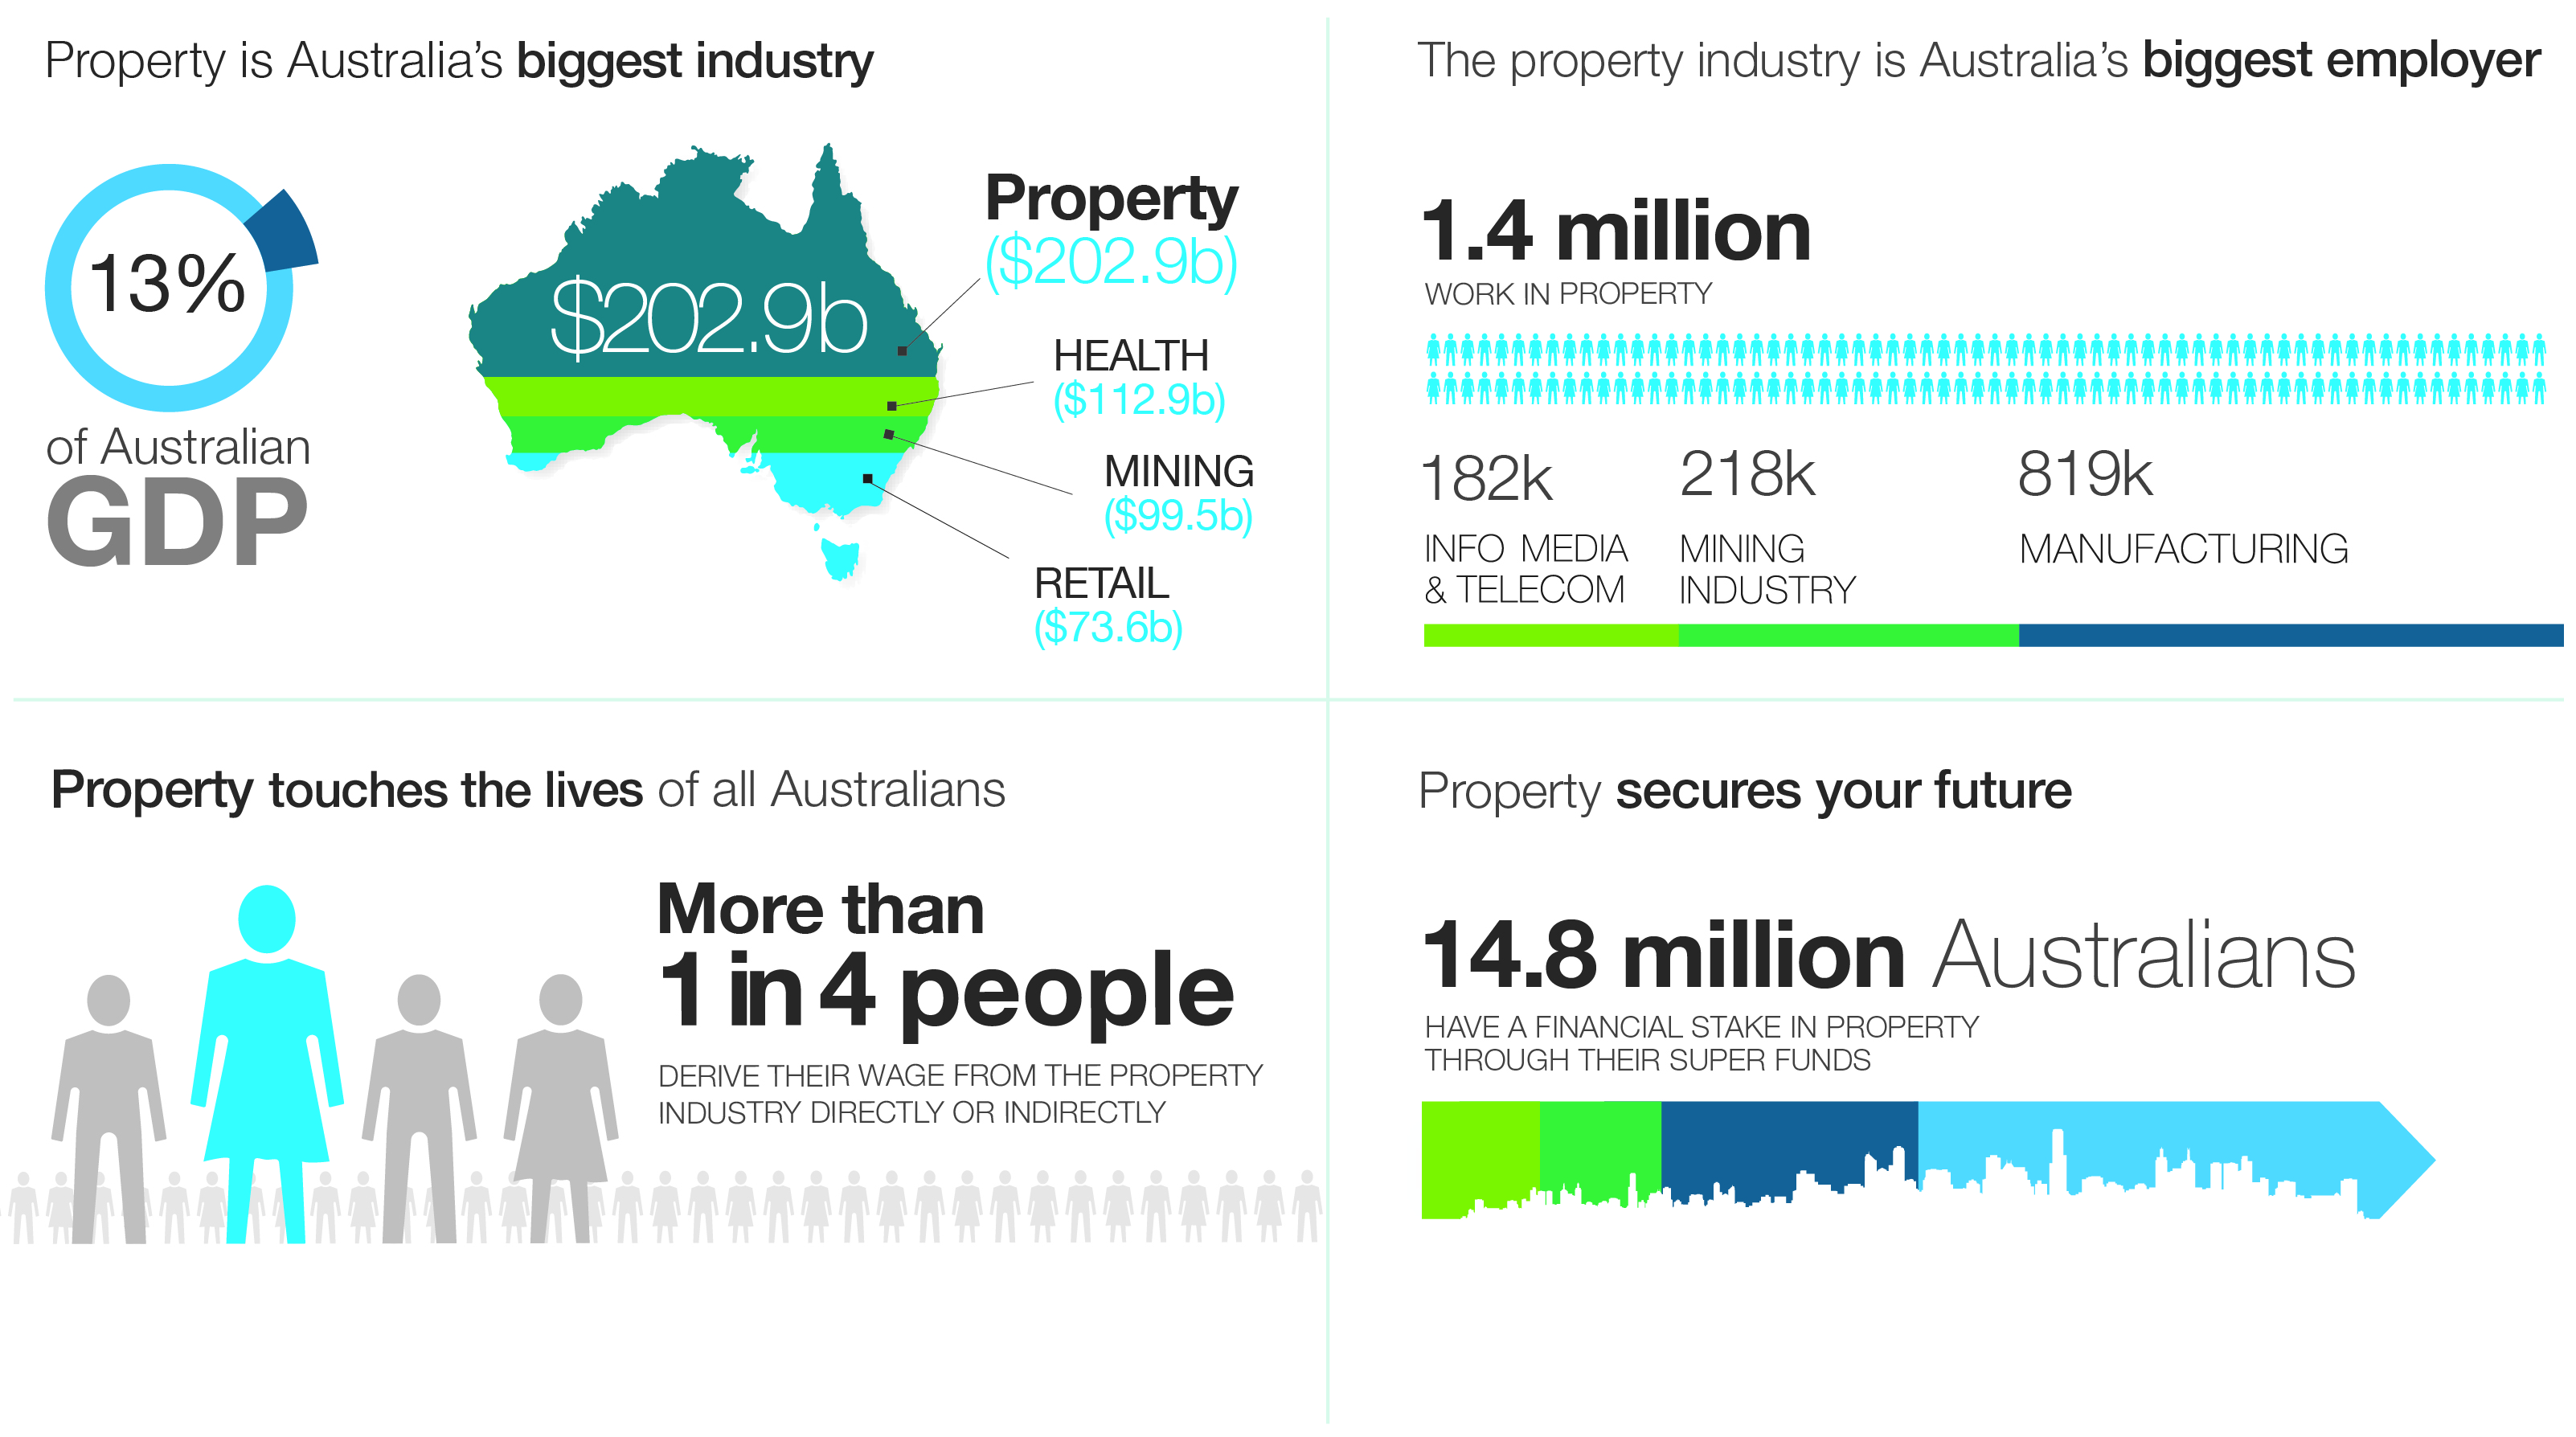
The property industry accounts for more than 1.4 million jobs, according to the report, taking over health care and social assistance as the nation’s largest employers.
Source: Property Council of Australia.
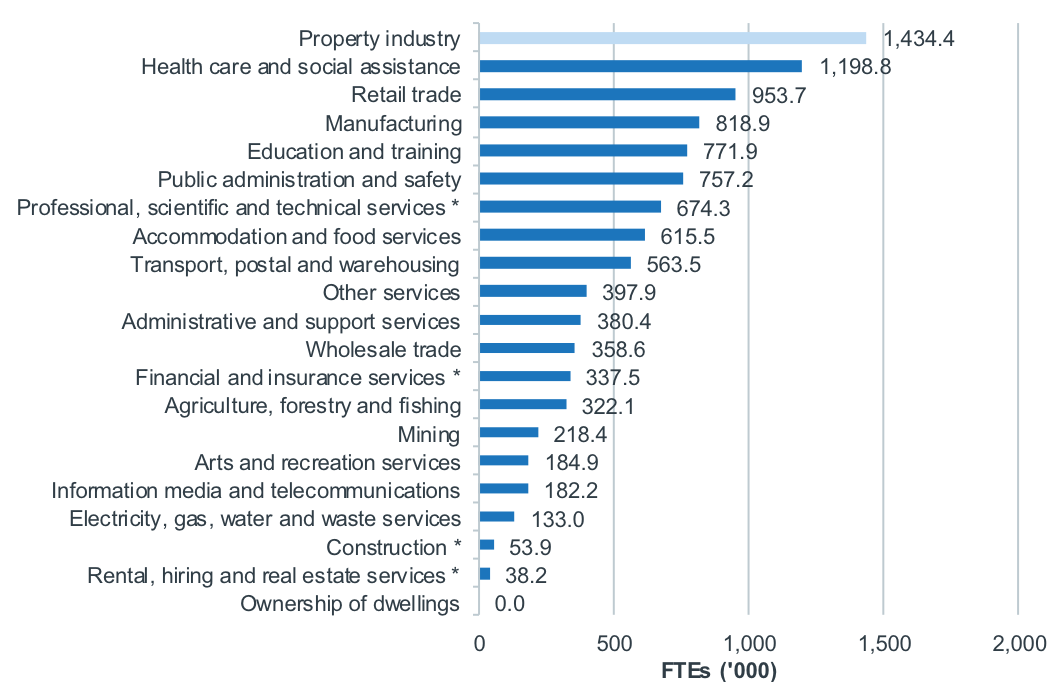
Between 2013-14 and 2015-16, the number of jobs in the property industry grew by 22 per cent.
Direct Contribution to Employment by Industry, 2015-16 (‘000 FTEs)
Note: * Only non-property related activity is included for this industry classification. All property related activity is included in the property industry. Sources: AEC, ABS (2017a, 2017b, 2017c, 2017d, 2017e, 2016b, 2016c and 2013), APRA (2017a, 2017b and 2013), RBA (2017a and 2017b).
Source: Property Council of Australia.
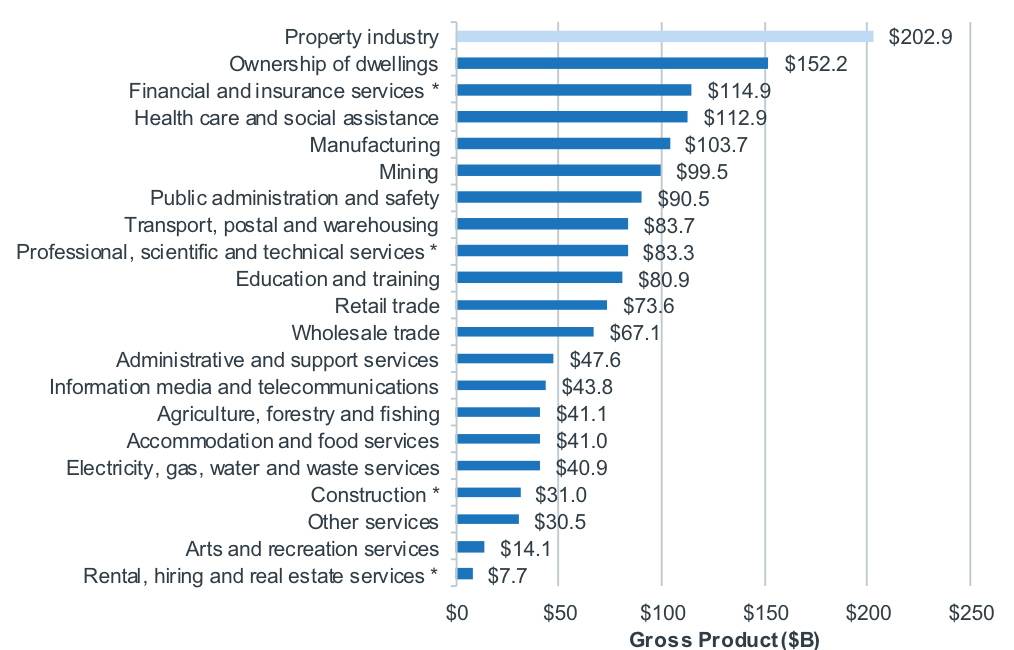
The property industry also contributed $202.9 billion to GDP in 2015-16, an increase of $20.4 billion since 2013-14, extending its lead as the biggest direct contributor to GDP.
Direct Contribution to Gross Domestic Product by Industry, 2015-16 ($ Billion)
Note: * Only non-property related activity is included for this industry classification. All property related activity is included in the property industry. Sources: AEC, ABS (2017a, 2017b, 2017c, 2017d, 2017e, 2016b, 2016c and 2013), APRA (2017a, 2017b and 2013), RBA (2017a and 2017b).
Source: Property Council of Australia.
The industry also contributes $87.9 billion each year to Australian, state, territory and local government tax revenues.
Ken Morrison, chief executive of the Property Council, said the research shows how important the property industry is to the overall economy as the major creator of new jobs and in supporting communities.
“More than 1 in 4 wages rely on our industry,” said Morrison. “That’s a huge contribution to the livelihoods of individuals and families across the nation.
“These are white-collar and blue-collar jobs, from high finance to skilled trades, and from construction to the managers of the most sophisticated commercial properties.”
The release of the AEC Research marks the beginning of a Property Council campaign to promote the importance of the property industry in Australia.
We get a steady flow of questions from those who read our research, or follow our posts, but one question, more than any other we get asked is – Should I Buy Property Now? Many cite the real estate industry claims that now is a great time to buy – but is it really? Today we are going to explore this question, but with a caveat. This is NOT financial advice, and is simply my opinion, based our own research and surveys. Your mileage may vary. The market is different across states and locations.
Watch the video or read the transcript.
But it is an important question given that home prices appear to have reached something of a peak, and may be sliding in some areas; housing is Australia is unaffordable, as the recent Demographia report showed; banks are tightening their lending standards under regulatory pressure; net rental streams are looking pretty stressed; many households are under severe financial pressure, and mortgage interest rates are likely to rise.
In fact, we have a generation of home buyers and prospective home buyers who have only ever seen home values rise, and if you are in the property owning system, is has become a significant source of wealth creation, amplified if you are a property investor, and assisted by ultra-low interest rates, tax breaks and other incentives. But will the good times continue to roll? Not necessarily.
So to decide if now is a good time to buy, consider these questions.
First, why do you want to buy a property? Up until recently, our surveys have shown the number one reason to buy was capital appreciation and wealth building, with finding somewhere to live a poor second. But now, if you are wanting to buy to grow wealth, we say be careful, as the market dynamics are changing, and its likely prices will slide. Also there may be changes to negative gearing under a Labor government, and property investment mortgage rates are likely to rise, while rental streams are not, so more investment properties, on a cash flow basis will be under water. At the moment there are much better returns from the buoyant stock market, though of course that may change. Remember that prices crashed by 40% in Ireland, 35% in the USA and 25% in UK after the GFC. Prices can go down as well as up. Property is not a one-way bet!
But, if you are seeking to buy, for somewhere to live, and capital growth is less important to you, then it may still be a good time to transact. Prices are already down, and many sellers are accepting deeper discounts off the asking price to make a deal. In addition, if you are a first time buyer, there are state incentives and really low mortgage rates available. But remember you are still buying into a highly unaffordable market, and the capital value of your property may fall. This could turn into a paper loss, and indeed should you need to sell, a real financial hit. The way a mortgage works is you put in a deposit, and the bank lends the rest. But in a falling market, it is your deposit which is eroded. After the GFC many households in the northern hemisphere ended up in negative equity, meaning the value of their mortgage was larger than the market value of their property. As a result, people were stuck living in their properties unable to move, hoping the market would rise again. In fact, it did over the next 10 years, so now many are no longer in negative equity. But it can be a long and winding road.
Next, if you do decide to buy, do the work. First look around at property available, and recent sales, to get a sense of the market. Also look in different areas, and even different states. Often locations a little further from public transport are cheaper – but then is the trade-off worth it? Also compare new builds with existing property. Often newly constructed homes carry a premium, which just like a new car, on first use falls away. On the other hand, there are some desperate builders out there, with big projects, and few buyers, especially in the high-rise belts of Brisbane, Melbourne and Sydney, so they may do a deal. We are seeing a steady stream of people who sign up for off the plan builds, but then when it comes to getting a mortgage, they cannot find one, so cannot complete. So read the small print on these contracts. Ask yourself, what happens if you cannot complete the transaction.
It is also harder to add any value to a new property, whereas an older one may offer more potential for investment and upgrade, and this can be a way of helping to preserve value. There is an old adage – buy the worst property on the best street. This is still true, with caveats – you should check the condition of the property so you know what you are up for.
Also, do the work when it comes to a mortgage. Our research shows you can often get better mortgage rates from some of the smaller customer owned lender, as opposed to the big four by going direct to them. So shop around. Whilst using a broker may help, again we find that some of the best rates are found by borrowers who do the work themselves. Many brokers will do the right thing, and really help, but there is a risk that the commission and ownership structure of broker firms may mean they do not have access to the best rates, and they may not always be working in your best interests, so be careful.
There is more work to do also, on affordability. A lender will make an offer of a mortgage, based on your financial details as contained in the application, and supporting evidence. Remember lenders want to make a loan – it is the only game in town in terms of their profitability – but there is evidence that some lenders will offer a bigger loan, by using more aggressive living expenses, and income assumptions. That said, the industry is getting more conservative, with lower allowable loan to value ratios, and some income categories now reduced.
Just because the lender says you can have a loan, does not mean you should get the loan. The lender is looking at risk of loss from their perspective, not yours. If you have a large deposit, then the bank can assume that capital is available on default to recover their mortgage. Remember in Australia, you cannot just walk away and return the keys, the liability stays with you. So, ask the lender, not just about repayments at current interest rates, but also what happens if they rise. A good rule of thumb is catering for a 3% rise in rates. Get the lender to tell you what the revised repayments would be at this higher rate, and ask yourself if you could still make the repayments. This is important, as incomes are not growing in real terms and mortgage rates may well rise. If you cannot make the repayments at 3% high, get a smaller loan, and buy a smaller place.
You may need to build your own cash flow to test what is affordable – again do not rely on the bank for this – remember they are concerned about risk of loss to their shareholders, not to you. ASIC’s MoneySmart Budget Planner is a good starting point. Also, remember to include the transaction and stamp duty costs in your calculations.
Another area is the deposit you will need. These days you are likely to need a bigger deposit. 20% would be a good target, as this then avoids having to pay for expensive Lenders Mortgage Insurance. Above that, you will need this facility – which to be clear, protects the bank, not you!
More prospective borrowers are turning to the Bank of Mum and Dad, for help, but there are also risks attached to this arrangement – see our earlier Video Blog on the Bank of Mum and Dad. Some buyers are clubbing together to purchase, but there are risks attached to these arrangements too.
Finally, if you do buy, work on the assumption you will need to hold the property for some time – say a minimum of 3-5 years. The old trick of flicking after a year or so will not work if, as we expect prices fall. Remember too that there are additional costs to owning a property from council rates, running costs – such as electricity – and maintenance costs. Owning property is an expensive business. Make sure these costs are included in your cash flows.
So what’s the bottom line? If you are wanting to buy to put shelter over your family’s head, and can afford the mortgage, and are willing to accept a risk of loss of capital, then do the work, and it might be the right thing to do. A capital gain is by no means certain in the current climate!
But, if you are looking at property as a wealth building tool, I think you might do better to hold off, as prices are likely to slide, and the costs of an investment mortgage are on the rise. At very least look in areas around Hobart and Adelaide where value is better at the moment.
In fact, though, the only reason I can see to transact in this case is to lock in a negative gearing arrangement now, before the next Federal election. But then, that seems to me to be a long bow, and our modelling suggests that the removal of negative gearing will have only a minor impact on the market. There are a bunch of other more compelling reasons to think the market will fall.
So in summary, whatever type of borrower you are, do the work and be very careful. Prices may rise, but they can also certainly fall, and a mortgage could just be a noose around your neck.
If you found this useful, do like the post, leave a comment, and subscribe to receive future updates. Keep an eye out for our upcoming special post on Cryptocurrencies and Bit Coin.
The Victorian Government has reaffirmed their intent to shortly accept applications for its shared equity scheme known as HomesVic from up to 400 applicants. This was first announced in March 2017.
As we said at the time:
… our analysis not only here but overseas is that they simply lifts prices by the same amount. It is a zero sum game.
Whilst we understand the political agenda, this move is unlikely to improve housing affordability and access to property.
Of course many will highlight that fact that buyers will be entering the market as prices being to go south, and might even suggest this is a further attempt to keep the property market afloat.
The scheme will allow young people to purchase a home with the state government providing up to 25 percent of the purchase price – reducing the size of the mortgage that must be taken out. When the house is sold, the government recoups its share of the proceeds.
The $50-million initiative aims to make it easier for first-home buyers to enter the market by reducing the size of their loan, hence reducing the amount they need to save for a deposit.
The initiative targets single first-home buyers earning an annual income of less than $75,000 and couples earning less than $95,000.
Eligible applicants must buy in so-called “priority areas” which include 85 Melbourne suburbs, seven fringe towns and 130 regional towns and suburbs.
In Melbourne, the list includes suburbs around Box Hill, Broadmeadows, Dandenong, Epping, Fishermen’s Bend, Footscray, Fountain Gate, Frankston, LaTrobe, Monash, Pakenham, Parkville, Ringwood, Sunshine and Werribee.
The scheme is not available in most of Melbourne’s bayside suburbs, the leafy inner eastern suburbs or some pockets of the inner north.
The state government said the locations were chosen in growth areas where there was a high demand for housing and access to employment and public transport.
Regional centres on the list include Ballarat, Bendigo, Castlemaine, Geelong, La Trobe, Mildura, Seymour, Shepparton, Wangaratta, Warrnambool and Wodonga.
Some of the locations are where mortgage stress, on our modeling is highest – we will release the January results next week.
The move was welcomed by HIA – “it is a positive scheme that addresses the rising problem of housing affordability and will help see young people achieve the Aussie dream of owning their own home faster,” senior spokesperson for HIA Kristen Brookfield said.
“HIA figures show that the typical stamp duty bill on homes in Victoria has risen by 4,000 percent since 1982. With the median price of a Melbourne dwelling at $720,417, this makes buying a house a pipe dream for so many low income young people.
“Buying a house gives an individual a sense of great pride and security. Although the HomesVic scheme is currently only open to 400 applicants, it is still a good start and we will watch its progress with keen interest,” Kristin Brookfield concluded.
When we talk about rental housing in Australia, we often make comparisons with renting overseas. Faced with insecure tenancies and unaffordable home ownership, we sometimes try to envisage European-style tenancies being imported here.
And, over the past year, there has been a surge of enthusiasm for developing a sector of large-scale institutional landlords, modelled on the UK’s build-to-rent sector or “multi-family” housing in the US.
Our review of the private rental sectors of ten countries in Australasia, Europe and North America identified innovations in rental housing policies and markets Australia might try to emulate – and avoid. International comparisons also give a different perspective on aspects of Australia’s own rental housing institutions that might otherwise be taken for granted.
Not everyone in Europe rents
In nine of the ten countries we reviewed, private rental is the second-largest tenure after owner-occupation. Only in Germany do more households rent privately than own their housing. Most of the European countries we reviewed have higher rates of home ownership than Australia.
In most of the European and North American countries in our study, single people and lower-income households and apartments are heavily represented in the private rental sector. Higher-income households, families with kids, and detached houses are represented much more in owner-occupation. It’s less uneven in Australia: more houses, kids and higher-income households are in private rental.
Two key potential implications follow from this.
First, it suggests a high degree of integration between the Australian private rental and owner-occupier sectors, and that policy settings and market conditions applying to one will be transmitted readily to the other.
So, policies that give preferential treatment to owner-occupied housing will also induce purchase of housing for rental, and rental housing investor activity will directly affect prices and accessibility in the owner-occupied sector.
It also heightens the prospect of investment in both sectors falling simultaneously, with little established institutional capacity for countercyclical investment that makes necessary increases in ongoing supply.
A second implication relates to equality. Australian households of similar composition and similar incomes differ in their housing tenure – and, considering the traditional value placed on owner-occupation, this may not be by choice.
This suggests housing tenure may figure strongly in the subjective experience of inequality. It raises the question of whether housing is a primary driver of inequality, and not the outcome of difference or inequality in other aspects of life.
The rise of large corporate landlords
In almost all of the countries we reviewed, the ownership of private rental housing is dominated by individuals with relatively small holdings. Only in Sweden are housing companies the dominant type of landlord.
However, most countries also have a sector of large corporate landlords. In some countries, these landlords are very large. For example, America’s five largest corporate landlords own about 420,000 properties in total. Germany’s largest landlord, Vonovia, has more than 330,000 properties alone.
These landlords’ origins vary. Germany’s arose from massive sell-offs of municipal housing and industry-related housing in the early 2000s.
In the US, multi-family (apartment) landlords have been around for decades. And in the aftermath of the global financial crisis, they have been joined by a new sector of single-family (detached house) landlords that have rapidly acquired large portfolios from bulk purchases of foreclosed, formerly owner-occupied homes.
In these countries and elsewhere, the rise of largest corporate landlords has been controversial. Germany’s have a poor record of relations with tenants – to the extent of being the subject of popular protests in the 2000s – and their practice of characterising repairs as improvements to justify rent increases.
American housing advocates have voiced concern about “the rise of the corporate landlord” – especially in the single-family sector, where there’s some evidence that they more readily terminate tenancies.
These landlords also don’t build much housing. They are most active in renovating (for higher rents), merging with one another, and – especially in the US – developing innovative financial instruments such as “rental-backed securities”.
“Institutional landlords” are now a standing item on the Australian housing policy agenda. Considering the activities of large corporate landlords internationally, we should get specific about the sort of institutional landlords we really want, how we will get them, and how we will ensure they deliver desired housing outcomes.
Policymakers and housing advocates have, for years, looked to the community housing sector as the prime candidate for this role. They envisage its transformation into an affordable housing industry that works across the sector toward a wide range of policy outcomes in housing supply, affordability, security, social housing renewal and community development.
With interest in the prospect of build-to-rent and multifamily housing rising in the property development and finance sectors, there is a risk that affordable housing policy may be colonised by for-profit interests.
The development of a for-profit large corporate landlord sector may be desirable for greater professionalisation and efficiencies in the management of tenancies and properties. However, this should not come at the expense of a mission-oriented affordable housing industry that makes a distinctive contribution to housing outcomes.
Bringing it home
Looking at the policy settings in the ten countries, we found some surprising results and strange bedfellows.
For example, Germany – which has had a remarkably long period of stable house prices – has negative gearing provisions and tax exemptions for capital gains, much like Australia. But, in Australia, these policies are blamed for driving speculation and booming prices.
And while the UK taxes landlords more heavily than most other countries, it has the fastest-growing private rental sector of the countries we reviewed.
However, these challenging findings should not be taken to diminish the explanatory power or effectiveness of these settings in each country’s housing policy. Rather, they show the necessity of considering taxation and other policy settings in interaction with each other and in wider systemic contexts.
So, for example, Germany’s conservative housing finance practices, and regulation of rents, may mean the speculative potential of negative gearing and tax-free capital gains isn’t activated there.
Strategy in Australia for its private rental sector should join consideration of finance, taxation, supply and demand-side subsidies and regulation with the objective of making private rental housing outcomes competitive with other sectors.
Author: Chris Martin, Research Fellow, City Housing, UNSW
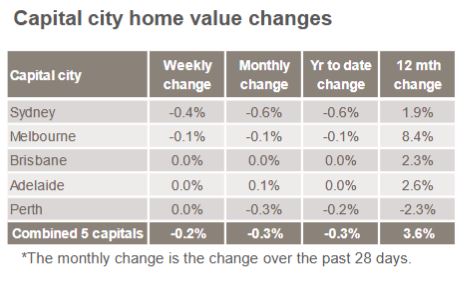
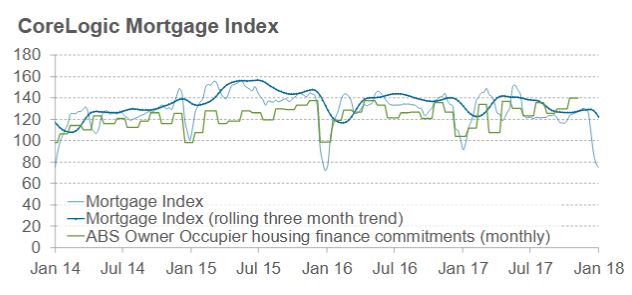
The latest weekly data from CoreLogic underscores the weakness in the property market. First prices are drifting lower.
The indicator of mortgage activity is also down, suggesting demand is easing as lending rules tighten. But then we always have a decline over the summer break.
The question is, are we seeing a temporary blip, over the holiday season, or something more structural? We think the latter is more likely, but time will tell.
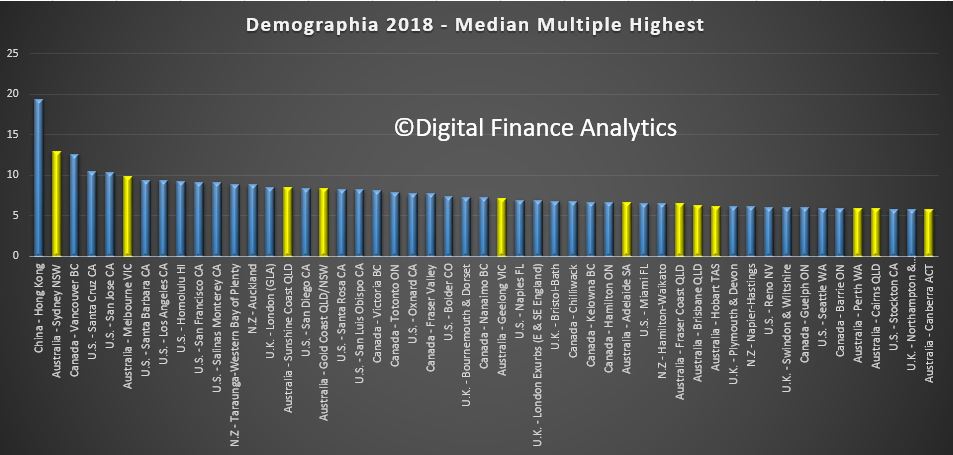
The major markets of Australia (6.6), New Zealand (8.8) and China (19.4) are severely unaffordable. By international standards houses are big in both Australia and New Zealand but relatively unaffordable.
Using a standard methodology across geographies, the study benchmarks affordability of middle income housing, using an index on average prices and incomes – formally, Median Multiple: Median house price divided by median household income.
Sydney is second worst in terms of affordability after Hong Kong, with Melbourne, Sunshine Coats, Gold Coast, Geelong, Adelaide, Brisbane, Hobart, Perth, Cains and Canberra all near the top of the list. [Click on the graphic to see it larger].
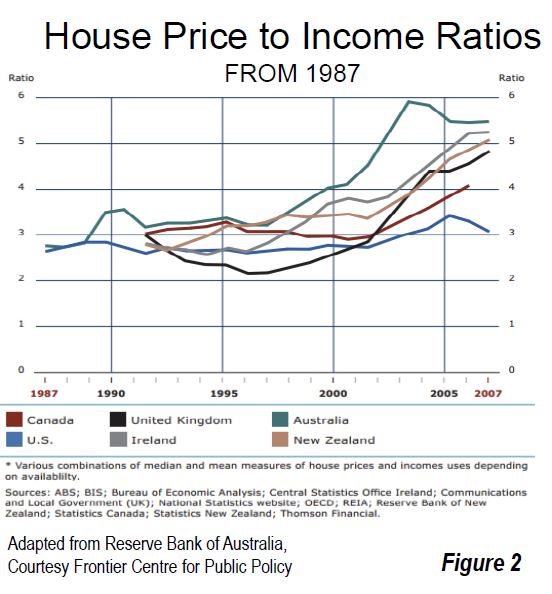
In recent decades, house prices have escalated far above household incomes in many parts of the world. In some metropolitan markets house prices have doubled, tripled or even quadrupled relative to household incomes. Typically, the housing markets rated “severely unaffordable” have more
restrictive land use policy, usually “urban containment.”
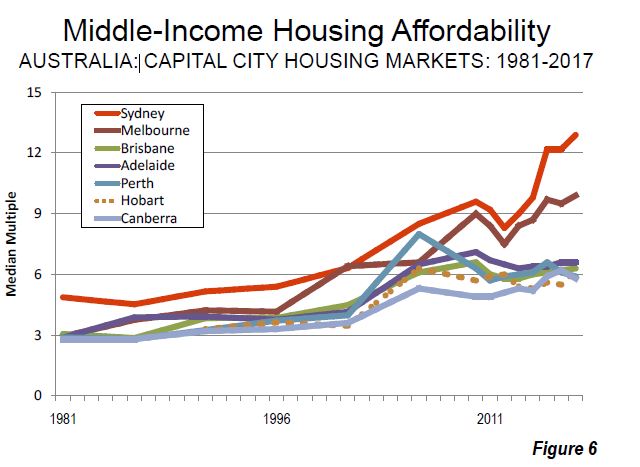
Sydney is again Australia’s least affordable market, with a Median Multiple of 12.9, and ranks second worst overall, trailing Hong Kong. Sydney’s housing affordability has worsened by the equivalent of 6.6 years in pre-tax median household income since 2001. This is a more than doubling of the Median Multiple. In contrast, Sydney’s housing affordability worsen less than one-fourth as much between 1981 and 2001.
At 12.9 Sydney’s Median Multiple is the poorest major housing affordability ever recorded by the Survey outside Hong Kong. Additionally, the UBS Global Real Estate Bubble Index rates Sydney as having the world’s fourth worst housing bubble risk (tied with Vancouver).
Melbourne has a Median Multiple of 9.9 and is the fifth least affordable major housing market internationally. Only Hong Kong, Sydney, Vancouver, and San Jose are less affordable than Melbourne. Melbourne’s Median Multiple has deteriorated from 6.3 in 2001 and under 3.0 in the early 1980s. Just since 2001, median house prices have increased the equivalent of more than three years in pre-tax median household income.
Adelaide has a severely unaffordable 6.6 Median Multiple and is the 16th least affordable of the 92 major markets. Brisbane has a Median Multiple is 6.2 and is ranked 18th least affordable, while Perth, with a Median Multiple of 5.9 is the 21st least affordable major housing market in Australia.
The report argues that:
The key to both housing affordability and an affordable standard of living is a competitive market that produces housing (including the cost of associated land) at production costs, including competitive profit margins.
None of that currently exists in Australia, with land prices sky high, linked to lack of supply (strange given the size of the country!) as well as the financialisation of property and the massive investment sector.
In contrast with well functioning housing markets, virtually all the severely unaffordable major housing markets covered in the Demographia International Housing Affordability Survey have restrictive land use regulation, overwhelmingly urban containment. A typical strategy for limiting or prohibiting new housing on the urban fringe an “urban growth boundary,” (UGB) which leads to (and is intended to lead to) an abrupt gap in land values.
Australia is perhaps the least densely populated major country in the world, but state governments there have contrived to drive land prices in major urban areas to very high levels, with the result that in that country housing in major state capitals has become severely unaffordable.
Although global equity markets are looking strong for 2018, local equities may be hurt by troughs in the domestic property market, says Tribeca Investment Partners.
According to Tribeca Investment Partners portfolio manager Sean Fenton, there is mounting evidence that the Australian housing cycle has already reached its peak, further reinforced by APRA’s efforts in curbing mortgage lending.
“A heavily indebted household sector that is experiencing flat to negative real income growth, as well as dealing with higher energy and healthcare costs, and which has drawn down its savings rate, is unlikely to fill the gap in growth,” Mr Fenton said.
“Further downside risk to the economy may emerge if the current tightening in mortgage lending standards pushes house prices lower and generates negative equity effects.”
With global markets encouraged by “easy monetary conditions”, central banks would be unwilling to make any sudden moves and lower the interest rate too quickly, “particularly as inflation has remained quiescent”.
“This provides fertile ground for equity markets to rally, but also creates an environment of heightened risk as areas of stretched valuation become more apparent,” Mr Fenton said.
Tribeca would continue to underweight sectors sensitive to the interest rate as well as increase its underweight to the building materials, retail and property development sectors.
“Domestically, we are positioned more defensively in gaming, select industrials and a small overweight to banks,” Mr Fenton added.
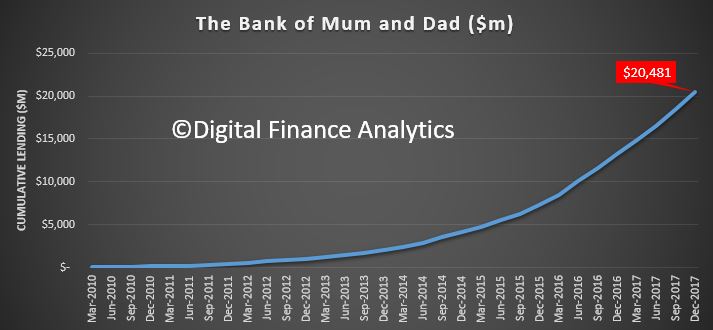
The latest Digital Finance Analytics analysis shows that the number and value of loans made to First Time Buyers by the “Bank of Mum and Dad” has increased, to a total estimated at more than $20 billion, which places it among the top 10 mortgage lenders in Australia.
We use data from our household surveys to examine how First Time Buyers are becoming ever more reliant on getting cash from parents to make up the deposit for a mortgage to facilitate a property purchase.
Savings for a deposit is very difficult, at a time when many lenders are requiring a larger deposit as loan to value rules are tightened. The rise of the important of the Bank of Mum and Dad is a response to rising home prices, against flat incomes, and the equity growth which those already in the market have enjoyed. This enables an inter-generational cash switch, which those fortunate First Time Buyers with wealthy parents can enjoy. In turn, this enables them also to gain from the more generous First Home Owner Grants which are also available. Those who do not have wealthy parents are at a significant disadvantage.
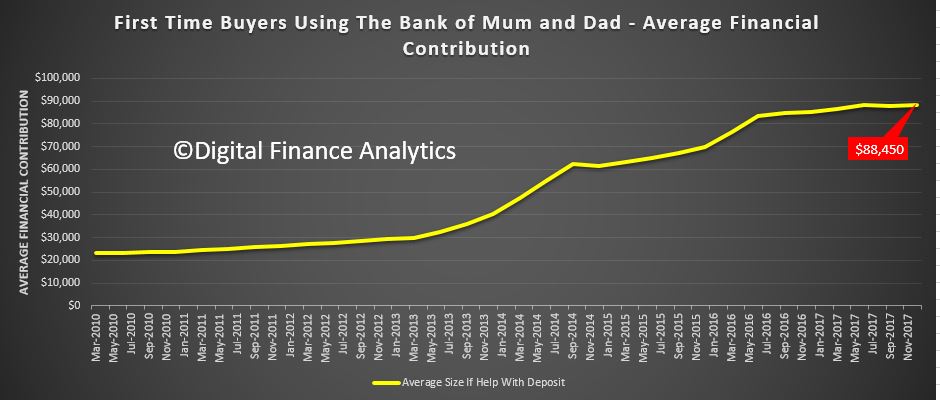
Whilst help comes in a number of ways, from a loan to a gift, or ongoing help with mortgage repayments or other expenses, where a cash injection is involved, the average is around $88,000. It does vary across the states.
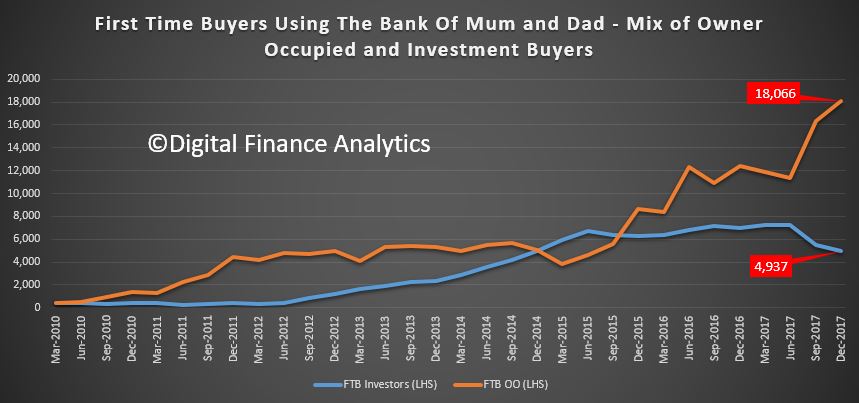
We see a spike in owner occupied First Time Buyers accessing the Bank of Mum and Dad, while the number of investor First Time Buyers has fallen away.
But overall, around 55% of First Time Buyers are getting assistance from parents, with around 23,000 in the last quarter.
There are risks attached to this strategy, for both parents and buyers, but for many it is the only way to get access to the expensive and over-valued property market at the moment. Of course if prices fall from current levels, both parents and their children will be adversely impacted in an inter-generational financial embrace.
The HIA says that stamp duty bills have increased almost three times faster than house prices since the 1980s and this trend will continue unless stamp duty is reformed. This result is contained in the latest edition of the HIA’s Stamp Duty Watch report which provides an analysis of state governments increasing reliance housing taxes.
The results also highlight just how much high property prices are helping to stoke state coffers – $20.6 billion in 2016- and the risks attached should this change! A switch to a broader property or land tax might be an option, but is politically risky. This would need to be part of broader property sector reform.
HIA Senior Economist, Shane Garrett says
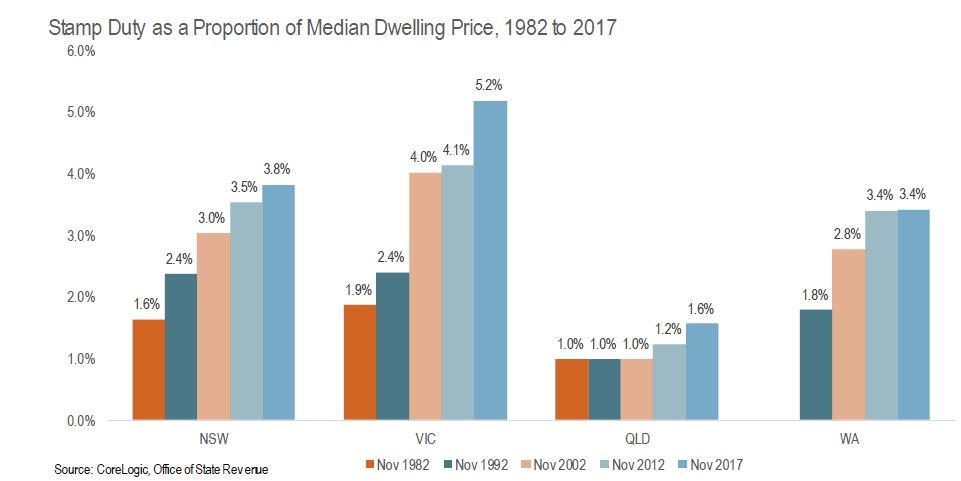
In Victoria, the typical stamp duty bill increased from 1.9 per cent to 5.2 per cent of the median dwelling price between 1982 and 2017 – equivalent to a surge of 4,000 per cent in the cash value of stamp duty. NSW homebuyers fared little better with the stamp duty burden rising from 1.6 per cent to 3.8 per cent over the same period.
Increases in home prices cause stamp duty bills to accelerate because stamp duty rate brackets are rarely updated. This is the problem of stamp duty creep.
In NSW, stamp duty rates have not been reformed since the average house price was $70,000 (1985).
State governments are compounding the housing affordability crisis. Total stamp duty revenues have almost doubled over the past four years: from $11.7 billion in 2011/12 to $20.6 billion in 2015/16 – most of which is likely to have come from residential building. State governments are now more reliant on stamp duty revenues than at any time for a decade. This trend will continue unless state governments recalibrate their taxes on housing.
State governments are increasingly reliant on rising stamp duty revenues. This situation is not sustainable.
The stamp duty burden is increasing under every metric: nominal dollars, real dollars, as a proportion of dwelling prices and as a share of total state revenue. Without reform, this trend will continue.
By draining the pockets of homebuyers to the tune of over $20 billion each year, stamp duty is a central pillar of the affordability crisis. A long plan to do away with the scourge of stamp duty would be a huge victory for housing affordability in this country.
More evidence that negative gearing should be revised was contained in a preliminary paper released recently, having been discussed with the RBA in November. Melbourne University researchers Yunho Cho, Shuyun May Li, and Lawrence Uren suggest their modelling shows that the removal of negative gearing would potentially lift homeownership rates by 5.5%, and that “renters and owner-occupiers are winners, but landlords, especially young with high earning landlords, lose”. They stress this is preliminary, but nevertheless it adds to the weight of evidence that negative gearing should be reformed. Their data also again shows how a small number of affluent landlords are benefiting disproportionately at the expense of the tax payer .
The welfare analysis suggests that eliminating negative gearing would lead to an overall welfare gain of 1.5 percent for the Australian economy in which 76 percent of households become better off.
This is significant, given the annual government expenditure
on negative gearing is estimated to be $2 billion, or 5 percent of the budget deficit for the year 2016. Eliminating negative gearing would reduce housing investments and house prices, and increase the average home ownership rate. The supply of rental properties falls, rents increase but only marginally because its demand also falls.
The data in their report also underlines the significant growth in property investors, and the consequential rise in mortgage lending and negative gearing.
The left panel in Figure 1 shows that the proportion of landlords has risen by around 50 percent over the last two decades. The right panel in Figure 1 shows that the real housing loan approvals have also increased dramatically during the same period. In particular, the loan approvals for investment purposes increased more sharply than that for owner-occupied purposes, surpassing it by around $0.5 billion in the early 2010s.
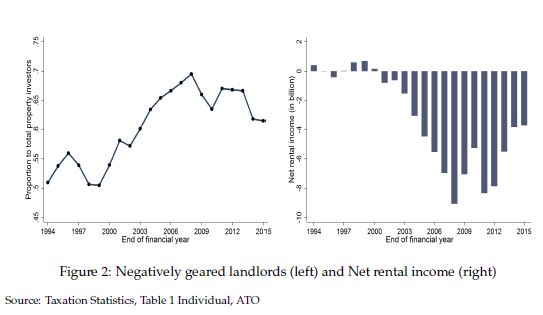
Figure 2 documents the proportion negatively geared landlords and the aggregate net rental income across the period from 1994 to 2015. The left panel in Figure 2 shows that the proportion of negatively geared landlords has increased from 50 percent in 1994 to around 60 percent in 2015. The right panel in Figure 2 shows that the aggregate net rental income became large negative from the early 2000s onwards. Evidence shown in Figures 1 and 2 suggest that Australian households increasingly participate in the residential property investment and take advantage of negative gearing, reducing tax obligations with the flow loss incurred from their housing investment.
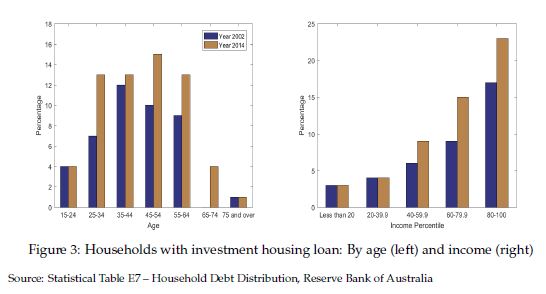
Figure 3 compares the share of households with home loans for investment by age (left panel) and income percentile (right panel) for the years 2002 and 2014. There has been a significant increase in the share, particularly among young to middle-aged households.
The largest increase was occurred in the age group 25 – 35, increased by 85 percent from 7 percent to 13 percent. From the right panel, we find that the share of households with investment housing loans has increased mainly among those in upper income percentiles.
These evidence are in line with the arguments by opponents of negative gearing that the policy essentially benefits the rich households who borrow and speculate in the property market. The fact that the distribution of housing investment loans is different across age and income also motivates our use of a heterogeneous agents incomplete markets model to study the implications of negative gearing.
Finally, of course is the important point, should interest rates rise then the value of negative gearing claimed will rise, putting a heavier burden on the Treasury, at a time when the cost of Government borrowing would be also rising. A double whammy – a multiplier effect.