Auction Results 24 June ’17

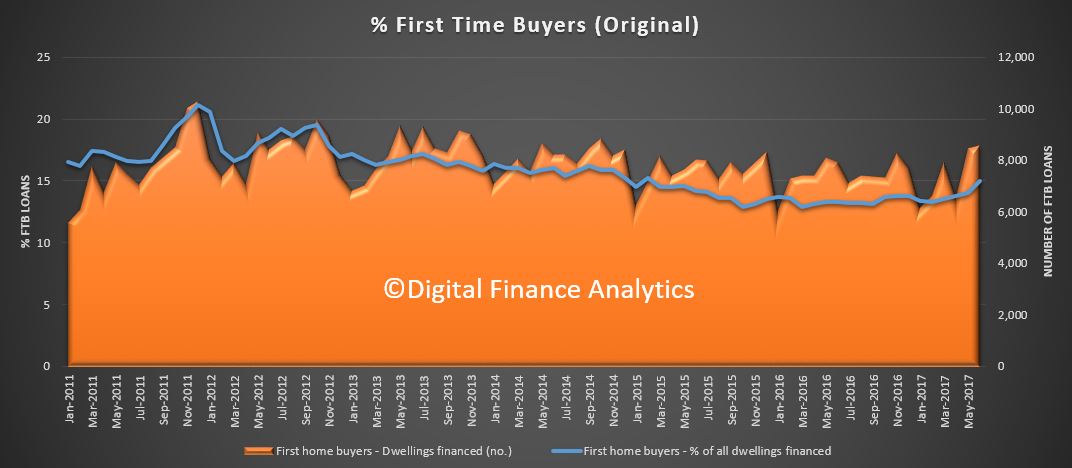
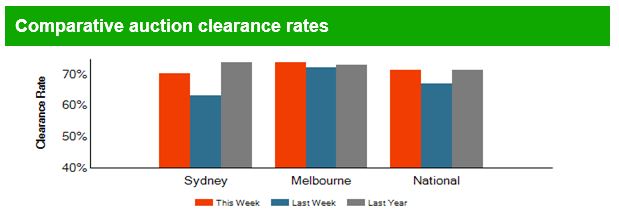
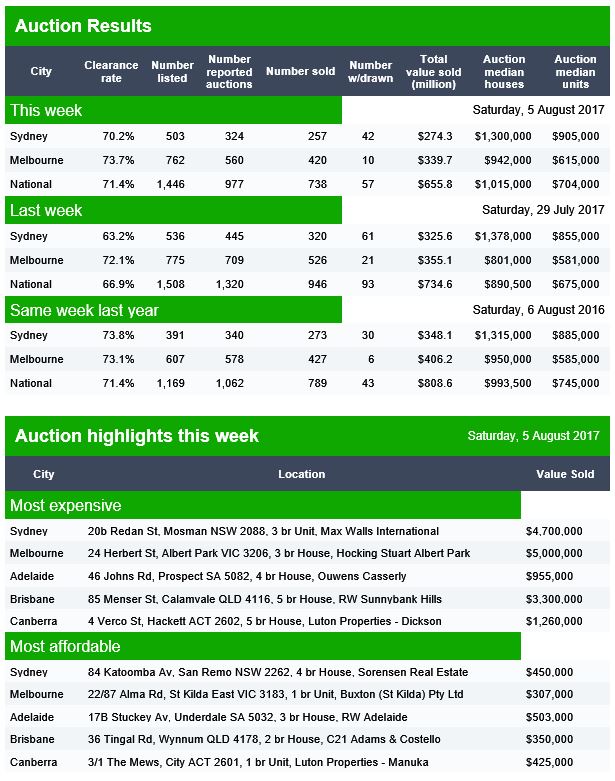
The preliminary auction results are out from Domain.  Sydney cleared 69.5% with 382 sold, compared with 464 last week and 406 last year. Melbourne sold 72.7% with 506 cleared, compared with 641 last week; so nationally, 70.3% cleared with 963 sold, compared with 66.3% last week when 1,197 sold, or last year when 65.2% cleared with 1,085 sold. So still life in the property market yet, with demand looking strong (at a time when some think first time buyers will wait for the 1 July grants and stamp duty relief).

Elsewhere Adelaide cleared 74% of 72 listed, Canberra cleared 70% of 53 listed and Brisbane cleared just 40% of 88 listed.

The Property Imperative Weekly – 24 June 2017

More pain for property investors this week, with lenders continuing to lift mortgage rates and trim maximum LVR’s. And more pain for banks as their credit ratings are trimmed, the federal bank tax becomes law; and South Australia imposes an additional levy on the big five. Welcome to the Property Imperative Weekly to 24th June 2017.

The regular pattern of mortgage interest rates hikes continued, with NAB lifting interest rates for all interest only loans by 35 basis points or 0.35%, whilst cutting principal and interest owner occupied loans by 8 basis points.  Westpac lifted interest only loans by 34 basis points reduced principal and interest loans by 8 basis points. The impact of these changes according to Macquarie will be net positive in terms of bank returns. AMP Bank also lifted investor rates by 35 basis points and reduced the maximum LVR on investor loans to 50%.

These changes are making life difficult for some property investors currently with interest only loans. Do they switch to a principal and interest alternative, thus lifting their monthly repayments, or wear the lift in rates on their current loans, thus lifting their repayments? It’s a prisoner’s dilemma. Either way, it is less likely the current rental on the property will cover the costs of the loan repayments and we know from our surveys about half of all investment properties are underwater when it comes to covering the repayment flows.

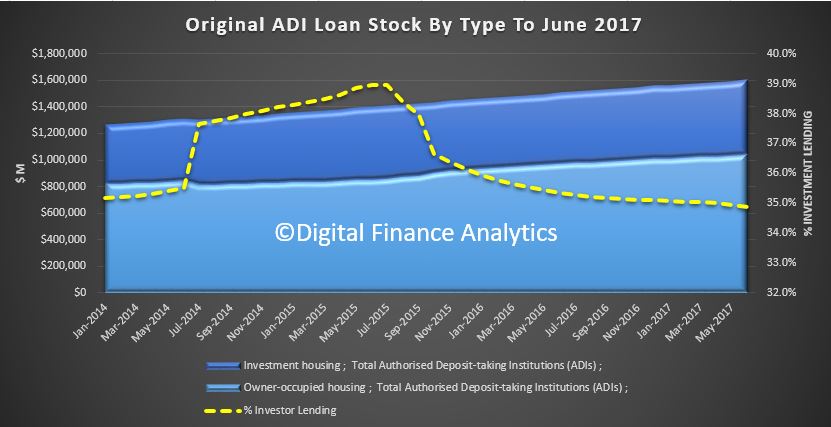
More data this week to show that some major lenders are dialling back investor loans via brokers to try and manage their portfolios to within the current APRA guidelines. This trend, which we have highlighted before, was confirmed in the AFG Competition Index.

Mortgage stress was in the news again, with surprising results from Roy Morgan’s survey which showed that from their 10,000 mortgaged household sample, in the three months to April 2017, 16.8% or 666,000 mortgage holders can be considered to be ‘at risk’ or facing some degree of stress over their repayments. This compares favourably with 18.4% or 744,000 mortgage holders 12 months ago. It is worth noting their definition of stress though – “Mortgage stress is based on the ability of home borrowers to meet the repayment guidelines currently provided by the major banks. The level of mortgage holders being currently considered ‘at risk’ is based on their ability to meet repayments on the original amount borrowed. This is currently 16.8%, which is well below the average over the last decade”.

The DFA approach to mortgage stress, which looks at total household cash flow, not the theoretical repayment profile, indicates that mortgage stress is continuing to rise as incomes are crushed in real terms, costs of living rise, underemployment stalks many, on top of a series of mortgage rate rises. Data from Canstar showed that basic variable rates jumped by almost 30 basis points as increasing number of borrowers go for fixed rate loans so trying to control these escalating mortgage costs, but of course, many fixed rates already have higher costs wired in.

We looked at the correlation between mortgage stress and bank loan losses, which we expect to rise in coming months. Indeed, the latest data from Standard and Poor’s showed that home loan delinquencies underlying Australian prime residential mortgage backed securities (RMBS) increased from 1.16% in March to 1.21% in April. They link the rise to higher mortgage rates.

But whether you take the 666,000 households from Roy Morgan, or 794,000 from DFA, both are big numbers! There are many households in mortgage pain, and all the indicators are things will get worse in the months ahead.

We expect APRA will demand the banks hold more capital, US rates were lifted by the Fed, and Moody’s downgraded the long-term credit rating of 12 banks including Australia’s big four, after pointing to surging home prices, rising household debt and sluggish wage growth. They said “elevated risks within the household sector heighten the sensitivity of Australian banks’ credit profiles to an adverse shock, notwithstanding improvements in their capital and liquidity in recent years”.

There were state budgets in NSW and SA. In NSW Stamp duty makes up a huge proportion of the State’s income, at $10 billion, with revenues jumping 10% over the past year and are expected to grow 6% each year for the next three years. From July 1 stamp duty for FHBs will be abolished for new homes up to $650,000 with discounts on properties of up to $800,000. Additionally, grants of $10,000 will be available for new homes of up to $600,000 and for FHBs who build their home. Stamp duty will no longer be charged on lenders mortgage insurance.

South Australia surprised by adding a local bank tax to the big five. They plan to charge a levy on the major banks bonds and deposits over $250,000 but will exclude mortgages and ordinary household deposits. The tax, to be introduced 1 July, is expected to raise $370 million over four years. The banks responded, including threats to pull jobs from SA, but then the banks are easy targets, and we would not be surprised if other states followed suite.

Meantime the federal bank tax was passed after a brief senate review. Now the Treasurer has announced plans to change the way eligibility for a credit card is assessed, shifting it from the ability to pay the minimum repayment to being able “to repay the credit limit within a reasonable period”.

Australians’ wealth is overwhelmingly in our housing. Our housing stock worth valued at $6.6 trillion. That’s nearly double the combined value of ASX capitalisation and superannuation funds.

Housing is strongly linked to financial stability as highlighted in excellent speech by Fed Vice Chairman Stanley Fischer. He said there was a strong link between financial crises and difficulties in the real estate sector. In addition to its role in financial stability, or instability, housing is also a sector that draws on and faces heavy government intervention, even in economies that generally rely on market mechanisms.

Australian Housing and Urban Research Institute (AHURI) published a report this week on housing policies across the nation. They argue, rightly, that Australia needs a federal minister for housing, a dedicated housing portfolio, and an agency responsible for conceptualising and co-ordinating policy. The current fragmented, ad-hoc approach to housing policy seems poorly matched to the scale of the housing sector and its importance to Australia.  There is no clear systematic policy framework for housing across the nation, just piecemeal bits of policy, which are not fit for purpose.

Finally, the ABS released their residential property price data to March 2017. They said overall, prices rose on average 2.2% in the quarter. The price rises in Sydney (3.0 per cent) and Melbourne (3.1 per cent) were partially offset by falls in Perth (1.0 per cent) and Darwin (0.9 per cent).

Through the year growth in residential property prices reached 10.2 per cent in the March quarter. Sydney recorded the largest through the year growth of all capital cities at 14.4 per cent, followed closely by Melbourne at 13.4 per cent.

This ongoing rise may go counter to some recent data, although we note the CoreLogic data this week also shows rises in most centres, after recent softer data. The next ABS series, due out in 3 months will be the one to watch.  Auction clearances last weekend were quite strong, if on lower volumes, so as yet, signs of a real slow-down remain muted.

And that’s it for this week. Check back next week for the next installment.

Not in their interest: The home loan borrowers that have been left out to dry

From The SMH.

There is a hidden and worrying risk lurking for a particular set of mortgage borrowers, whose level of financial stress is about to get a whole lot worse.

It’s those home owners with interest-only loans that are now increasingly under the pump – with National Australia Bank the latest of the big four to announce big hikes in rates on these types of loans.

While banks, the media and the government regularly characterise those that have interest-only loans as wealthy property investors, the fact is that there are many owner-occupiers that have used this method to finance the family home.

Ironically, regulators have pushed the banks to reduce interest-only lending to improve the overall risk of consumers’ debt to the financial system. But for those investors with interest-only loans, the chances of being unable to service them creates a new and unintended risk.

These hikes have not attracted the ire of the government, which has put the banks on notice that any move to increase mortgage rates will be intensely scrutinised. Again, because it is not seen as hitting the political heartland of the average voter with a mortgage to finance their own home.

But these borrowers are particularly vulnerable because many of them took out their interest-only loans because they didn’t have enough cash flow to repay interest and principal.

The banks have been under regulatory pressure to herd these interest-only borrowers into interest and principal loans – offering little or no fees to change over to principals, and interest rates that are now around 0.6 per cent lower.

The catch though is that monthly repayments will be higher in most cases because the borrower also needs to repay principal.

Those that can afford to switch will do so, but there will be many that will need to remain on interest-only and have to wear the rate increase.

For owner-occupiers who have an interest and principal loan, interest rates have not fallen by much in this latest round of adjustments.

National Australia Bank and Westpac customers will see their rate fall by 0.08 per cent while ANZ customers will benefit to the tune of 0.05 per cent.

It is better than nothing, but won’t have a really meaningful impact to the weekly household budget.

For banks, the positive effect of the far bigger increases on interest-only loans will significantly outweigh the negative impact of the small fall in rates on interest and principal loans.

Indeed Westpac – which has a higher proportion of interest-only loans than the others – could boost its earnings by 3.5 per cent, according to research from Macquarie. This is calculated on the basis of all other things being equal.

But Macquarie takes the view that this earnings benefit will be eroded to some degree by some customers switching to interest and principal loans – the caveat being if they can afford it.

Martin North from industry consultant Digital Finance Analytics believes that some investor/borrowers that have interest-only loans would have less incentive to switch because the tax effectiveness of this type of borrowing could be negatively affected.

Young families, investors most at risk

The bottom line is that regardless of the kind of borrower, the overall effect of this latest round of interest rate resets will be to improve bank earnings, because in aggregate borrowers will pay more.

North said the two segments most at risk for mortgage stress are younger families that are more typically first home owners that pushed their finances to get into the property market over the past couple of years and at the other end of the spectrum a more affluent group that took advantage of the rising property market and low interest rates to buy one or more investment properties.

Both North and analysts at Macquarie warn that the flow-on effects from increased rate rises even on just interest -only loans, and the potential for some to switch to interest and principal, could be damaging for the wider economy.

“The increase to IO (interest-only) loans combined with the increased likelihood of customers switching to P&I (principal and interest), in our view, will ultimately lead to further reductions in disposable incomes and put even greater pressure on highly indebted households. We estimate that a 50 basis point increase in interest rates has a 4 to 10 per cent impact on disposable income of highly indebted households.

“While it would rationally make sense for many households (particularly for owner-occupiers) to switch to P&I, …. many of these households would not have capacity to do this,’ Macquarie said in a note to clients this week.

‘Deadly combination’

In analysing the reasons for an increased level of stressed households, North noted that “the main drivers are rising mortgage rates and living costs whilst real incomes continue to fall and underemployment is on the rise. This is a deadly combination and is touching households across the country, not just in the mortgage belts.’

Against this, the incentive for banks to massage rates higher is greater than ever, given they have been hit by the Federal Government’s bank levy and this week by an additional tax from the South Australian government that many fear could be adopted by other states down the track.

On the other side of the household ledger, the lack of any real growth in wages is only exacerbating the squeeze.

A report from Cit this week that analyses the industry segments in which jobs are growing provides insight into the problem.

“Not only does Australia have an underemployment problem that has been highlighted by the monthly labour force series, but the quarterly data shows that the economy is creating mostly jobs that are below average in terms of earnings,” it said.

The shift to solitary living is massively inflating property prices

From The New Daily.

Australians increasingly choose to live alone, and this huge demographic shift is going to push up prices and sprawl our cities further into the fringe unless we accept higher density living.

According to the Victorian government, by 2025 up to 51 per cent of Melbourne households will be ‘no child households’.

‘No child households’ are those that are pre-child, post-child or have no intention of ever having children.

The numbers are similar for all of Australia’s major cities, although slightly lower in Sydney as it attracts a slightly higher percentage of families.

Worst still, the fastest growing segment of the Australian housing market is the single person household. Single person households may reach 44 per cent of all major city households by 2035.

What does this mean for communities and for housing prices?

According to the Grattan Institute, 84 per cent of Melbourne’s housing stock is made up of detached or semi-detached family homes. Only 16 per cent of the housing stock is aimed at non-family residences.

By 2025, 51 per cent of our population could be in non-family units with only 16 per cent of our housing stock aimed at this demographic.

There will be a shortage of non-family medium and higher density living with people forced to bid for family homes leaving bedrooms empty. Fewer people will live in each housing unit, putting massive upward pressure on housing prices.

As the average number of people per household shrinks we will need more residences for the same amount of population. If we do not radically increase density then these new houses will continue to be built on our urban-fringed farm land.

It is not just me calling for a re-think on planning demographics. Reserve Bank governor Philip Lowe, speaking in Brisbane earlier this year, identified “the choices we have made as a society regarding where and how we live … urban planning and transport” as significant impacting factors on property prices.

Property, like all markets, is impacted by changes to both supply and demand. While demand can be impacted by a range of economic factors, supply is restricted by planning rules and the availability of land, as well as economic factors.

Some people think all will be okay with housing supply as they think Australia’s housing density has increased. But this is not true. Whilst the last decade has seen an uptick in density, a longer-term view tells a very different story.

Inner city suburbs, prior to ‘gentrification’, used to house one, two and sometimes three families per house. Now days the inner city houses often have just one, two or three people.

Melbourne, for example, has seen a huge drop in its density from 20.3 people per hectare in 1960 to around 14.9 people per hectare today.

This change in demographics means that, even if our population stays the same, our cities don’t grow ‘up’ then they must grow ‘out’.

This decreasing density is eating up farmland on the urban fringe and putting huge strain on infrastructure spending as the cost per person per kilometre of infrastructure sky rockets.

It is dangerous and will continue even if the population remained exactly the same – let alone if we continue to grow our it.

As single person households age and get ill, will we see more horror stories of people falling ill or dying at home and remaining undiscovered for days or weeks as ‘friends’ wonder why they have not been online?

With decreasing family sizes, growing numbers of childless households and growing numbers of single person households, our housing supply is becoming more out of sync with our housing demand.

The result will be increased pressure on housing prices.

Risk Mounts for Canada Housing, but Don’t Expect U.S. Crisis Redux

Unsustainable home prices and record high household leverage render the Toronto and Vancouver housing markets increasingly vulnerable to a steep price correction, though key structural features will safeguard Canada from repeating the U.S. housing crisis, according to Fitch Ratings in a new report.

Home prices in Toronto and Vancouver are up 45% and 36%, respectively, since January 2015 through May of this year. Additionally, household debt to disposable income remains elevated at 167% in 1Q17, the highest amongst G7 sovereigns.

Mortgage-market reforms are also increasing the focus on a private label RMBS market in Canada. This will inevitably draw comparisons by some in the market to the U.S. RMBS market and the influential role it played in the U.S. housing crisis a decade ago. “However, Canada is unlikely to mirror the declines and fallout experienced during the U.S. housing crisis due to major differences in the housing and mortgage finance systems,” said Fitch Director Kate Lin.

“Canadian banks are subject to rigorous oversight and regulations requiring prudent mortgage lending and underwriting standards,” added Lin. “What’s more, credit quality for Canadian mortgage loans remains strong unlike the drift towards weak borrower and loan quality that we saw a decade ago in the U.S.” Further, nonprime credit quality originations in Canada are low, making up approximately 10% of volume compared to 50% in the U.S. during the peak. The Canadian government has also been proactive in managing the risk of the nation’s housing market by taking unprecedented steps to tighten credit and limit speculation.

$6.8bn stamp duty bonanza – at the expense of FHBs

From Mortgage Professional Australia.

Huge NSW revenues from stamp duty have lifted state out of debt but prospective homebuyers are suffering

The New South Wales State Government received $6.8bn from stamp duties on residential property over the past year, the State’s 2017-18 Budget has revealed.

The NSW State Government is now free of debt, with a $4.5bn surplus expected for 2016-17 and a surplus of $2.0bn expected next year. Stamp duty makes up a huge proportion of the State’s income, with revenues jumping 10% over the past year and expected to grow 6% each year for the next three years.

As the State Government grows richer, NSW’s first home buyers are struggling. In a CoreLogic survey of Australians of all ages, 48% of those in NSW said stamp duty was the most significant obstacle to housing affordability. Three-quarters of respondents felt that removing or reducing stamp duty would be an effective way to improve housing affordability in New South Wales.

CoreLogic found that the average household in Sydney would take 1.7 years of no spending whatsoever to save a 20% deposit. Getting on the housing ladder in Sydney was far more expensive than any other city, including Melbourne.

Stamp duty concessions

Perhaps buoyed by its new found wealth, NSW is finally following the lead of other states such as Victoria by expanding stamp duty concessions.

From July 1 stamp duty for FHBs will be abolished for new homes up to $650,000 with discounts on properties of up to $800,000. Additionally, grants of $10,000 will be available for new homes of up to $600,000 and for FHBs who build their home. Stamp duty will no longer be charged on lenders mortgage insurance.

Over the past twelve months, 45.4% of dwellings sold across New South Wales had a price tag of $650,000 or less, notes CoreLogic director of research Tim Lawless. However, in the Sydney metropolitan area, just 25.8% of dwelling sales were at a price of $650,000 or less.

The State’s stamp duty concessions may push Sydney FHBs towards units, given 33.5% of units sold in the last 12 months went for under $650,000. On a $650,000 dwelling purchase, a FHB will save $25,000 by not paying stamp duty.

According to Lawless, “we can expect first home buyer sales to stall over the remainder of June and likely surge higher from the beginning of the new financial year.”

Mortgage Growth In Adelaide and Hobart

We finish our series on mortgage growth by looking at data from Adelaide and Hobart and plotting the relative change in volumes of loans between 2015 and 2017, by post code, drawing data from our core market models, and geo-mapping the results.

Here is Adelaide.

Here is Hobart.

The yellow shades show the areas with the largest growth in the number of mortgages, the red shades show a relative fall in volumes. You can click on the map to view full screen. This is a picture of mortgage counts, not value, we may look at this later.

Compare these pictures with those for Sydney, Melbourne, Brisbane and Perth and we see just how different these markets are!

Of course this is just one of the many potential views available from the 140+ fields which are contained in our Core Market Model.

Who’s responsible? Housing policy mismatched to our $6 trillion asset

From The Conversation.

Does the Australian government have the policy, organisational and conceptual capacity to handle the country’s A$6 trillion housing stock? We ask this question in a newly released research report. The answer is critically important to both household opportunity and prosperity, and to the management of our largest national asset.

Australians’ wealth is overwhelmingly in our housing. As of late 2016, our housing stock was valued at $6 trillion. That’s nearly double the combined value of ASX capitalisation and superannuation funds.

Clearly, the way the housing sector is managed has huge implications for household prosperity and opportunity. The public debate about high house prices, for example, reveals a gnawing anxiety that the distribution of housing as an asset has shifted too far in favour of a growing class of rentiers rather than households.

Housing also has clear national economic implications. This relates both to its scale as an asset, and to the way it provides shelter for those most in need where that need is clear.

Any misallocation of housing to low-productivity uses is potentially a major drag on the economy. This necessarily requires a wide understanding of productivity.

How is Australian housing policy framed?

We asked whether there is a clear systematic policy framework through which the Australian government understands the dynamics of the housing system and its contribution to productivity. We might expect such a framework to be clear and prominent given recent public and policy attention to housing questions.

To better understand the Commonwealth’s approach, we surveyed recent major housing policy reviews by the government. We assessed how housing was conceived in terms of its economic and social dynamics, its influence on productivity, and the role of policy in shaping these effects.

There is no shortage of documentation to appraise. Our sample included the Henry Review of Taxation (2010), the National Housing Supply Council report series (2009-2013), the Productivity Commission inquiry into planning (2011), the COAG Report on Housing Supply and Affordability Reform (2012), the Financial System Inquiry (2014), the Federation Report on housing and homelessness (2014), and (albeit not a government report) the Senate Inquiry into housing affordability (2015).

We also prepared an inventory of housing policy instruments operated by governments in Australia to understand how these were conceived within the policy reviews. We found 13 policy instruments that influence housing systems. These operate across housing, economic and fiscal policy and at multiple tiers of government.

A picture of incoherent policymaking

We were surprised to discover that few of the major policy reviews provided a systematic framework for understanding the economic role of housing.

There is thin evidence, at best, that these inquiries constructed or articulated a systematic conceptual understanding of the links between the housing system and economic productivity.

Even the Productivity Commission’s inquiry into planning and zoning, which focused on housing affordability, did not offer a conceptual framework for understanding the influence of planning regulaton on urban or national productivity.

Our review of these documents further shows there is no coherent framework articulating how policy objectives link to instruments and their effects. Housing policy, despite the $6 trillion value of housing, seems strangely incoherent. Australia doesn’t currently have a minister for housing.

The debate over negative gearing during 2015 and 2016 partly demonstrates our contention. During this period we counted at least six reports by non-government organisations articulating a view on the purpose and effect of negative gearing. Nowhere could we identify a government policy document articulating a clear, extended and analytically based position on this policy explaining its purpose and effects.

Our search for an explanation of these gaps in policy was not exhaustive. But we did assess the current administrative orders for housing within the Australian government.

Responsibility for understanding housing issues is divided. The Department of Social Services is responsible for social housing, rent assistance and home ownership. The Treasury has responsibility for housing supply policy.

Elsewhere, the Reserve Bank deals with monetary policy and financial stability. The Australian Prudential Regulation Authority APRA manages macroprudential policy. And the Tax Office (ATO) administers tax concessions. The Productivity Commission offers occasional advice on housing.

Yet there appears to be no obvious co-ordinating point in government that oversees housing. No one authority is responsible for formulating a coherent systematic understanding of housing and its effects on productivity and Australia’s economy or society generally. The National Housing Supply Council established in 2009 partly filled this role, but was abolished in 2013.

Further dispersion appears via COAG, which is convened by the Commonwealth government. COAG periodically marks out a housing issue, such as land supply, for discussion with state governments and to formulate policy recommendations. But COAG communiques are typically short political statements and not analytically founded.

Within state governments, responsibilities for different aspects of housing are typically spread across several agencies.

What needs to be done?

Our report demonstrates weaknesses in Australia’s approach to housing and housing policymaking. There is evidence this is deliberate. For example, the Coalition members’ minority response to the 2015 Senate inquiry into affordable housing rejected almost all of its policy recommendations. Many of these would rectify some of the deficits we have identified.

The weak formal coordination in housing policy contrasts with other sectors such as energy, defence, biosecurity, disability, heritage, drugs and road safety, among others. Each has a dedicated national strategy articulating policy objectives, problem conceptualisation and coordination of policy instruments.

It is doubtful that housing is less significant to the nation, economically or socially, than these sectors.

We recommend that the Australian government reflects on the position of housing within the architecture of government. The $6 trillion national asset that housing represents deserves much better understanding of its dynamics and effects on the national economy, including productivity.

We argue that Australia needs a federal minister for housing, a dedicated housing portfolio, and an agency responsible for conceptualising and co-ordinating policy. The current fragmented, ad-hoc approach to housing policy seems poorly matched to the scale of the housing sector and its importance to Australia.

Authors: Jago Dodson, Professor of Urban Policy and Director, Centre for Urban Research, RMIT University; Sarah Sinclair, Lecturer in Economics, RMIT University; Tony Dalton, Emeritus Professor, Centre for Urban Research, RMIT University

Mortgage Growth In Greater Perth

We continue our series on mortgage growth plotting the relative change in volumes of loans between 2015 and 2017, by post code, drawing data from our core market models, and geo-mapping the results.

Here is the Greater Perth picture.

The yellow shades show the areas with the largest growth in the number of mortgages, the red shades show a relative fall in volumes. You can click on the map to view full screen. This is a picture of mortgage counts, not value, we may look at this later.

Of course this is just one of the many potential views available from the 140+ fields which are contained in our Core Market Model.

Next time we will look at Adelaide and Hobart.

Fraudsters target brokers in Sydney hotspots

From The Adviser.

Incidents of fraud through the broker channel are skyrocketing, according to Equifax, which has now revealed the top suburbs where fraud is most prevalent.

Speaking at the Pepper Money Insights Roadshow in Sydney yesterday, Equifax BDM Steve Arsinoski shared data from the Veda shared fraud database, highlighting a 33 per cent year-on-year (YOY) increase in fraud. Identity theft is the fastest growing type of fraud, with an 80 per cent YOY increase.

“Thirteen per cent of frauds reported were targeting home loans and there has been a 25 per cent year-on-year increase in frauds originating from the broker channel,” Mr Arsinoski said.

“What we have noticed is that fraud through the broker channel is increasing, and that may be because fraudsters are becoming more sophisticated in the way they are applying for certain products. With the technology they have available they can fabricate certain documentation,” he said.

Equifax data found that 27 per cent of all mortgage fraud cases involved falsifying personal details.

While online is the preferred channel for fraudsters (57 per cent), 15 per cent of fraud cases are coming through the broker channel and 13 per cent through branches.

“Branch channel fraud is around 13 per cent, which showed signs of slowing down in 2015 but there has been a resurgence. We are finding branch fraud is continuing to increase,” Mr Arsinoski said.

“Broker fraud is sitting at 15 per cent. It is not drastically higher than branch fraud, but what is alarming is that we are seeing that 25 per cent growth form the previous year,” he said.

Over 72 per cent of all fraud cases are occurring in the Greater Sydney and Melbourne areas. Mr Arsinoski highlighted that Paramatta, in Sydney’s west, was a particular hotspot.

However, the fastest growing areas for fraud in Australia, with a 130 per cent increase in incidents over the second half of 2016, were Newcastle and Lake Macquarie.

Richmond, in Sydney’s north-west, recorded a 127 per cent surge in incidents over the half, while Baulkham Hills and the Hawkesbury region saw a 111 per cent increase.

Illawarra, Brisbane Inner City, the Sunshine Coast and Geelong were also named as fraud hotspots.

The four main types of mortgage fraud are falsifying personal details (71 per cent), identity takeover (19 per cent), fabricated identity (4 per cent) and undisclosed debt/serviceability fraud (4 per cent).

Mr Arsinoski urged brokers to report fraud as early as possible and suggested how it can be identified.

“If you could find or pickup fraud early on and identify any discrepancies, raise them earlier rather than letting the loan application go through. If the lender finds some inconsistencies and reports it to the originator, this is going to be a massive waste of your time and effect your commissions,” he said.

“The biggest impact on a broker is the loss of credibility. I’ve spoken to many brokers and they say reputation and their brand are the most important things in being able to generate leads and referrals.”

How brokers can combat fraud:

  • Ask questions to uncover fraudsters. The face-to-face interview is the best time to get to know your customer and do a thorough needs analysis. It is also the perfect opportunity to find holes in their story. Use your intuition.
  • Validate information via internet searches
  • Ask the borrower to identify any C-level executives at the organisation they say they work for
  • Get consent to record the interview
  • Look out for an unencumbered property offered as security.
  • Ask for original payslips or bank statements, or have the client download them in front of you.
  • Use ZipID for identity verification