The latest data suggests mortgage delinquencies are rising, as the number of mortgaged households increase. Yet the RBA is bullish about future growth prospects, despite anemic retail spending, a stronger dollar and home lending reaching another new record. So what’s going on?
 Welcome to the latest Property Imperative weekly to 5th August 2017.
We released our mortgage stress and default modelling for Australian mortgage borrowers, to the end July 2017. Across the nation, we estimate more than 820,000 households are now in mortgage stress (compared with last month 810,000) with 20,000 of these in severe stress. This equates to more than a quarter of borrowing households. We also estimate that nearly 53,000 households risk default in the next 12 months.

We have been tracking the number of households in stress each month since 2000, and since a small easing in February 2016, the number under pressure has been rising each month. The RBA cash rate cuts provided some relief, especially directly after the GFC, but now mortgage rates appear to be more disconnected from the cash rate as banks seek to rebuild their margins.
There were more mortgage rate changes this week, with Virgin Money increasing the standard variable rates for owner occupied and investment interest only loans for new and existing customers and also increasing the fixed interest only rates for both owner occupied and investment loans. The increases ranged from 15 basis points, or 0.15%, up to 50 basis points for a 3 year lower LVR owner occupied fixed loan.
Teachers Mutual Bank increased the interest only variable rate by 20 basis points to 5.66% p.a. Interest only rates for the Solution Plus Home Loan rose by between 30 and 50 basis points depending on the LVR. Rates span between 4.49% p.a. and 4.67% p.a. They decrease rates for the principal & interest Home Loan by 15 basis points to 4.39% p.a for those borrowing between $240,000 and $499,999 where the LVR is greater than 80% and less than or equal to 90%.
CBA doubled the waiting period for customers seeking to switch to an interest-only repayment loan from 90 days to 180 days. This is a further move to try to reduce the proportion of IO loans held, following regulatory pressure to meet the 30% limit. CBA has already lifted interest rates, tightened lending criteria and throttled back applications via mortgage brokers.
Once again we see a differential shift, with interest only loan rates being lifted, whilst rates on some owner occupied principal and interest loans below specific LVR’s and value are reduced. This underlines the current behaviour where specific types of “low risk” borrowers are being recognised. Expect more of the same from other market participants.
A new report by the Australian Housing and Urban Research Institute (AHURI) revealed than an estimated 1.3 million households – around 14% of Australian households – are in housing need, whether unable to access market housing or in a position of rental stress. This figure is predicted to rise to 1.7 million by 2025. This includes 373,000 households in New South Wales, where the number is expected to increase by 80% to more than 670,000 by 2025.
The newly released Household, Income and Labour Dynamics in Australia (HILDA) data showed that home ownership among 18 to 39-year-olds has fallen from 36 per cent in 2002 to a new low of 25 per cent. On top of that, between 2002 to 2014, the average mortgage debt of young homeowners increased by 99 per cent in real terms, from $169,000 to $337,000. In fact, the decline in home ownership has been greater than the decline in owner-occupied households. This is largely because adult children are living with their parents for longer.
More broadly, HILDA also highlighted growing inequality, something which we have been discussing for some time. It is parents passing wealth down to their children that are once again starting to define who gets into property and who doesn’t – we’re going back to a 1950s-style class division. Our research suggests the average hand-down from the Bank of Mum and Dad is more than $85,000. This rising inequality was also confirmed by the latest ME Bank Survey. They say the overwhelming majority of Australian households (68 per cent) saw their incomes stagnate or fall. Only 32 per cent got pay rises – the lowest in three years.

There are other barriers to property purchase. Data from the HIA suggested that the average stamp duty bill paid by an Australian owner-occupier increased by 16.4% to $20,725 over the past 12 months. And that’s nationally with the average cost in Sydney and Melbourne — Australia’s most expensive housing markets where just under 40% of Australia’s population live — substantially higher at $29,105 and $26,870 respectively. The median dwelling prices in both those cities has more than doubled since the start of 2009, according to CoreLogic. The HIA says recent changes to stamp duty in NSW mean that foreign investors now pay almost $100,000 in transaction taxes to acquire a standard apartment in Sydney – almost four times as much as local buyers.
Fitch Ratings says Australia’s mortgage arrears increased by 12bp QoQ to 1.21% at end-1Q17, due to seasonal Christmas/holiday spending and possible difficulties faced by consumers because of low real-wage growth.
Suncorp, underwhelmed the market with their FY17 annual results. Their housing portfolio now sits at $44.8 billion (up from $44.27 billion in 2016), with 66 per cent coming from the “Brokers”. The results were helped by overall lower provisions and the repricing of mortgages, but despite this, bank NIM fell. Past due home loans rose from 0.79% last year to 0.85% in FY17, and they have significant portfolio concentrations in QLD and WA.
Genworth, the listed Lenders Mortgage Insurer (LMI) released their 1H17 results, and as a bellwether for the mortgage industry, we see continued pressure on mortgage defaults, up 5 basis point, to in WA 0.86% and QLD 0.72%, and a fall in higher LVR lending leading to lower volumes of new premiums being written, but at higher prices. The average original LVR of new flow business written in 1H17 was 82%.
The latest credit aggregates from the RBA to June 2017 shows continued home lending growth, up 0.5% in the month, or 6.6% annually. Business lending rose 0.9%, or 4.4% annually, and personal credit fell 0.1% or down 4.4% over the past year. However, they changed the seasonally adjusted assumptions, so it is hard to read the true picture, especially when we still have significant reclassification going on. The net value of switching of loan purpose from investor to owner-occupier is estimated to have been $55 billion over the period of July 2015 to June 2017, of which $1.3 billion occurred in June 2017.
In original terms housing loans grew to $1.69 trillion, another record. Investor home lending grew 0.5% or $3.13 billion, but this was adjusted down in the seasonal adjusted series to 0.2% or $1.13 billion. Owner occupied lending rose 0.9% or $9.83 billion in original terms, or 0.7% or $7.34 billion in adjusted terms.
APRA’s latest monthly banking statistics for July 2017 reconfirms that growth in the mortgage books of the banks is still growing too fast. The value of their mortgage books rose 0.63% in the month to $1.57 trillion. Within that, owner occupied loans rose 0.73% to $1,017 billion whilst investor loans rose 0.44% to $522 billion. Investor loans were 35.18% of the portfolio. The monthly growth rates continue to accelerate, with both owner occupied and investor loans growing (despite the weak regulatory intervention). On an annual basis, owner occupied loans are 6.9% higher than a year ago, and investor loans 4.8% higher. Both well above inflation and income growth, so household debt looks to rise further. The remarkable relative inaction by the regulators remains a mystery to me given these numbers. Whilst they jawbone about the risks of high household debt, they are not acting to control this growth, do not seem worried.
Indeed, the latest RBA Statement on Monetary Policy released today appears to be very upbeat. Despite forecasting growth down a bit in the near term, they are still holding the view of growth of 3% plus later, supported by and improving international economic outlook, a rise in business investment, strong exports and low unemployment. If this is correct, then it seems to me conditions would be right to lift the cash rate towards the neutral position (which as we saw recently they hold to be 2% higher than current levels). That said, many economic commentators think the RBA is overly bullish, given high household debt, flat income growth, and risks in the property market.
Within the statement they acknowledge that slow real wage growth is likely to weigh on consumption, especially if households expect the slow growth to continue for some time and ongoing expectations for low real wage growth remain a key downside risk for household spending. The recent sharp increase in the relative price of utilities poses a further downside risk to the non-energy part of household consumption to the extent that households find it hard to reduce their energy consumption; this is likely to have a larger effect on the consumption decisions of lower-income households.
They also make the point that some households may also feel constrained from spending more from of their current incomes because of elevated levels of household debt. This effect would become more prominent if housing prices and other housing market conditions were to weaken significantly. Household debt is likely to remain elevated for some time: housing credit growth overall has been steady over the past six months, but has continued to outpace income growth.
That said, the composition of that debt is changing, as lenders respond to regulators’ recent measures to contain risks in the mortgage market. Investor credit growth has moderated and loan approvals data suggest this will continue in coming months. Also, new interest-only lending has declined recently in response to the higher interest rates now applying to these loans and other actions by the banks to tighten lending standards.
They held the cash rate again on Tuesday, and said rent increases remain low in most cities, but Investors in residential property are facing higher interest rates. There has also been some tightening of credit conditions following recent supervisory measures to address the risks associated with high and rising levels of household indebtedness. Growth in housing debt has been outpacing the slow growth in household incomes.
The latest Australian Bureau of Statistics (ABS) Retail Trade figures showed that the trend estimate for Australian retail turnover rose 0.4 per cent in June 2017 the same rate as in May. Compared to June 2016, the trend estimate rose 3.6 per cent. The trend by state shows Tasmania and ACT ahead of the average, with Western Australian and NT, continuing to trail.
So standing back, we have a mixed picture, but one where household debt is still rising, income remains under stress, and costs rising. As a result, we think the drag on growth is stronger than the RBA suggest. Pressure on budgets will constrain spending. But, here’s the thing, if they are right, we should expect cash rate rises sooner, adding more pressure on household budgets. Looks like its heads you lose, tails they win – borrowing households will remain under the gun for some time to come, and the property market is at the centre of the storm.
And that’s the property imperative weekly to August 5th 2017
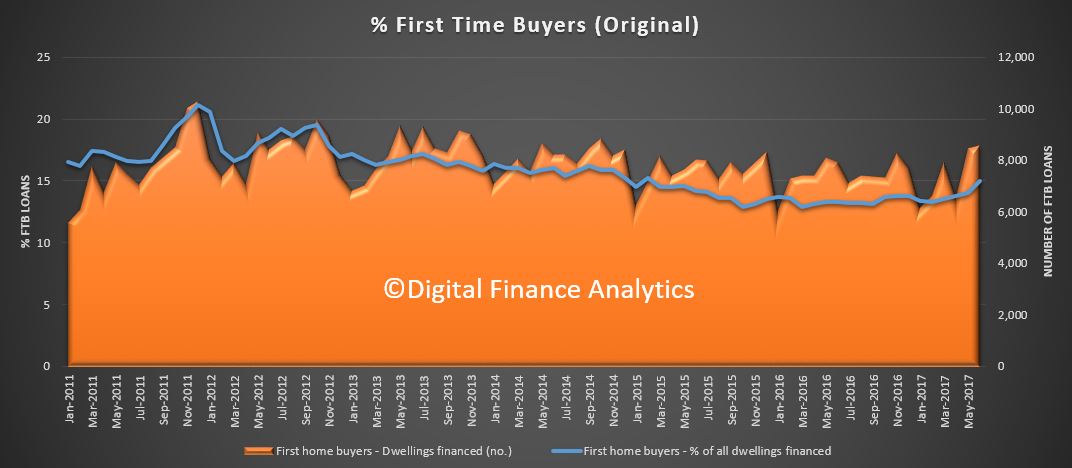 More first time buyers are entering the market now, reacting to the attractive rates selectively on offer.
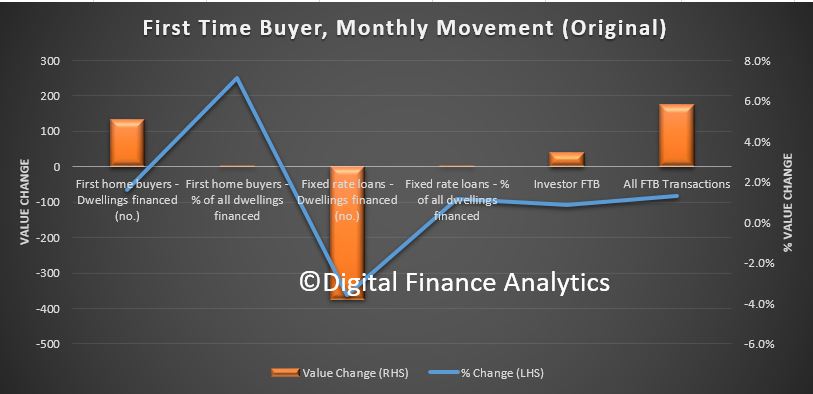 Overlaying the first time buyer investors, which was also quite strong, we see momentum building.
![]() In original terms, in the past month, owner occupied lending flows grew by $7 billion, whilst investment loans grew $2.1 billion.
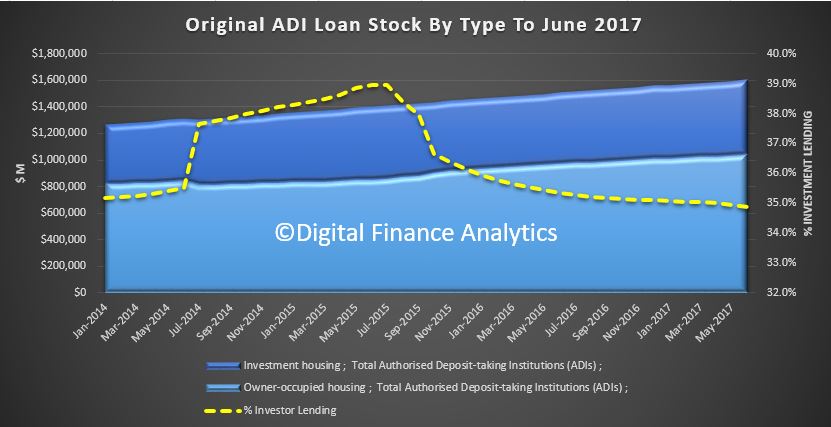
In original terms, in the past month, owner occupied lending flows grew by $7 billion, whilst investment loans grew $2.1 billion.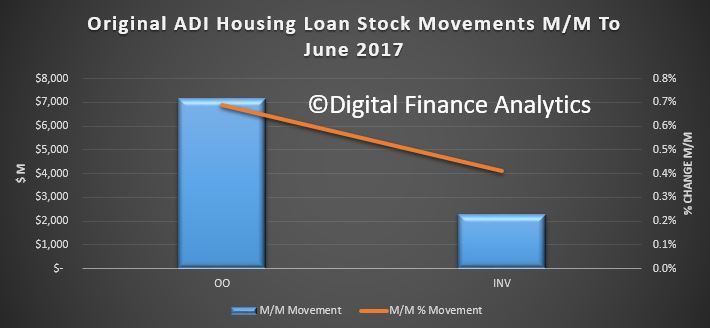 Looking at the trend adjusted stock, the mix of loans remained about the same at 35.9%, and overall loans pools grew.
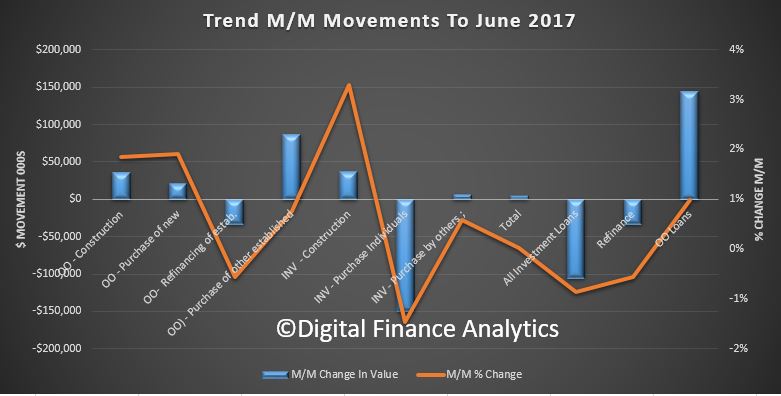
 We see a rise in borrowing for both owner occupied and investment construction.
 So here are the trend adjusted flows, with owner occupied loans on the rise, investment loans down a little, and refinanced loans also down.
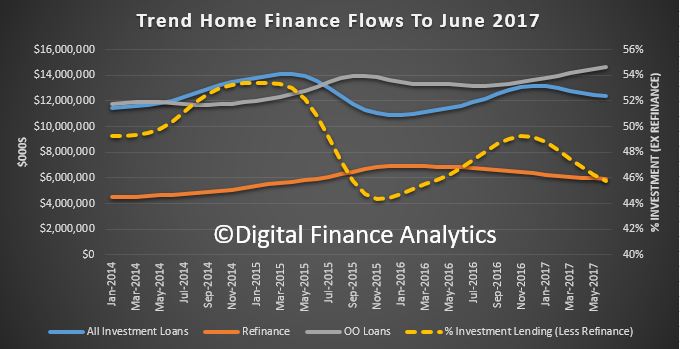 Finally, the ABS says that in trend terms, the number of commitments for owner occupied housing finance fell 0.2% in June 2017.


