
We discuss the latest political scene, against the economic backcloth and the spreading virus. Yet the latest poles still give the incumbents plenty of hope. And what of Barnaby?
Category: Social Trends
Higher superannuation means lower wages: Grattan
Workers overwhelmingly pay for increases in compulsory superannuation contributions through lower wages, a new Grattan Institute paper finds.
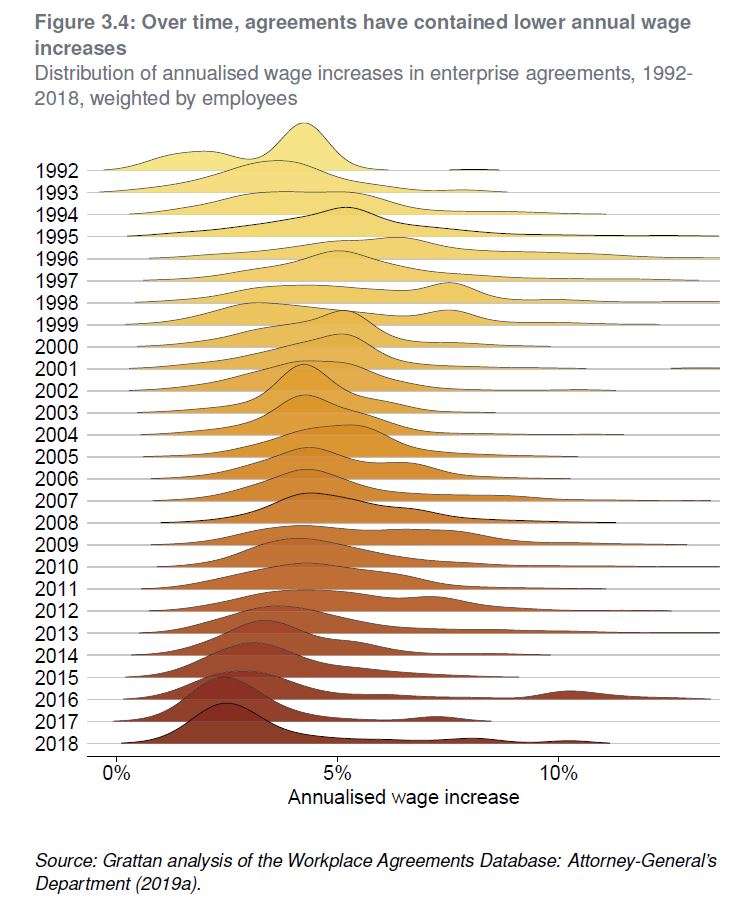
No free lunch: higher super means lower wages uses administrative data on 80,000 federal workplace agreements made between 1991 and 2018 to show that about 80 per cent of the cost of increases in super is passed to workers through lower wage rises within the life of an enterprise agreement, typically 2-to-3 years. And the longer-term impact is likely to be even higher.
‘This trade-off between more superannuation in retirement but lower living standards while working isn’t worth it for most Australians,’ says the lead author, Grattan’s Household Finances Program Director, Brendan Coates.
‘This new empirical analysis reinforces that the planned increase in compulsory super, from 9.5 per cent now to 12 per cent July 2025, should be abandoned. Most Australians are already saving enough for their retirement.’
The paper directly measures the super-wages trade-off for nearly a third of Australian workers – those on federal enterprise agreements. But it shows that other workers are also likely to bear the cost of higher compulsory super in the form of lower wages growth.
Despite the claims of some in the superannuation industry, it is unlikely that future super increases will be different from past increases.
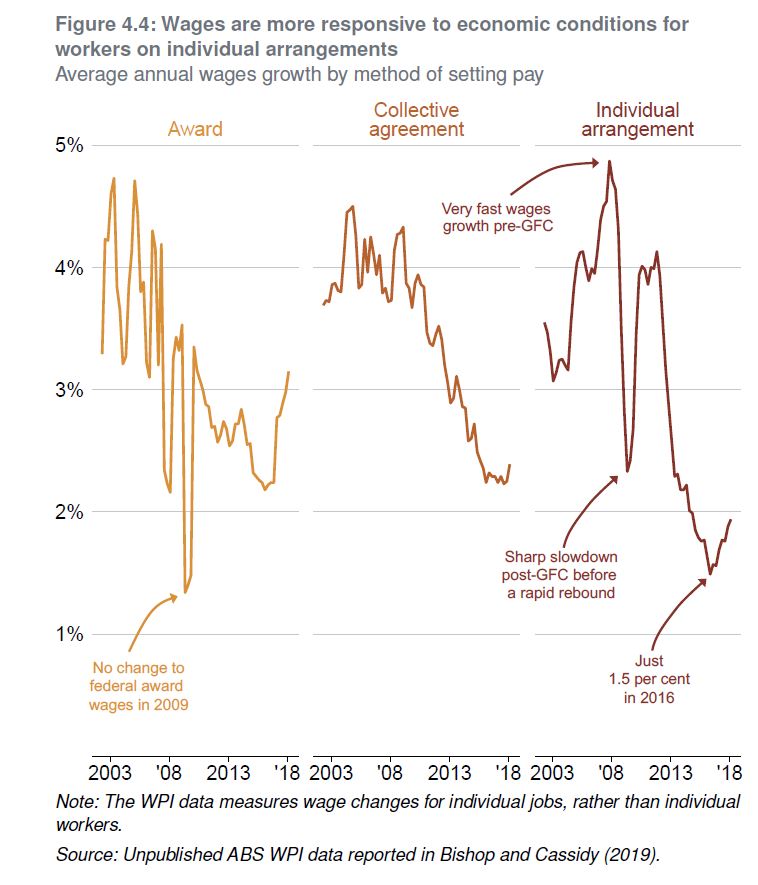
It’s true that wages growth has slowed in recent years, but nominal wages are still growing by more than 2 per cent a year, so employers have plenty of scope to slow the pace of wages growth if compulsory super contributions are increased.
And none of the plausible explanations for lower wages growth – whether slower growth in productivity, technological change, globalisation, an under-performing economy, or weaker bargaining power among workers – helps explain why employers would foot any more of the bill for higher compulsory super this time around.
If employers aren’t willing to offer large pay rises today, it’s hard to imagine why they would pay for higher super. In fact, if workers’ bargaining power has fallen, employers are even less likely to pay for higher compulsory super than in the past.
Grattan’s 2018 report, Money in retirement: more than enough, found that the conventional wisdom that Australians don’t save enough for retirement is wrong.
Now this working paper finds that the conventional wisdom that higher super means lower wages is right.
‘Together, these findings demand a rethink of Australia’s retirement incomes system,’ Mr Coates says.
CPI Is Still In The Gutter!
We look at the latest from the ABS. The drought and lower dollar is not helping.
What will the RBA do?
Will Coronavirus create a Market Hangover? | Nucleus Investment Insights
Nucleus Wealth’s Head of Investment Damien Klassen, Chief Strategist David Llewellyn Smith and Tim Fuller, discuss “Will Coronavirus create a Market Hangover?”
Topics include the pandemic spreading as the Chinese new year fast approaches, if the data can be trusted, Australian and macro implications if Chinese growth slows, how similar this is to the Chinese SARS outbreak in 2003, and as always we wrap up with our investment outlook
To listen as a podcast click here http://bit.ly/NucleusPod
The information on this podcast contains general information and does not take into account your personal objectives, financial situation or needs. Past performance is not an indication of future performance.
Damien Klassen and Tim Fuller are an authorised representative of Nucleus Wealth Management. Nucleus Wealth is a business name of Nucleus Wealth Management Pty Ltd (ABN 54 614 386 266 ) and is a Corporate Authorised Representative of Nucleus Advice Pty Ltd – AFSL 515796.
The Retirement Trap
Quirks in the superannuation system in Australia means that some who save more will get less. This highlights again the limitations of the current arrangements.
https://thenewdaily.com.au/finance/superannuation/2020/01/26/pension-super-income-backwards
Why Retirement Needs A Reboot
We look at a recent report on the future of retirement. There are some big issues on the horizon.
https://www.credit-suisse.com/about-us-news/en/articles/media-releases/credit-suisse-research-institute-publishes-study-urging-rethink–202001.html
Has Chinese Biological WMD Penetrated Australia?
Economist John Adams and Analyst Martin North look at the fallout from the current Coronavirus scare.
How are our politicians handling the emergency?
Given latest reports of 100,000 impacted worldwide, are they doing enough?
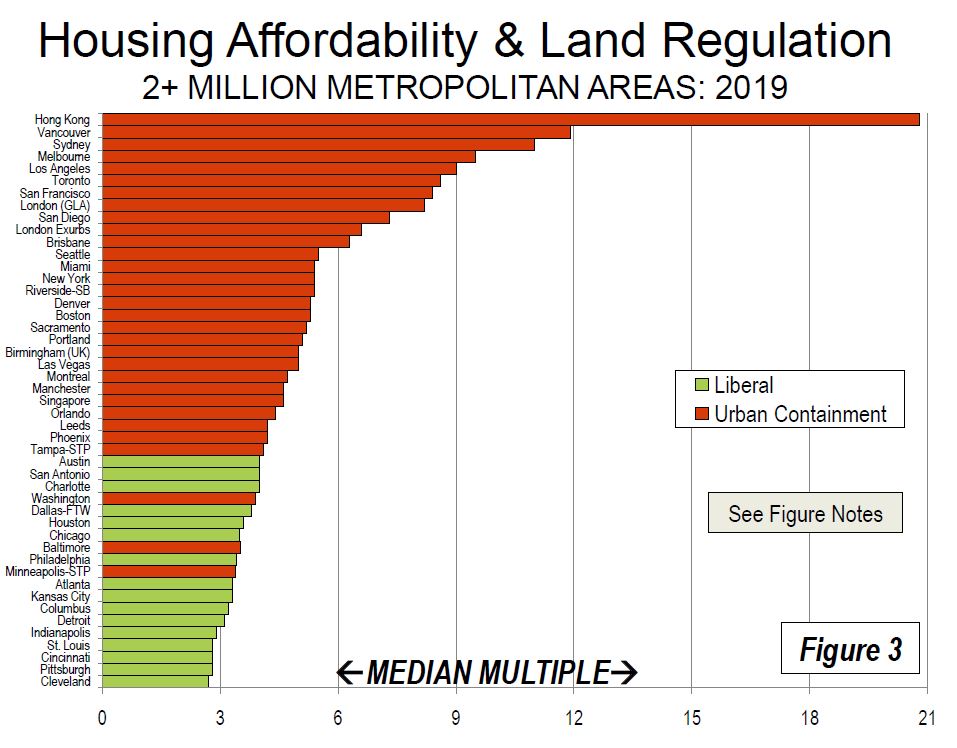
Housing Affordability Sucks
Demographia have released their 16th annual survey of comparable housing affordability using their average price and average income data across more than 300 locations.
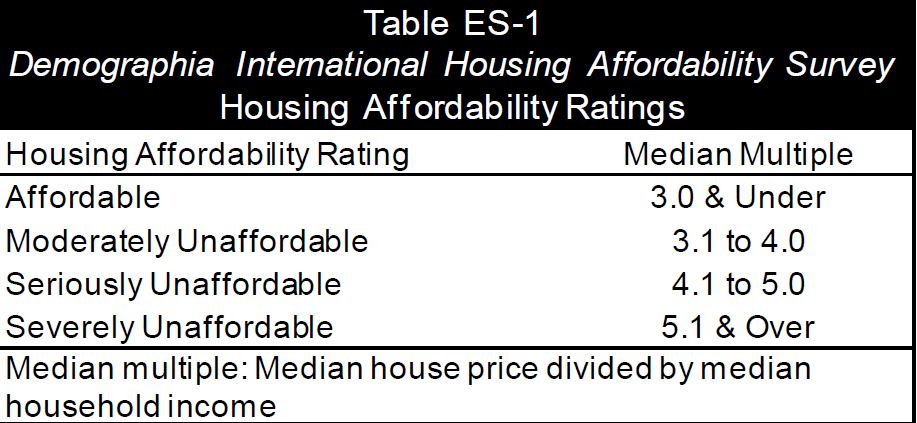
Their methodology is quite specific and allows comparisons to be made across multiple centres, and over time. Any centre scoring above 5 is judged as severely unaffordable.
I have to say I get pretty tired of some who dismiss their approach as distorting the true picture on the basis that averages mask. True I am cautious of averages generally, but it is consistently applied in my book and so makes an important contribution to understanding the relative affordability across many countries, including Australia and New Zealand. And the news is not good at all….
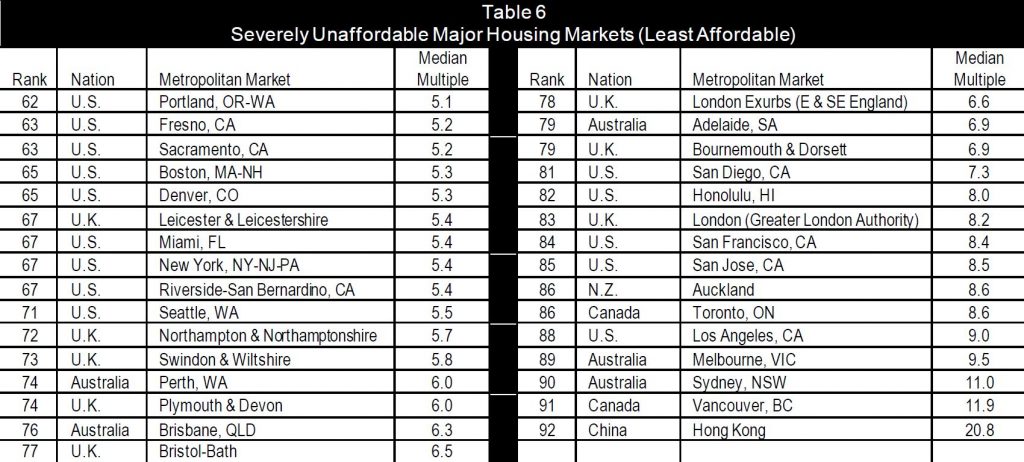
They also run two sets of results, the first is more major centres, and the other is the full set of the results. Across the major housing markets they conclude that all five in Australia are severely affordably (again), as is Auckland in New Zealand.
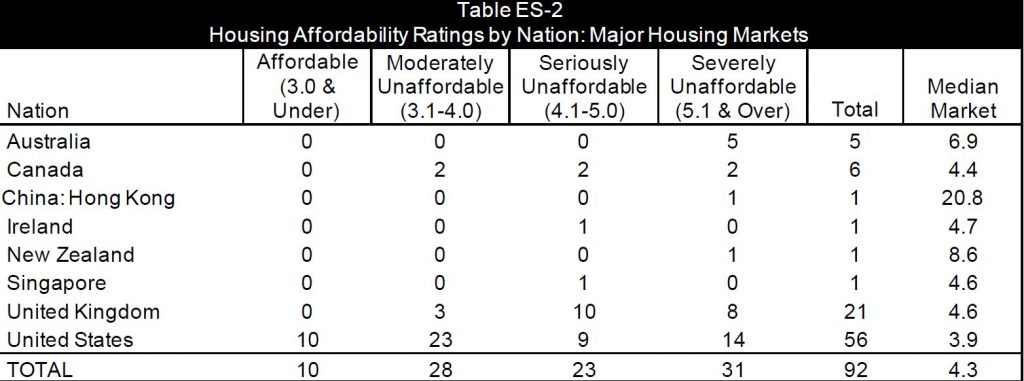
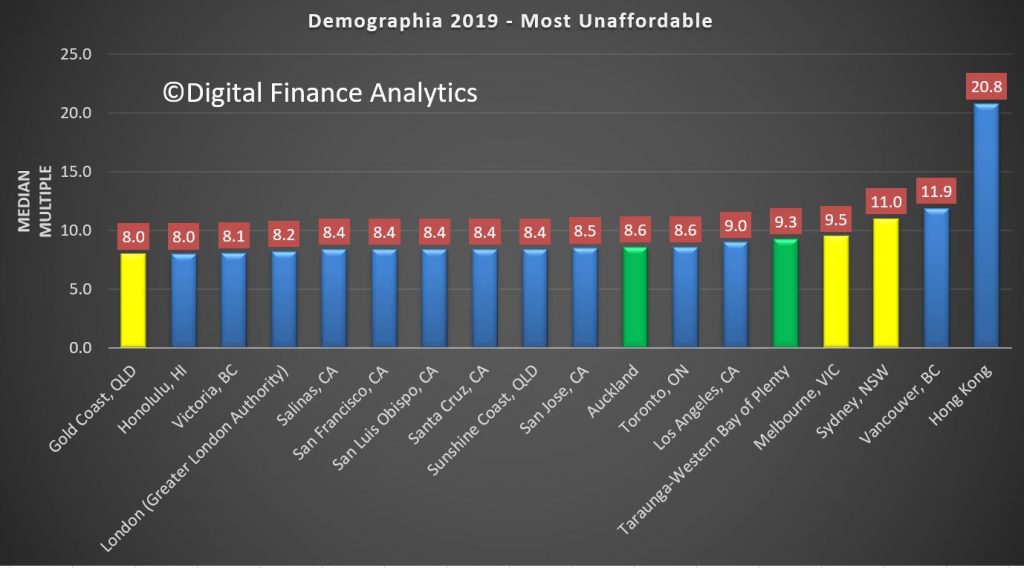
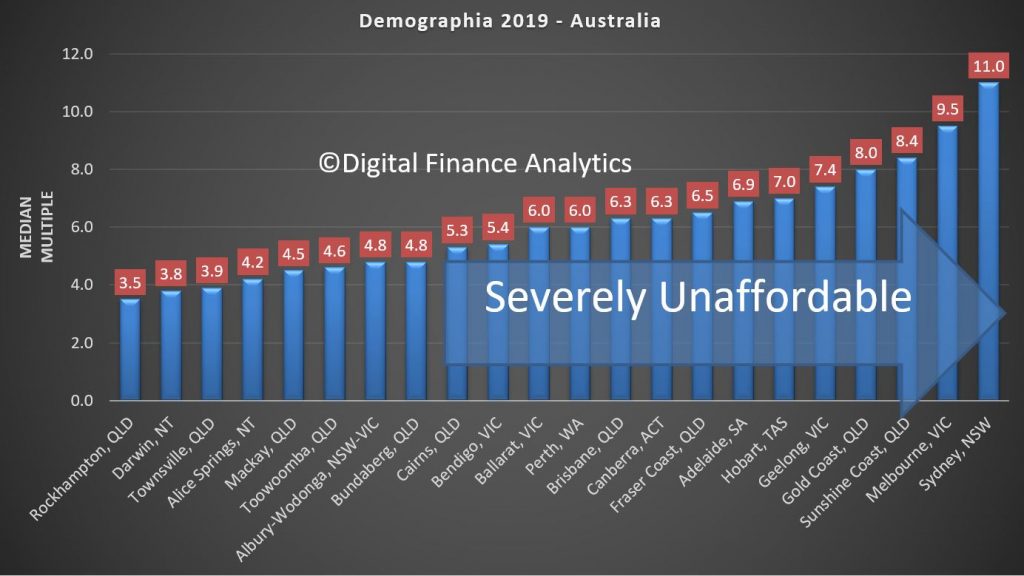
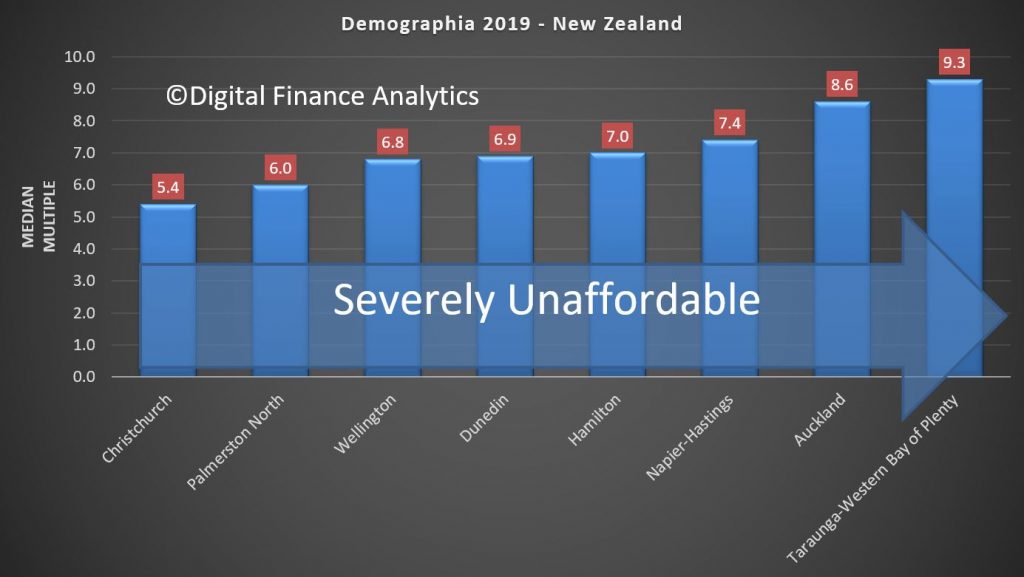
The least affordable areas include Hong Kong at 20.8, Vancouver at 11.9, Sydney at 11.0, Melbourne at 9.5, Bay of Plenty (NZ) at 9.3, LA at 9, Toronto Canada 8.6 and Auckland also at 8.6
On the other hand, in all markets, 22 out of 23 markets are unaffordable in Australia, and ALL of New Zealand’s Markets are unaffordable.
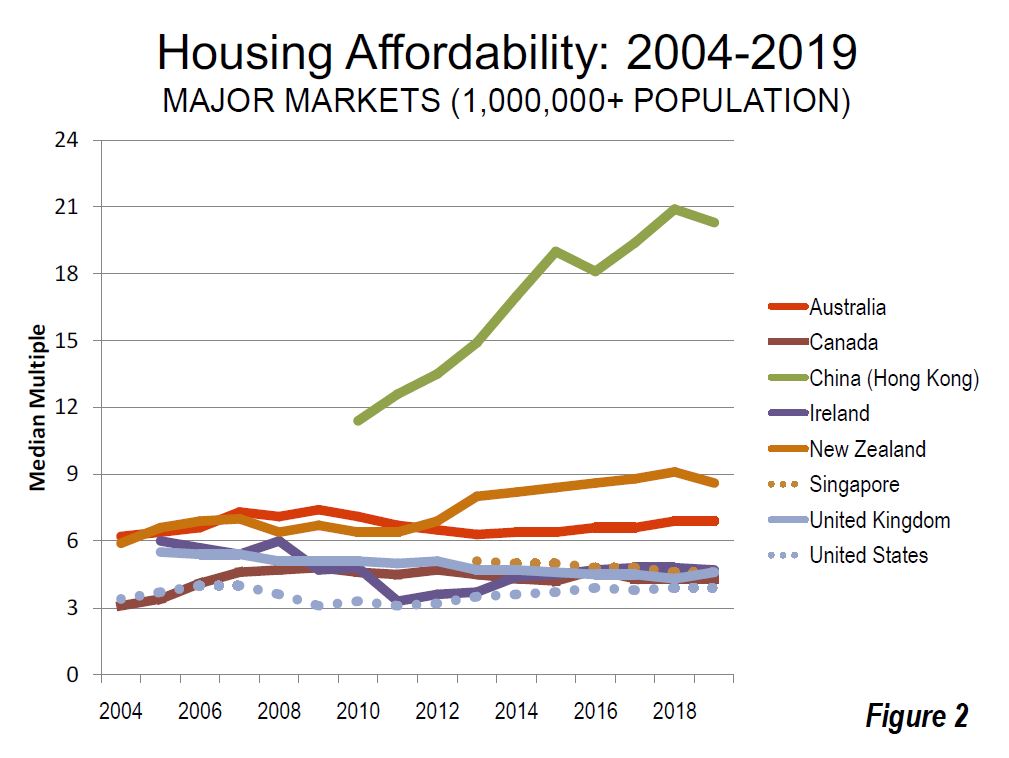
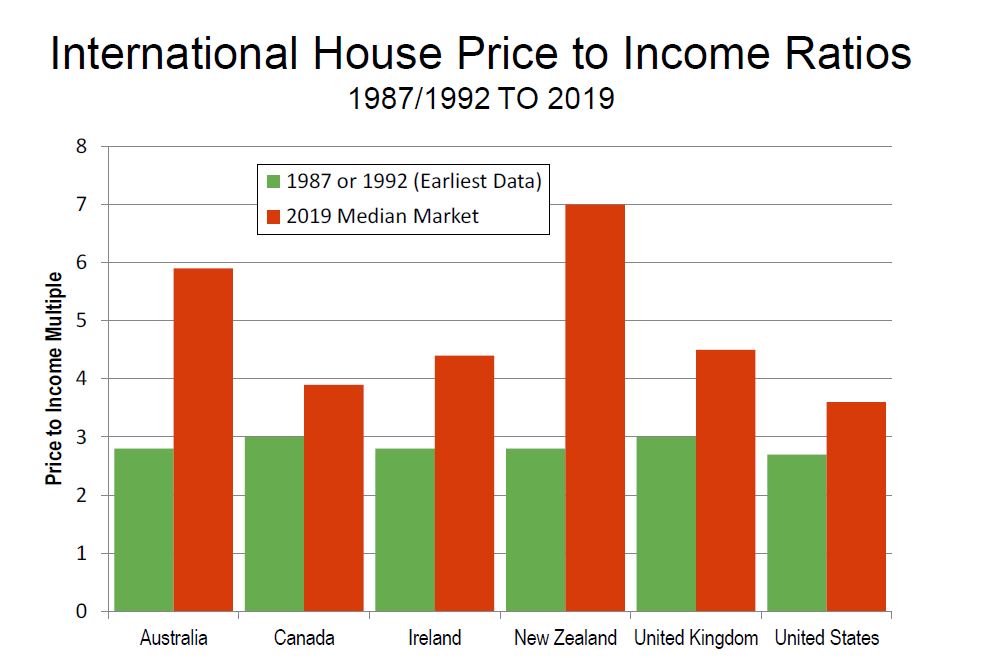
They also show the deterioration in affordability is significant is every market, but with New Zealand and Australia leading the way, with price to income ratios becoming adverse, thanks to issues of land supply (their particular thematic) and over generous lending (DFA’s thesis) of the underlying reason.
Looking at Australia, the least affordable regions are Sydney, Melbourne, Sunshine Coast, Gold Coast, Geelong, Hobart, Adelaide, Fraser Coast in QLD and Canberra, followed by Brisbane, Perth, Ballarat, and Cairns. They are all above the 5.0 affordability benchmark. Frankly this is the bulk of the populated areas in the country – this screams to me “poor policy”.
And the trends are only improving a little thanks to price fall last year. The recent reversals in some areas will just make things worse again.
Demographia said of Australia:
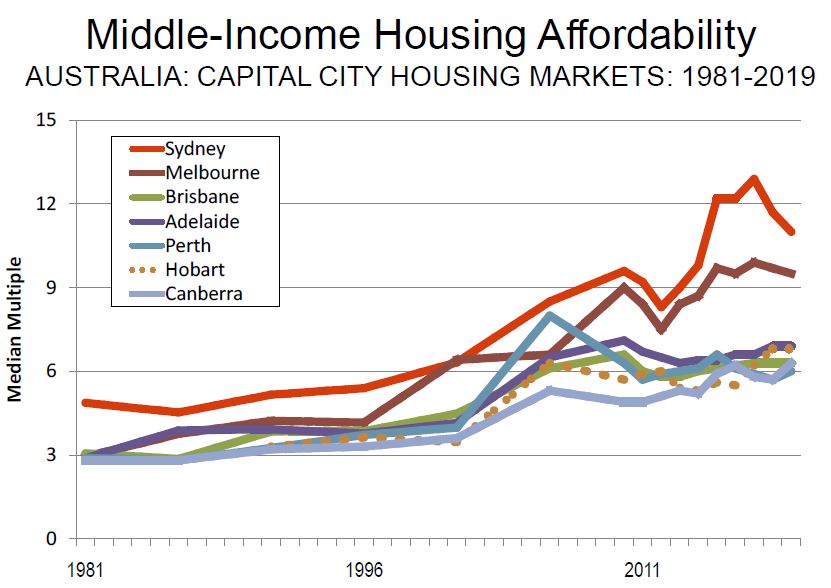
Australia’s generally unfavorable housing affordability is in significant contrast to the broad affordability that existed before implementation of urban containment (called “urban consolidation” in Australia). The price-to-income ratio in Australia was below 3.0 three decades ago
Again, as in each of the previous 15 Demographia International Housing Affordability Surveys, all of Australia’s five major housing markets are severely unaffordable. Even so, housing remains severely unaffordable in all of the major markets, and by a substantial margin in Sydney and Melbourne. Despite what has been called the largest Sydney price reduction in 35 years, house prices relative to incomes are more than double the rate of the early 1980s. In Sydney and Melbourne, median income households need at least three years’ more income to pay for the median priced house than in 2004, when the first Demographia Survey was published.
OECD expressed the following assessment of the Australian housing market (December 2018): “Australia’s housing market is a source of vulnerability. Prices have more than doubled in real terms since the early 2000s and household debt has surged. The market has started to cool over the last year, with prices falling most notably in Melbourne and Sydney. So far, data point to a soft landing without substantial consequence for the overall economy. Nevertheless, risk of a hard landing remains.”
Sydney is again Australia’s least affordable market, with a Median Multiple of 11.0, and ranks third least affordable overall, trailing Hong Kong and Vancouver. Melbourne has a Median Multiple of 9.5 and is the fourth least affordable major housing market internationally. Only Hong Kong, Vancouver, and Sydney are less affordable than Melbourne. Adelaide has a severely unaffordable 6.9 Median Multiple and is the 14th least affordable of the 92. Brisbane has a Median Multiple is 6.3 and is ranked 17th least affordable, while Perth, with a Median Multiple of 6.0 is the 19th least affordable major housing market in this year’s Demographia Survey.
Overall, Australia’s housing markets have a severely unaffordable Median Multiple of 5.9. There is only one affordable market, Gladstone, Queensland, with a Median Multiple of 2.8. Overall 14 markets in Australia are rated severely unaffordable. The least affordable are the Sunshine Coast, Queensland (8.4) and the Gold Coast, Queensland (8.0).
Australia’s high house prices have increased the cost and demand for subsidized housing. The Australian Housing and Urban Research Institute estimated that “current housing need in Australia to be 1.3 million households,” and expected the need to worsen. A Parliamentary briefing book found that “ …the stock of social housing is not increasing at a rate sufficient to keep up with demand, and waiting lists for social housing remain long. ”
In New Zealand, all markets, including Auckland, Christchurch and Wellington are unaffordable.
The trends are also showing affordability remains a strategic issue.
Demographia says
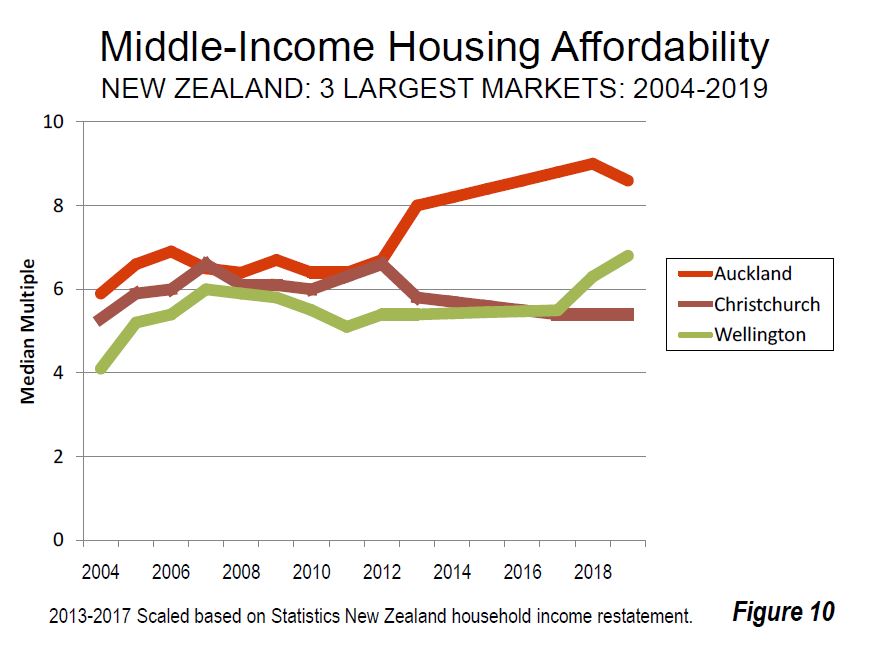
In New Zealand, as in Australia, housing had been affordable until approximately a quarter century ago. However, urban containment policies were adopted across the country, and consistent with the international experience, housing became severely unaffordable in all three of New Zealand’s largest housing markets, Auckland, Christchurch and Wellington (Figure 10). New Zealand’s price-to-income ratio was below 3.0 in the early 1990s.
Recent New Zealand Median Multiple trends have been influenced by government restatement of median income data. Auckland, New Zealand’s only major housing market has a severely unaffordable 8.6 Median Multiple. This is an improvement from 9.0 in 2018.
Even so, Auckland’s housing affordability has deteriorated from a Median Multiple of 5.9 in the first Demographia Survey (2004), thus adding nearly three years in pre-tax median household income to the house prices.
Auckland is the sixth least affordable among the 92 major housing markets, and has been severely unaffordable in all 16 Demographia International Housing Affordability Surveys. New Zealand’s’ second and third largest markets have experienced significantly different housing affordability trends over the last decade. Second largest Christchurch has a Median Multiple of 5.4, an improvement of 0.7 points from the 6th annual Demographia International Housing Affordability Survey.
Third largest Wellington has a Median Multiple of 6.8, a deterioration of 1.2 points over the past decade (Figure 10).
New Zealand’s middle-income housing crisis has strained government low-income housing budgets. Emergency aid has been increased to accommodate some low-income households in motels and waiting lists have been growing.
Housing affordability remains an issue of considerable public concern in New Zealand. The latest IPSOS New Zealand Issues Monitor (November 2019), with 62 percent respondents believing that they cannot afford to purchase a house in their own market. Housing affordability has been a principal issue from the time of the lead – up to the 2008 election and Parliaments 2007-8 Commerce Committee Housing Affordability Inquiry, chaired by the National Party’s Hon. Gerry Brownlee. National’s then Housing Spokesman and later Minister Hon. Phil Heatley toured the United States and United Kingdom prior to the election to study housing.
The Labour Party led coalition government’s Urban Growth agenda calls for intensified residential development, both greenfield and infill. This includes the abolishment of the Auckland urban containment boundary.
The government is also proceeding with plans to reform infrastructure finance to rely on debt to be serviced by residents of new developments, rather than public expenditures. During the December 1st Reading of the Infrastructure Funding and Financing Bill , Urban Development Minister Twyford acknowledged the broad political support for the Bill. Just prior to this, the Urban Development Bill was introduced in Parliament.
Twyford addressed the Government Economics Network Conference in December, reiterating the government’s commitment to improving housing affordability. “The argument I want to make to you is that generations of urban land use policy have lacked a decent grounding in economics. The consequences of that have been disastrous. And if we want to turn it around it is going to take bold reform and policies informed by an understanding of urban spatial economics”.
The final point they make is that price is directly linked to control of land supply. Markets, like Australia and New Zealand, where land releases are controlled and rationed help to explain the rising prices and falling affordability. And this of course despite falling interest rates.
This is one right royal mess, and the social and economic consequences will resonate down the years. housing affordability sucks.
Momentum Wins As Records Keep Falling – The Property Imperative Weekly 18 Jan 2020
The latest edition of our weekly finance and property news digest with a distinctively Australian flavour.
- Contents: 00:25
- Introduction 01:00
- US Markets 02:07
- US Home-building
- 08:00 Fed Repos
- 09:50 UK Markets
- 11:45 ECB
- 12:00 Germany
- 13:45 ESG Investing
- 15:00 New Zealand Home Prices
- 15:49 China
- 17:24 Australian Segment
- 17:24 Economic data
- 18:15 Home Prices
- 18:30 Bank of Mum and Dad
- 19:32 Cost of the Bushfires
- 21:00 Markets
January Live Event: https://youtu.be/Z03jkJEmvOI
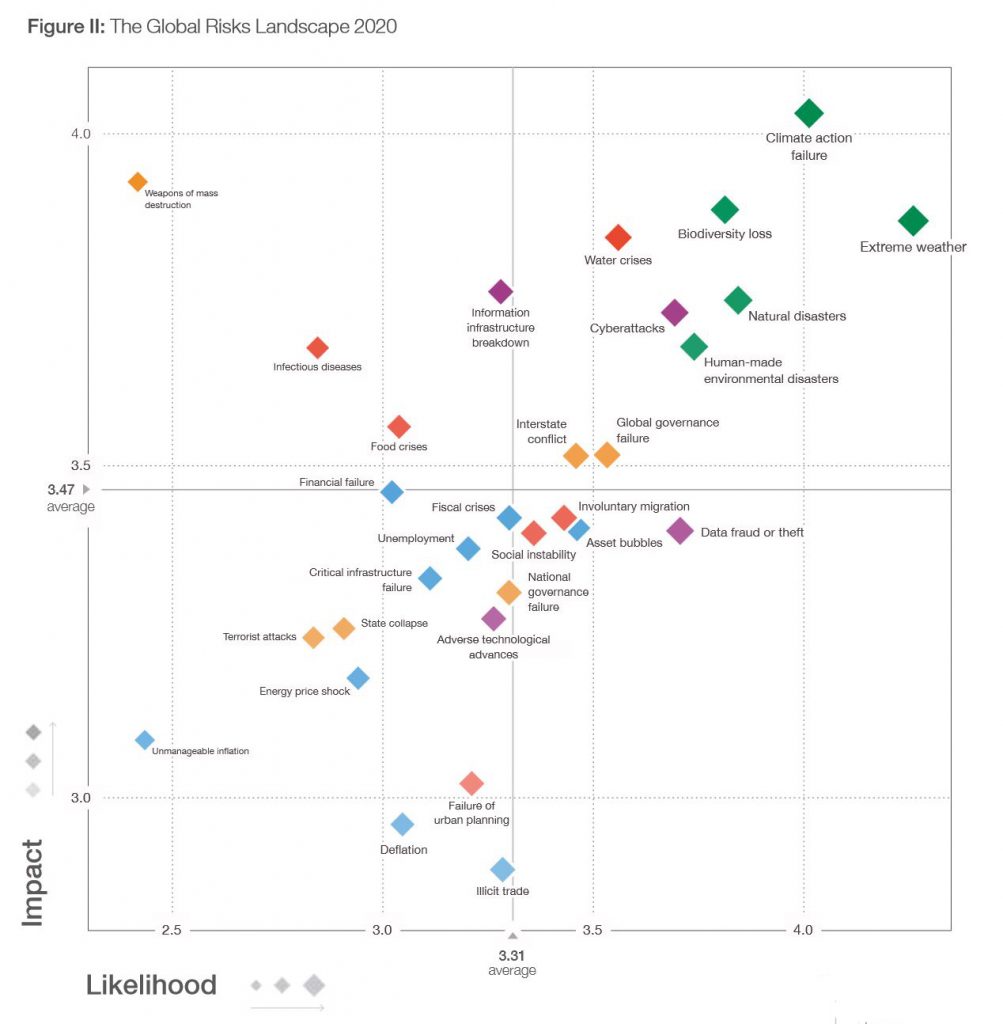
Global Risks Still Building: WEF
The World Economic Forum has just released their 2020 report, the 15th in the series and they highlight ” long-mounting, interconnected risks” driven by their annual Global Risks Perception Survey which was completed by approximately 800 members of the Forum’s diverse communities.
They conclude that the world “cannot wait for the fog of geopolitical and geo-economic uncertainty to lift. Opting to ride out the current period in the hope that the global system will “snap back” runs the risk of missing crucial windows to address pressing challenges”.
At the time of writing, the IMF expected growth to be 3.0% in 2019—the lowest rate since the economic crisis of 2008-2009.
They say that today’s emerging economies are expected to comprise six of the world’s seven largest economies by 2050. Rising powers are already investing more in projecting influence around the world. And digital technologies are redefining what it means to exert global power. As these trends are unfolding, a shift in mindset is also taking place among some stakeholders—from multilateral to unilateral and from cooperative to competitive. The resulting geopolitical turbulence is one of unpredictability about who is leading, who are allies, and who will end up the winners and losers.
The global economy is faced with a “synchronized slowdown”, the past five years have been the warmest on record, and cyberattacks are expected to increase this year—all while citizens protest the political and economic conditions in their countries and voice concerns about systems that exacerbate inequality.
Indeed, the growing palpability of shared economic, environmental and societal risks signals that the horizon has shortened for preventing—or even mitigating—some of the direst consequences of global risks. It is sobering that in the face of this development, when the challenges before us demand immediate collective action, fractures within the global community appear to only be widening.
Global commerce has historically been a pillar and engine of growth—and a key tool for lifting economies out of downturns—but as we warn, significant restrictions were placed on global trade last year. This comes as G20 economies hold record high levels of debt and exhibit relatively low levels of growth. Ammunition to fight a potential recession is lacking, and there is a possibility of an extended low-growth period, akin to the 1970s, if lack of coordinated action continues. In addition, a potential decoupling of the world’s largest economies, the United States and China, is cause for further concern. The question for stakeholders—one that cannot be answered in the affirmative—is whether in the face of a prolonged global slowdown we are positioned in a way that will foster resiliency and prosperity.
On the environment, we note with grave concern the consequences of continued environmental degradation, including the record pace of species decline. Respondents to our Global Risks Perception Survey are also sounding the alarm, ranking climate change and related environmental issues as the top five risks in terms of likelihood—the first time in the survey’s history that one category has occupied all five of the top spots. But despite the need to be more ambitious when it comes to climate action, the UN has warned that countries have veered off course when it comes to meeting their commitments under the Paris Agreement on climate change.
And on global health and technology, we caution that international systems have not kept up to date with the challenges of these domains. The global community is ill-positioned to address vulnerabilities that have come alongside the advancements of the 20th century, whether they be the widening application of artificial intelligence or the widespread use of antibiotics.
Today’s risk landscape is being shaped in significant measure by an unsettled geopolitical environment—one in which new centres of power and influence are forming—as old alliance structures and global institutions are being tested. While these changes can create openings for new partnership structures, in the immediate term, they are putting stress on systems of coordination and challenging norms around shared responsibility. Unless stakeholders adapt multilateral mechanisms for this turbulent period, the risks that were once on the horizon will continue to arrive.
The good news is that the window for action is still open, if not for much longer. And, despite global divisions, we continue to see members of the business community signal their commitment to looking beyond their balance sheets and towards the urgent priorities ahead.
They highlight the economic risks posed by global runaway climate change. Climate change is striking harder and more rapidly than many expected, with the bushfires that have ravaged Australia – as well as floods and droughts around the world – bringing the issue to the forefront of the global agenda.
They say, “alarmingly, global temperatures are on track to increase by at least 3°C towards the end of the century—twice what climate experts have warned is the limit to avoid the most severe economic, social and environmental consequences”.
The economic threat posed by climate change could impact everything from national economies to the mortgage and insurance industries. Worldwide economic damage from natural disasters in 2018 totalled US$165 billion, with that number set to increase if emissions remain at their current level.
In the United States alone, climate-related economic damage could reach 10 per cent of GDP by the end of the century, while over 200 of the world’s largest firms estimate that climate change will cost them a combined total of nearly US$1 trillion.
But the report says many businesses are still not planning on the physical and financial risks that climate change could have on their activities and value chains.
The WEF warns that avoiding the most severe economic and social consequences of global climate change means limiting global warming to just 1.5 degrees Celsius over pre-industrial levels. This equates to a remaining carbon budget of less than 10 more years of emissions at their current level – and demand for energy is only continuing to increase.