
Demographia have released their 16th annual survey of comparable housing affordability using their average price and average income data across more than 300 locations.
Their methodology is quite specific and allows comparisons to be made across multiple centres, and over time. Any centre scoring above 5 is judged as severely unaffordable.
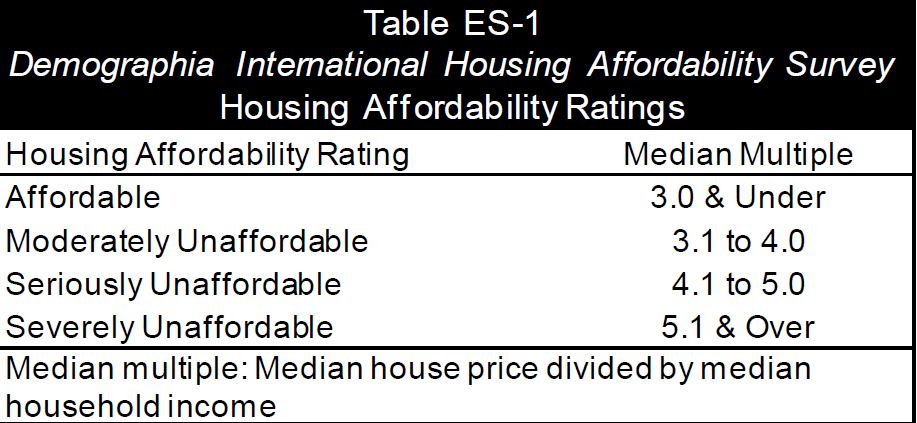
I have to say I get pretty tired of some who dismiss their approach as distorting the true picture on the basis that averages mask. True I am cautious of averages generally, but it is consistently applied in my book and so makes an important contribution to understanding the relative affordability across many countries, including Australia and New Zealand. And the news is not good at all….
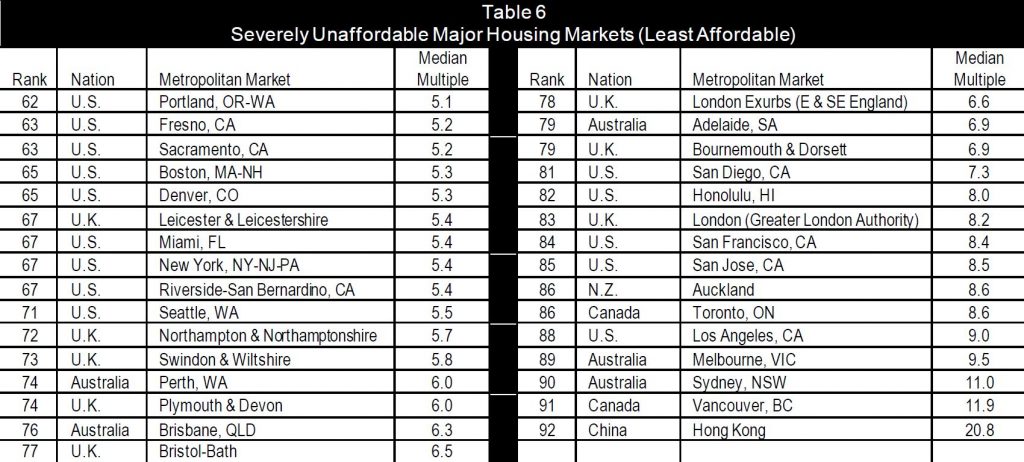
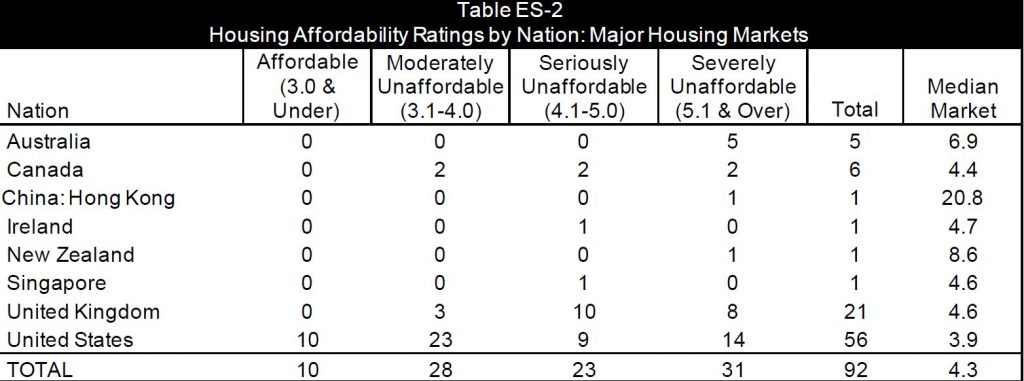
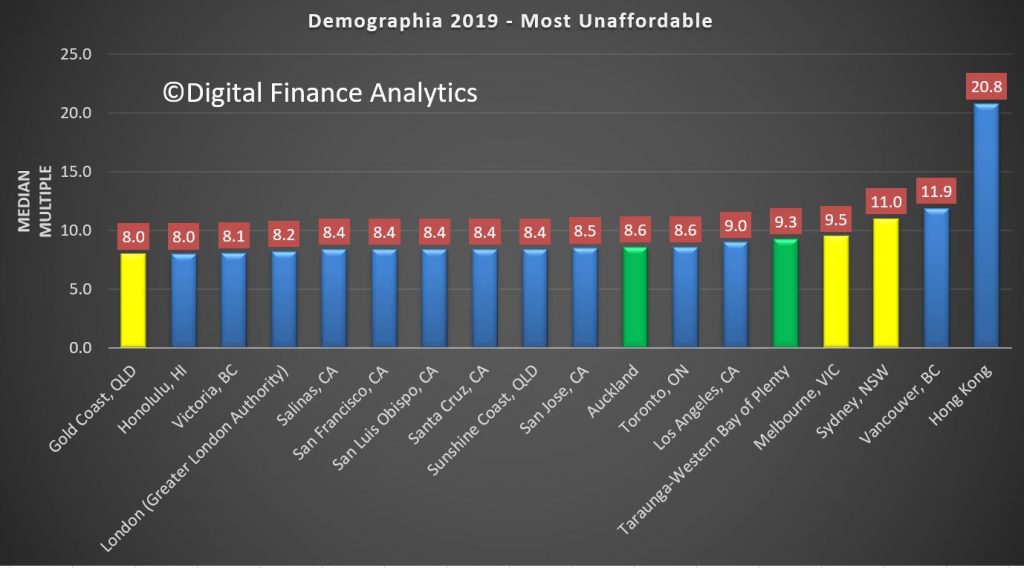
They also run two sets of results, the first is more major centres, and the other is the full set of the results. Across the major housing markets they conclude that all five in Australia are severely affordably (again), as is Auckland in New Zealand.
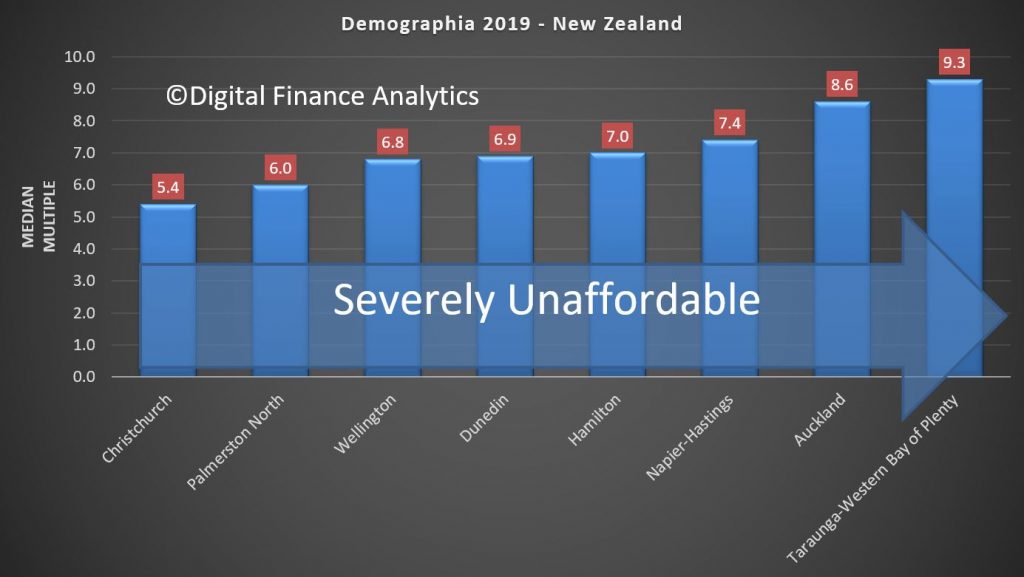
The least affordable areas include Hong Kong at 20.8, Vancouver at 11.9, Sydney at 11.0, Melbourne at 9.5, Bay of Plenty (NZ) at 9.3, LA at 9, Toronto Canada 8.6 and Auckland also at 8.6
On the other hand, in all markets, 22 out of 23 markets are unaffordable in Australia, and ALL of New Zealand’s Markets are unaffordable.
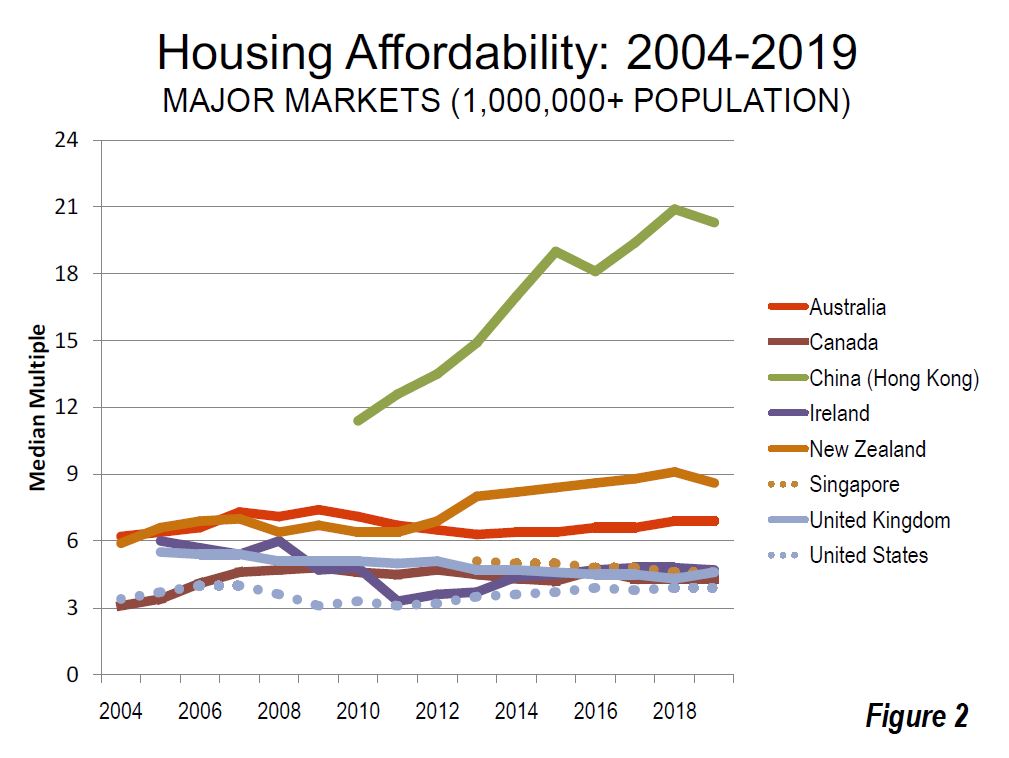
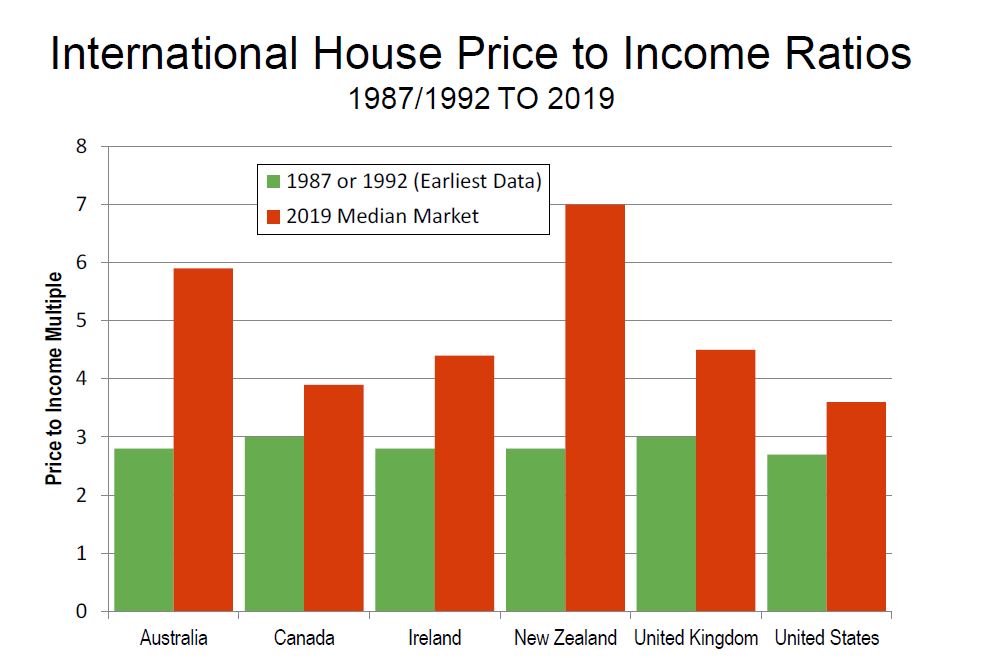
They also show the deterioration in affordability is significant is every market, but with New Zealand and Australia leading the way, with price to income ratios becoming adverse, thanks to issues of land supply (their particular thematic) and over generous lending (DFA’s thesis) of the underlying reason.
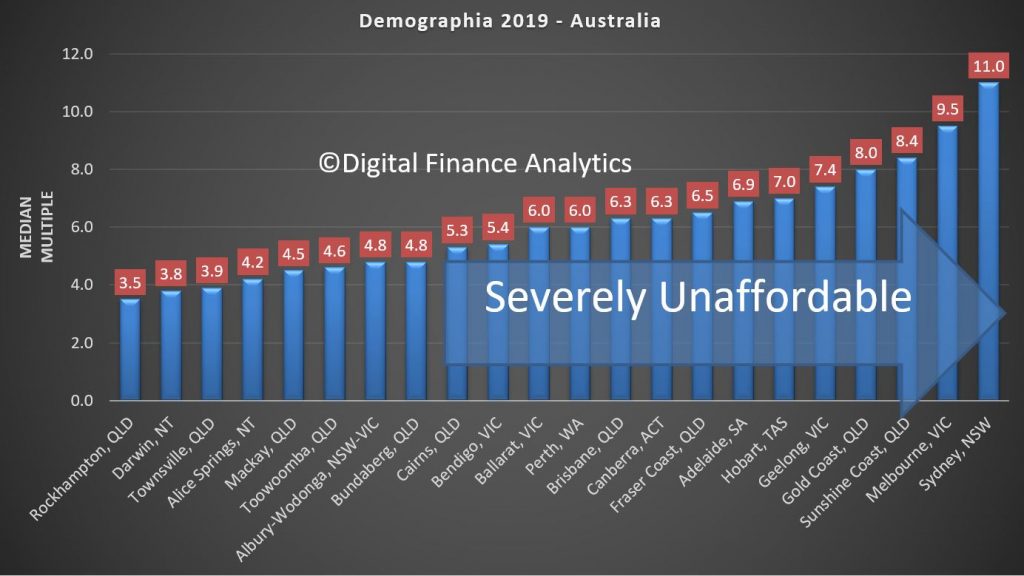
Looking at Australia, the least affordable regions are Sydney, Melbourne, Sunshine Coast, Gold Coast, Geelong, Hobart, Adelaide, Fraser Coast in QLD and Canberra, followed by Brisbane, Perth, Ballarat, and Cairns. They are all above the 5.0 affordability benchmark. Frankly this is the bulk of the populated areas in the country – this screams to me “poor policy”.
And the trends are only improving a little thanks to price fall last year. The recent reversals in some areas will just make things worse again.
Demographia said of Australia:
Australia’s generally unfavorable housing affordability is in significant contrast to the broad affordability that existed before implementation of urban containment (called “urban consolidation” in Australia). The price-to-income ratio in Australia was below 3.0 three decades ago
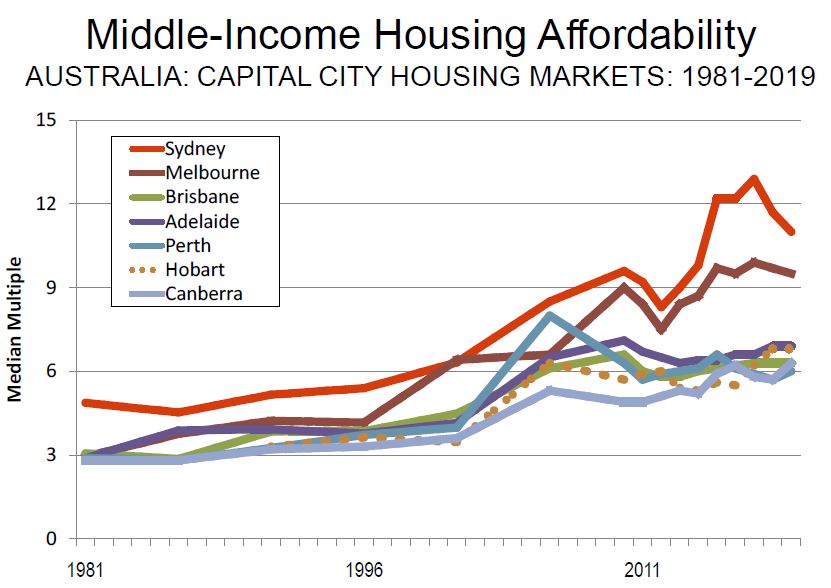
Again, as in each of the previous 15 Demographia International Housing Affordability Surveys, all of Australia’s five major housing markets are severely unaffordable. Even so, housing remains severely unaffordable in all of the major markets, and by a substantial margin in Sydney and Melbourne. Despite what has been called the largest Sydney price reduction in 35 years, house prices relative to incomes are more than double the rate of the early 1980s. In Sydney and Melbourne, median income households need at least three years’ more income to pay for the median priced house than in 2004, when the first Demographia Survey was published.
OECD expressed the following assessment of the Australian housing market (December 2018): “Australia’s housing market is a source of vulnerability. Prices have more than doubled in real terms since the early 2000s and household debt has surged. The market has started to cool over the last year, with prices falling most notably in Melbourne and Sydney. So far, data point to a soft landing without substantial consequence for the overall economy. Nevertheless, risk of a hard landing remains.”
Sydney is again Australia’s least affordable market, with a Median Multiple of 11.0, and ranks third least affordable overall, trailing Hong Kong and Vancouver. Melbourne has a Median Multiple of 9.5 and is the fourth least affordable major housing market internationally. Only Hong Kong, Vancouver, and Sydney are less affordable than Melbourne. Adelaide has a severely unaffordable 6.9 Median Multiple and is the 14th least affordable of the 92. Brisbane has a Median Multiple is 6.3 and is ranked 17th least affordable, while Perth, with a Median Multiple of 6.0 is the 19th least affordable major housing market in this year’s Demographia Survey.
Overall, Australia’s housing markets have a severely unaffordable Median Multiple of 5.9. There is only one affordable market, Gladstone, Queensland, with a Median Multiple of 2.8. Overall 14 markets in Australia are rated severely unaffordable. The least affordable are the Sunshine Coast, Queensland (8.4) and the Gold Coast, Queensland (8.0).
Australia’s high house prices have increased the cost and demand for subsidized housing. The Australian Housing and Urban Research Institute estimated that “current housing need in Australia to be 1.3 million households,” and expected the need to worsen. A Parliamentary briefing book found that “ …the stock of social housing is not increasing at a rate sufficient to keep up with demand, and waiting lists for social housing remain long. ”
In New Zealand, all markets, including Auckland, Christchurch and Wellington are unaffordable.
The trends are also showing affordability remains a strategic issue.
Demographia says
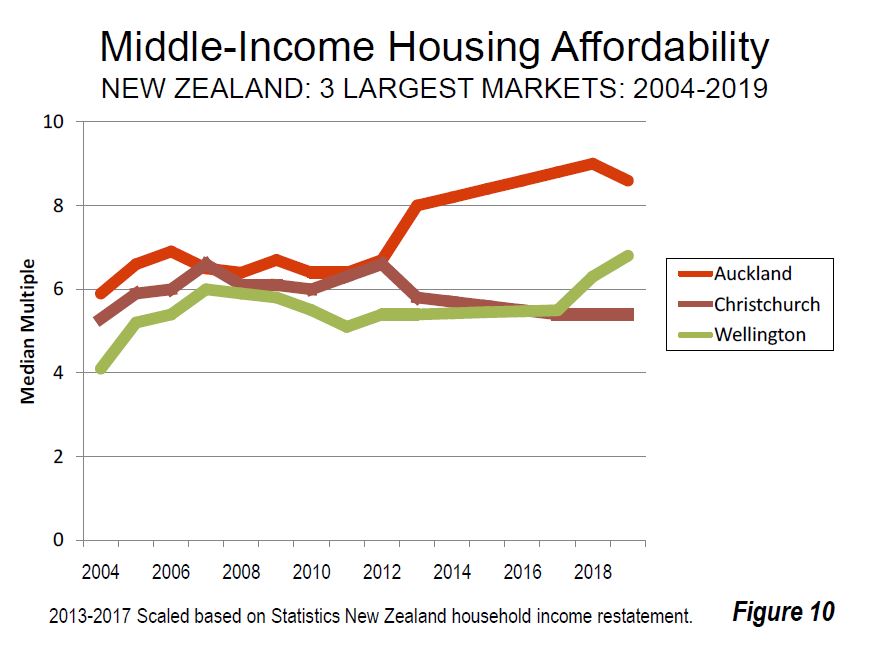
In New Zealand, as in Australia, housing had been affordable until approximately a quarter century ago. However, urban containment policies were adopted across the country, and consistent with the international experience, housing became severely unaffordable in all three of New Zealand’s largest housing markets, Auckland, Christchurch and Wellington (Figure 10). New Zealand’s price-to-income ratio was below 3.0 in the early 1990s.
Recent New Zealand Median Multiple trends have been influenced by government restatement of median income data. Auckland, New Zealand’s only major housing market has a severely unaffordable 8.6 Median Multiple. This is an improvement from 9.0 in 2018.
Even so, Auckland’s housing affordability has deteriorated from a Median Multiple of 5.9 in the first Demographia Survey (2004), thus adding nearly three years in pre-tax median household income to the house prices.
Auckland is the sixth least affordable among the 92 major housing markets, and has been severely unaffordable in all 16 Demographia International Housing Affordability Surveys. New Zealand’s’ second and third largest markets have experienced significantly different housing affordability trends over the last decade. Second largest Christchurch has a Median Multiple of 5.4, an improvement of 0.7 points from the 6th annual Demographia International Housing Affordability Survey.
Third largest Wellington has a Median Multiple of 6.8, a deterioration of 1.2 points over the past decade (Figure 10).
New Zealand’s middle-income housing crisis has strained government low-income housing budgets. Emergency aid has been increased to accommodate some low-income households in motels and waiting lists have been growing.
Housing affordability remains an issue of considerable public concern in New Zealand. The latest IPSOS New Zealand Issues Monitor (November 2019), with 62 percent respondents believing that they cannot afford to purchase a house in their own market. Housing affordability has been a principal issue from the time of the lead – up to the 2008 election and Parliaments 2007-8 Commerce Committee Housing Affordability Inquiry, chaired by the National Party’s Hon. Gerry Brownlee. National’s then Housing Spokesman and later Minister Hon. Phil Heatley toured the United States and United Kingdom prior to the election to study housing.
The Labour Party led coalition government’s Urban Growth agenda calls for intensified residential development, both greenfield and infill. This includes the abolishment of the Auckland urban containment boundary.
The government is also proceeding with plans to reform infrastructure finance to rely on debt to be serviced by residents of new developments, rather than public expenditures. During the December 1st Reading of the Infrastructure Funding and Financing Bill , Urban Development Minister Twyford acknowledged the broad political support for the Bill. Just prior to this, the Urban Development Bill was introduced in Parliament.
Twyford addressed the Government Economics Network Conference in December, reiterating the government’s commitment to improving housing affordability. “The argument I want to make to you is that generations of urban land use policy have lacked a decent grounding in economics. The consequences of that have been disastrous. And if we want to turn it around it is going to take bold reform and policies informed by an understanding of urban spatial economics”.
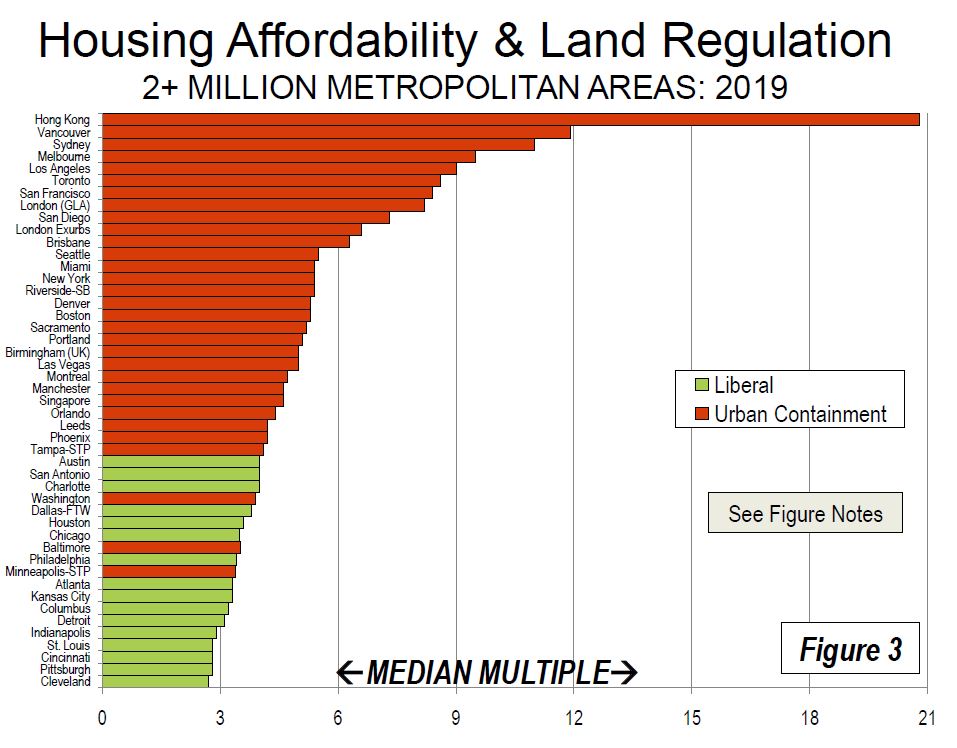
The final point they make is that price is directly linked to control of land supply. Markets, like Australia and New Zealand, where land releases are controlled and rationed help to explain the rising prices and falling affordability. And this of course despite falling interest rates.
This is one right royal mess, and the social and economic consequences will resonate down the years. housing affordability sucks.