I discuss how Ireland navigated their financial crisis a decade ago with Eddie Hobbs, the financial writer, adviser and. broadcaster, who lived through the crash and commented on the events in Ireland.
He wrote and presented a programme on state broadcaster RTE entitled Rip-Off Republic in 2005.
Specifically we discuss how Australia should be preparing…. now….
ASIC has released its first review of the rapidly growing buy now pay later industry. The review of this diverse and evolving market has found that buy now pay later arrangements are influencing the spending habits of consumers, especially younger consumers. One in six users had either become overdrawn, delayed bill payments or borrowed additional money because of a buy now pay later arrangement.
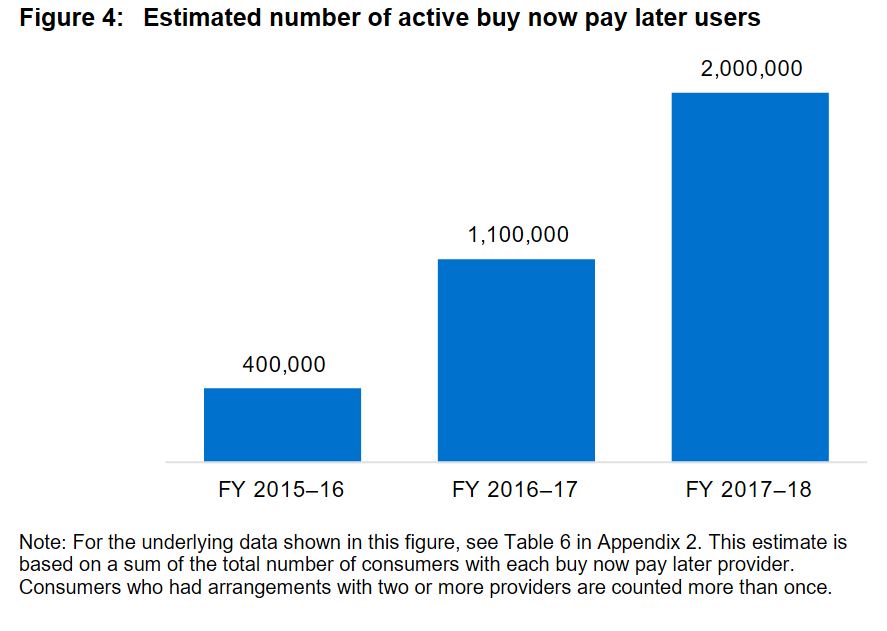
They estimate 2 million active buyers use these services.
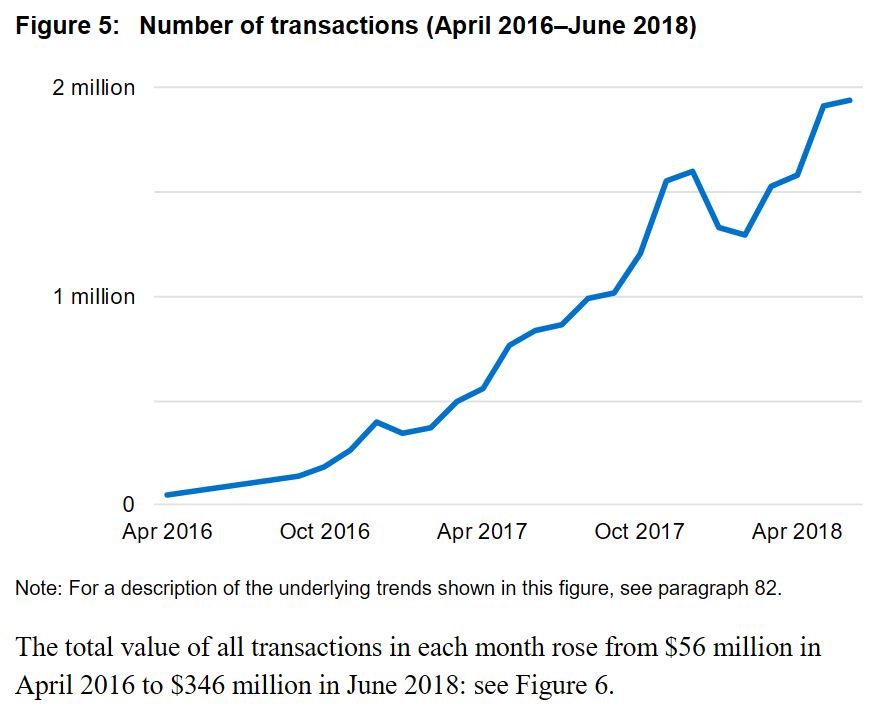
… and transactions are increasing.
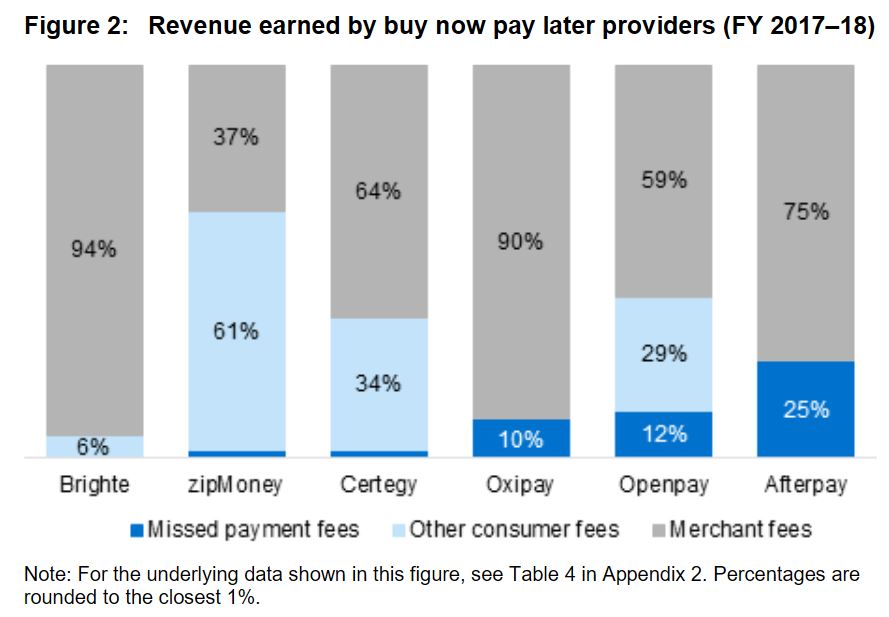
They show that much of the revenue generated comes from merchant fees, but also includes some missed payment and other consumer fees.
A buy now pay later arrangement allows consumers to purchase and obtain goods and services immediately but pay for that purchase over time. While some buy now pay later providers offer fixed term contracts up to 56 days for amounts up to $2,000, other providers offer a line of credit for amounts up to $30,000.
ASIC found that the number of consumers who have used buy now pay later has increased five-fold from 400,000 to 2 million over the financial years 2015-2016 to 2017-2018. The number of transactions has increased from about 50,000 during the month of April 2016 to 1.9 million in June 2018. At 30 June 2018, there was $903m in outstanding buy now pay later balances.
ASIC Commissioner Danielle Press said ‘Although our review found many consumers enjoy using buy now pay later arrangements and plan to continue using them, there are some potential risks for consumers in using these products.
‘The typical buy now pay later consumer is young with 60% of buy now pay later users aged between 18 to 34 years old. We found that buy now pay later arrangements can cause some consumers to become financially overcommitted and liable to paying late fees.’
One in six users had either become overdrawn, delayed bill payments or borrowed additional money because of a buy now pay later arrangement. Most consumers believe that these arrangements allow them to buy more expensive items than they would otherwise and spend more than they normally would. Providers also use behavioural techniques which can influence consumers to make a purchase without careful consideration of the costs.
‘The exponential growth in this industry, along with the risks we have identified, means this will remain an area of ongoing focus for ASIC. One area we will be targeting is where consumers are paying more than they need to for using a buy now pay later arrangement’, said Ms Press.
Given the potential risks to consumers, ASIC supports extending the proposed product intervention powers to all credit facilities regulated under the ASIC Act. Product intervention powers will provide ASIC with a flexible tool kit to address emerging products and services such as buy now pay later arrangements. This will ensure ASIC can take appropriate action where significant consumer detriment is identified.
Background
Buy now pay later arrangements allow consumers to defer payment for purchases from participating merchants and obtain the goods and services immediately.
Under the arrangement, consumers are generally not charged interest. However, some arrangements have an establishment fee and account-keeping fees. Consumers may also be charged a fee if they miss a payment.
Buy now pay later arrangements are available from a range of merchants. For example, these arrangements could be used to finance high-value purchases such as solar power products, health services, travel, and electronics. Buy now pay later arrangements are also available for everyday purchases from retailers such as Big W, Target, Harris Scarfe and Kmart.
These arrangements are not regulated under the National Credit Act and as a result providers are not required to be licensed or to comply with the responsible lending laws that prohibit a lender from providing credit that would be ‘unsuitable’ for the consumer. However, these arrangements are considered ‘credit facilities’ under the ASIC Act meaning that ASIC can take action where a buy now pay later provider engages in conduct that is misleading or unconscionable.
ASIC’s review
ASIC undertook a proactive review of these arrangements to develop a broad understanding of this growing industry and to identify potential risks for consumers. The review examined six providers, four of which are part of larger ASX-listed companies. The buy now pay later arrangements we reviewed were: Afterpay, zipPay, Certegy Ezi-Pay, Oxipay, BrightePay and Openpay.
To better understand how this industry is working in practice, we considered qualitative and quantitative data from July 2016 to June 2018. We also relied on independent consumer research which involved a survey of 600 randomly selected consumers who had recently used a buy now pay later arrangement.
ASIC also tested each of the providers performance in areas such as transparency, dispute resolution and hardship. As a result, all of the providers have made improvements that will benefit consumers. For example, all of the providers are now members of the new Australian Financial Complaints Authority, and all of the providers are reviewing their standard form contracts for potentially unfair contract terms.
ASIC will continue to collect data to monitor the adequacy of consumer protections in this sector and review changes made by buy now pay later providers.
ASIC’s MoneySmart website explains how buy now pay later services work and how consumers can avoid getting into financial trouble when using them.
The Grattan Institute has rejected the ‘fear factor’ of the financial service industry that encourages Australians to stress about their retirement, via InvestorDaily.
A recently released report by the Grattan Institute, Money in Retirement: More than Enough, reveals that most Australians will be financially comfortable in retirement.
The report shows that retirees are less likely than working-age Australians to suffer financial stress and more likely to have extras like annual holidays.
Grattan Institute chief executive John Daley said that the institute’s models showed that Australians would actually be able to retire in comfort.
“The financial services industry ‘fear factory’ encourages Australians to worry unnecessarily about whether they’ll have enough money in retirement,” he said.
The Institute modelling, even allowing for inflation showed that workers today could expect a retirement income of 91 per cent of their pre-retirement income.
Grattan’s report called on the government to scrap the plan to increase compulsory contributions from 9.5 per cent to 12 per cent as most Australians would be comfortable in retirement.
The report instead called for a 40 per cent increase in the maximum rate of Commonwealth Rent Assistance and for a loosening of the Age Pension assets test which would boost retirement incomes for 70 per cent of future retirees.
The Association of Superannuation Funds of Australia denounced the report calling it an unprecedented attack on the retirement aspirations of ordinary Australians.
ASFA chief executive Dr Martin Fahy said the report was about two Australia’s, one with fully-funded, high-earning retirees and the rest with reliance on the state.
“The Grattan Institute wants to dismantle our world class retirement funding system and replace it with a model that has two thirds of the population relying on the Age Pension,” said Dr Fahy.
Dr Fahy also slammed the reports recommendation that the retirement age be raised to 70 and that the government reviewing the adequacy of Australians’ retirement incomes.
The institute’s report did recommend the government review the adequacy of Australians’ retirement income and called for a new standard.
“The Productivity Commission should establish a new standard for retirement income adequacy and assess how well Australians of different ages and incomes will meet that standard. References to the ASFA comfortable retirement standard should be removed,” the report read.
“The ASFA Retirement Standard provides a detailed account of living expenses in retirement.
“The Grattan analysis in effect wants people in retirement not to have heating in winter, not to take vacations, to get rid of the car, and skimp on prescriptions and other out-of-pocket health care costs,” said Dr Fahy.
The report for its part has said that reform is needed by the government to be able to fund aged care and health in the future.
“Unless governments have the courage to make these reforms, future budgets will not be able to fund aged care and health at the same level as today, which is the real threat to adequate retirement incomes in future,” it said.
How we fund retirement in an ageing century ought to worry all of us, via The Conversation.
But one group of us should be much more worried than the rest.
In a new set of research briefs published by the Centre of Excellence of Population Ageing Research, we report that most people do well out of our retirement income system and that the living standard of retirees has improved over the past decade.
In international comparisons, our system ranks highly, for good reason.
Most retirees do well
About 60% of older Australians can afford a lifestyle better than that deemed to be “modest” by widely used standards.
Households headed by baby boomers reaching retirement age between 2006 and 2016 did so with incomes 45% higher than those who retired a decade earlier.
Typical boomer households aged in their late 60s earn almost as much as they did when they were still working – only 20% less, that is, with about 80% of their working income maintained.
And their needs are lower. Lower spending in retirement is common because older households need to pay less for transport, less for working clothes, and have more time to cook.
When we included the value of living rent-free for the 80% or more of retirees who own their own home (about A$10,000 per year on average), we found older Australians live in no more poverty than working age Australians.
But not renters
The living standards of those who rent in retirement are very different. Only about 15% of older renters can afford a lifestyle better than “modest”.
Single renters are particularly badly off.
Among all older people only about 10% fall below the poverty line set at half the median income.
Among older Australians who rent, 40% fall below.
Among older Australians who rent alone, it’s more than 60%.
If that relative poverty measure seems too abstract, an absolute dollar figure might help.
Alarming research aired on the ABC in September found that, on average, aged care homes were spending $6.08 per day on food per resident.
Our research finds that among pensioners who rent alone, one quarter spend even less than that per day.
And it’s getting worse
The pension has always favoured home owners.
On the one hand it is insufficient for renters and on the other it doesn’t cut pension payments to the owners of very valuable homes, because the value of any home – no matter how big – is excluded from the pension means test.
Rental assistance, introduced to complement the pension in the 1980s, was meant to alleviate this, and to some extent it does.
But it climbs only in line with the consumer price index every six months, which usually fails to keep pace with rents.
Sydney rents have doubled over the past two decades. The consumer price index has climbed 68%.
As a result, rental assistance is less effective in reducing financial stress than it was when it was introduced, and is set to become even less effective if rents continue to climb more quickly than the price index.
And more of us look set to rent
Households headed by Australians aged 35 to 44 are now 10 percentage points less likely to own their own home than were households headed by people of the same age a generation earlier.
They might be merely postponing buying homes until they are older as more of what would have been their income is sequestered into super and they enter the workforce and retire later.
If so, they might end up owning and paying off homes by retirement at the same rate as boomer households did before them.
If not, more and more of them could end up in poverty in retirement.
Author: Rafal Chomik Senior Research Fellow, ARC Centre of Excellence in Population Ageing Research (CEPAR), UNSW
Following a review of the New South Wales Residential Tenancies Act 2010 in 2016 and extended consultations, the NSW government has introduced a number of reforms to parliament. Debate is expected to occur this week. However, without reform to current eviction proceedings, many housing advocates have expressed concern that these generally good proposals will have little effect. Today, 45 housing researchers from a range of disciplines have signed the following open letter.
We are academics who research and teach about housing. We come from a range of disciplines – for example law, economics, social sciences, planning – and many of us have worked variously with housing providers, tenants’ groups and government agencies on housing issues. We have in common commitment to the principle that everyone should have a secure, affordable home of decent standard, whether they own or rent.
Too often, however, our rental housing sector fails to deliver on this principle. There are numerous reasons for this; one of them is the legal insecurity of tenants under current New South Wales residential tenancy laws. In particular, the provision for landlords to give termination notices, with no grounds, at the end of a fixed-term tenancy or during a continuing tenancy is contrary to genuine security.
“No grounds” termination notices give cover for bad reasons for seeking termination, such as retaliation and discrimination. The prospect that a “no grounds” termination notice may be given hangs over all tenancies, discouraging tenants from raising concerns with agents and landlords and undermining the legal rights otherwise provided for by their leases and the legislation.
The deficiencies of our current laws are becoming worse, as more households rent, and rent for longer into their lives. About 32% of NSW households rent and this proportion is growing. Over the five years to 2016, 63% of the net growth in the number of NSW households was households in rental housing. And 42% of NSW renter households include children.
Our deficient current laws are also increasingly out of step with tenancy laws in comparable jurisdictions. Many European countries, as well as most of the Canadian provinces and the largest US cities, do not provide for “no grounds” terminations by landlords.
Last year, Scotland reformed its tenancy laws to remove provisions for “no grounds” terminations and replace them with prescribed reasonable grounds for termination. In Australia, Tasmania has for some years not allowed “no grounds” terminations of continuing tenancies. This month, the Victorian Parliament amended its residential tenancies legislation to remove provision for “no grounds” termination notices for continuing tenancies and for fixed-term tenancies, except at the end of the first fixed term.
We call on the NSW state government to improve security for renters, by legislating to end no-grounds termination by landlords and providing instead for a prescribed set of reasonable grounds for terminations.
These reasonable grounds would include grounds already in the legislation, such as rent arrears and other breaches by the tenant, and sale of the premises, as well as new grounds, such as where the landlord needs the premises for their own housing, and where the premises are to be renovated, demolished or changed to a non-residential use.
The prescribed reasonable grounds should have different notice periods, reflecting their different degrees of urgency and priority. Proceedings on notices should go, as they currently do, to the NSW Civil and Administrative Tribunal, and the tribunal should determine whether the ground exists and whether termination is justified in all the circumstances.
This reform would make all tenants feel more secure, without unduly restricting landlords in reasonable uses of their properties. The only inconvenience would be to the retaliators, the discriminators and those who cannot cope with even a modest level of accountability. If the reform prompted these landlords to leave the sector, they would sell to a new home owner or to a more professionally minded landlord – either of which is to the good.
There is more to be done across a range of policy areas to improve the functioning of all aspects of our housing system. We need more accessible home ownership, a differently structured and more professional market rental sector and a revitalised social housing sector. These changes require a comprehensive housing policy, coordinated across areas and levels of government and carried out over a long term.
But, in tenancy law, the single most important reform is ending “no grounds” termination by landlords. And the parliament could do it now.
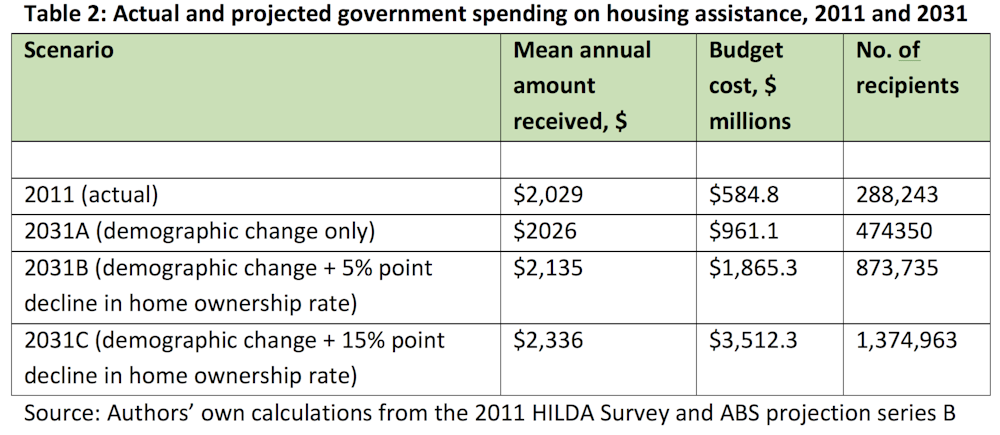
Until now, the majority of older people in Australia have achieved the goal of owning their own home outright. Hence, policymakers have typically shown little concern about the size and budget costs of rental housing assistance programs for seniors. However, two major societal shifts are set to propel such programs into the spotlight as a prominent government subsidy for older Australians.
The first trend is population ageing. We anticipate that baby boomers will place growing pressure on housing assistance programs as they age.
A second shift – falling rates of home ownership – could further increase the demands on the housing system. The HILDA Survey reveals rates of home ownership have fallen from 72% in 2001 to 66% in 2016.
Estimates from the ABS Surveys of Income and Housing show that from 1982 to 2013 the home ownership rate fell 7.3 percentage points among the 45-54 age group. It fell by 5.1 percentage points for the 55-64 age group.
These trends are likely to continue.
A growing divide among older Australians
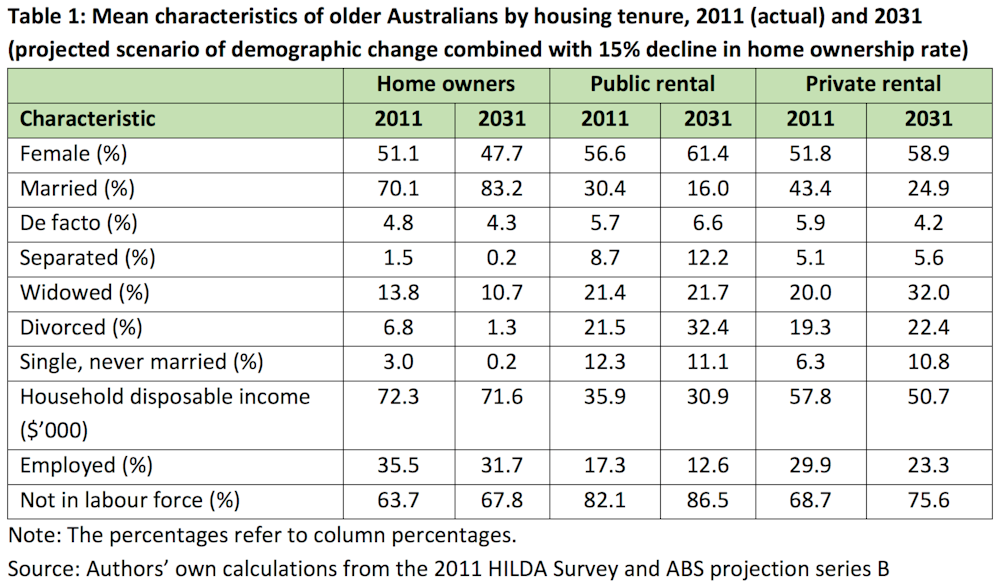
To analyse the implications of these shifts, we forecast the changing profile of Australians aged 55 and over by housing tenure. We apply demographic projections to the 2011 HILDA Survey and describe tenure profiles based on hypothetical declines of 5 and 15 percentage points in home ownership rates by 2031, as well as a stagnant stock of public housing.
Our findings point to a growing divide among older Australians. For older Australians, home ownership will increasingly become the preserve of higher-income married couples (see table 1). Older people on lower incomes – especially women and those affected by marital breakdown or bereavement – will rent.
The divide is especially stark if the home ownership rate falls by 15 percentage points. In this scenario, 27.4% of people aged 55 and over will be private renters by 2031.
Budget impacts of housing assistance
Older Australians’ demand for housing assistance could spike as a result of population ageing and falling home ownership rates.
Even demographic change on its own would lift real government spending on housing assistance for Australians aged 55 and over by 64% by 2031 (see table 2).
If home ownership rates also decline by 5 percentage points, then real government spending is projected to blow out to three times its 2011 level.
A steep fall in the home ownership rate of 15 percentage points would send real government spending on housing assistance soaring to around six times the 2011 level. That would increase real spending on housing assistance for older Australians from a tiny 0.043% of real GDP in 2011 to 0.16% of forecast real GDP in 2031.
The implications of demographic change coupled with falling home ownership rates are obvious for the housing sector:
the private rental tenure is set to expand
demand for housing assistance will grow
spending on housing assistance programs will increase the strain on government budgets.
Challenges beyond housing policy
There are also important ramifications for retirement incomes policy. The age pension system assumes most Australians will retire as outright home owners with no mortgage payments to meet. They can therefore get by on low age pensions. But growing numbers of older renters struggling to meet rental payments will call into question the adequacy of our age pension benefits.
There is an alternative scenario. By 2031, the superannuation system will have matured. Growing numbers of older renters – especially those with steady employment records – could accumulate big enough balances in defined contribution schemes to become home buyers in later life.
Dipping into superannuation savings to finance a home purchase is attractive on various fronts:
it offers the prospect of secure and affordable housing in old age
under aged care assets test rules, the equity stored in what was an aged care client’s family home is either exempt from the assets test (if a spouse or dependent children is still living in the home), or subject to a cap ($165,271.20 as at March 20 2018), and is not assessed for age care deeming purposes.
On the other hand, superannuation balances are an assessable asset under age pension and aged care assets test provisions, as well as for age pension and aged care deeming purposes.
Should growing numbers of Australians approach retirement as renters these anomalies offer them potentially powerful motives to substitute assets away from superannuation and into owner-occupied housing in later life. But, in doing so, they could undermine a key objective of Australia’s superannuation guarantee – that of promoting financial independence and reducing reliance on public pensions in old age.
Authors: Rachel Ong ViforJ Professor of Economics, School of Economics, Finance and Property, Curtin University; Gavin Wood Emeritus Professor of Housing and Housing Studies, RMIT University; Melek Cigdem-Bayram Research Fellow, RMIT University
RBA Assistant Governor, Financial System, Michele Bullock discussed household debt in a recent speech. She concludes that “Household debt in Australia has risen substantially relative to income over the past few decades and is now at a high level relative to international peers. This raises potential vulnerabilities in both bank and household balance sheets. While the risks are high, there are a number of factors that suggest widespread financial stress among households is not imminent. It is nevertheless an area that we continue to monitor closely”. She included comments on households in regional areas, who are often overlooked in discussion.
She shows that housing debt is the main issue, that risks vary across households (and income bands), and that on an international comparison basis we are right up there. Household debt-to-income ratio has increased more than for many other countries.
Also she cites HILDA data up to wave 16. The fieldwork for this report was conducted between 2001 and 2016. So not very current in my view! Perhaps the current risks are higher thanks to continued poor lending practice, flat incomes and rising costs. Our mortgage stress data suggests this.
Household debt in Australia has been rising relative to income for the past 30 years (Graph 1). This graph shows the total household debt-to-income for Australia from the early 1990s until this year. Over that time it has risen from around 70 per cent to around 190 per cent. There are three distinct periods. The first, from the early 1990s until the mid-2000s, saw the debt-to-income ratio more than double to 160 per cent. Then there was a period from around 2007 to 2013 when the ratio remained fairly steady at 160 per cent. Finally, since 2013, the debt-to-income ratio has been rising again, reaching 190 per cent by 2018.
Graph 1
Australia has not been unique in seeing debt-to-income ratios rise. The median debt-to-income ratio for a range of developed economies has also risen over the past 30 years. But the Australian debt-to-income ratio has risen more sharply. In fact, Australia has moved from having a debt-to-income ratio lower than around two thirds of countries in the sample to being in a group of countries that have debt-to-income ratios in the top quarter of the sample. This suggests that there are both international and domestic factors at play when it comes to debt-to-income ratios.
There are two key international factors that have tended to increase the ability of households in developed countries, including Australia, to take on debt over the past few decades. The first is the structural decline in the level of nominal interest rates over this period, partly reflecting a decline in inflation but also a decline in bank interest rate margins as a result of financial innovation and competition. With lower interest payments, borrowers could service a larger loan. The second is deregulation of the financial sector. Through this period, the constraints on banks’ lending were eased significantly, allowing credit constrained customers to access finance and banks to expand their provision of credit.
But as noted, in Australia the household debt-to-income ratio has increased more than for many other countries. The increase in household debt over the past few decades has been largely due to a rise in mortgage debt. And an important reason for the high level of mortgage debt in Australia is that the rental stock is mostly owned by households. Australians borrow not only to finance their own homes but also to invest in housing as an asset. This is different to many other countries where a significant proportion of the rental stock is owned by corporations or cooperatives (Graph 2). This graph shows for a number of countries the share of dwellings owned by households on the bottom axis and the average household debt-to-income ratio on the vertical axis. There is a clear tendency for countries where more of the housing stock is owned by households to have a higher household debt-to income-ratio.
Graph 2
Potential vulnerabilities
This high level of household debt relative to income raises two potential vulnerabilities. First, because mortgage lending is such an important part of bank balance sheets in Australia, any difficulties in the residential mortgage market could translate to credit quality issues for banks (Graph 3). And since all of the banks have very similar balance sheet structures, a problem for one is likely a problem for all. This graph shows the share of banks’ domestic credit as a share of total credit over the past couple of decades. Australian banks have substantially increased their exposure to housing over this period and housing credit now accounts for over 60 per cent of banks’ loans. So the Australian banking system is potentially very exposed to a decline in credit quality of outstanding mortgages.
Graph 3
The risk that difficulties in the residential real estate market translate into stability issues for the financial institutions, however, appears to be currently low. The Australian banks are well capitalised following a substantial strengthening of their capital positions over the past decade. While lending standards were not bad to begin with, they have nevertheless tightened over the past few years on two fronts. The Australian Prudential Regulation Authority (APRA) has pushed banks to more strictly apply their own lending standards. And APRA has also encouraged banks to limit higher risk lending. Lending at high loan-to-valuation ratios has declined as a share of total loans, providing protection against a decline in housing prices for both banks and households. And for loans that continue to be originated at high loan-to-valuation ratios, the use of lenders’ mortgage insurance protects financial institutions from the risk that borrowers are unable to repay their loans. Overall, arrears rates on housing loans remain very low.
But the second potential vulnerability – from high household indebtedness – is that if there were an adverse shock to the economy, households could find themselves struggling to meet the repayments on these high levels of debt. If they have little savings, they might need to reduce consumption in order to meet loan repayments or, more extreme, sell their houses or default on their loans. This could have adverse effects on the real economy – for example, in the form of lower economic growth, higher unemployment and falling house prices – which could, in turn, amplify the negative shock.
So what do the data tell us about the ability of households to service their debt? This graph shows the ratio of household mortgage debt to income (a subset of the previous graph on household total debt) on the left hand panel and various serviceability metrics on the right hand panel (Graph 4). The mortgage debt-to-income ratio shows the same pattern as total household debt-to-income – rising up until the mid-2000s then steadying for a few years before increasing again from around 2013. The dashed line represents the total mortgage debt less balances in ‘offset’ accounts. This shows that taking into account these ‘buffers’, the debt-to-income ratio has still risen, although not by as much. So households in aggregate have some ability to absorb some increase in required repayments.
Graph 4
In terms of serviceability, interest payments as a share of income rose sharply from the late 1990s until the mid-2000s reflecting both the rise in debt outstanding as well as increases in interest rates. Interest payments as a share of disposable income doubled over this period. Since the mid-2000s, however, interest payments as a share of income have declined as the effect of declines in interest rates have more than offset the effect of higher levels of debt. Indeed even total scheduled payments, which includes principal repayments, are lower than they were in the mid-2000s, as the rise in scheduled principal as a result of larger loans was more than offset by the decline in interest payments.
The risks nevertheless remain high and it is possible that the aggregate picture is obscuring rising vulnerabilities for certain types of households. Interest payments have been rising as a share of income in recent months, reflecting increases in interest rates for some borrowers, particularly those with investor and interest-only loans. Scheduled principal repayments have also continued to rise with the shift towards principal-and-interest, rather than interest-only, loans. There are therefore no doubt some households that are feeling the pressure of high debt levels. But there are a number of reasons why the situation is not as severe as these numbers suggest.
First, the economy is growing above trend and unemployment is coming down. While incomes are still growing slowly, good employment prospects will continue to support households meeting their repayment obligations. Second, as noted earlier, households have taken the opportunity over the past decade to build prepayments in offset accounts and redraw facilities. In fact, despite the continuing rise in scheduled repayments, actual repayments relative to income have remained quite steady as the level of unscheduled repayments of principal has declined and offset the rise in scheduled repayments. Third, as noted earlier, lending standards have improved over the past few years, resulting in an improvement in the average quality of both banks’ and households’ balance sheets. Much slower growth in investor lending, and declining shares of interest-only and high-loan-to-valuation lending have also helped to reduce the riskiness of new lending. And at the insistence of the regulator, banks have been tightening their serviceability assessments. In addition, strong housing price growth in many regions over recent years will have lowered loan-to-valuation ratios for many borrowers. As noted earlier, arrears rates remain very low.
The discussion above has focussed on the average borrower but what about the marginal borrower? For example, will the tightening standards result in some households being constrained in the amount they can borrow with flow-on effects to the housing market and the economy? Our analysis suggests that while we should remain alert to this possibility, it seems unlikely to result in a widespread credit crunch. The main reason is that most households do not borrow the maximum amount anyway so will not be constrained by the tighter standards. While the changes to lending standards have tended to reduce maximum loan sizes, this has primarily affected the riskiest borrowers who seek to borrow very close to the maximum loan size and this is a very small group. Most borrowers will still be able to take out the same sized loan.
It has also been suggested that the expiry of interest-only loan terms will result in financial stress as households have to refinance into principal-and-interest loans that require higher repayments. Again, this is worth watching, but borrowers have been transitioning loans from interest-only to principal-and-interest for the past couple of years without signs of widespread stress. Our data suggest that most borrowers will either be able to meet these higher repayments, refinance their loans with a new lender, or extend their interest-only terms for long enough to enable to them to resolve their situation. There appears to be only a relatively small share of borrowers that are finding it hard to service a principal-and-interest loan, which is to be expected given that over recent years, serviceability assessments for these loans have been based on the borrower’s ability to make principal-and-interest repayments. So far, the evidence suggests that the transition of loans from interest-only to principal-and-interest repayments is not having a significant lasting effect on banks’ housing loan arrears rates.
The distribution of household debt
So far, I have focussed on data for the household sector as a whole. But an important aspect of considering the risks inherent in household debt is the distribution of that debt. If most of the debt is held by households with lower or less stable income for example, it will be more risky than if a substantial amount of the debt is held by households with higher or more stable income. In this respect, the data suggest that we can have some comfort. This graph shows the shares of household debt held by income quintiles – the bottom 20 per cent of incomes, the next 20 per cent and so on up to the top 20 per cent of incomes (Graph 5). And it shows how these shares have changed from the early 2000s until 2015, the latest period for which the data are available. Around 40 per cent of household debt is held by households that are in the top 20 per cent of the income distribution and this share has remained fairly steady for the past 20 years. Furthermore, households in the second highest quintile account for a further 25 per cent of the debt. So in total two-thirds of the debt is held by households in the top 40 per cent of the income distribution. Nevertheless, around 15 per cent of the debt is held by households in the lowest two income quintiles. Whether or not this presents risks is not clear. Retirees are typically captured in these lower income brackets and if this debt is connected with investment property from which they are earning income, it may not be particularly risky.
Graph 5
Another potential source of risk in the distribution of debt is the age of the head of the household. As noted, a regular, stable income is important for servicing debt so people in the middle stages of their careers typically have better capacity to take on and service debt. The next graph shows the shares of debt for various age groups for owner occupiers, and how they have moved over the past couple of decades (Graph 6).
Graph 6
Households in which the head is between the ages of 35 and 54 account for around 60 per cent of the debt. But there does appear over time to be a tendency for a higher share of owner occupier debt to be held by older age groups. In part, the growing share reflects structural factors like lower interest rates. More importantly, it is not clear whether the higher share of debt increases the risk that these households will experience financial stress. On the one hand, it might indicate that in recent years, people have been unable to pay down their debt by the time they retire. If they continue to have large amounts of debt at the end of their working life, they might therefore be vulnerable. On the other hand, people are now remaining in the workforce for longer, possibly a response to better health and increasing life expectancies. They also hold more assets in superannuation and have more investment properties. This improves their ability to continue to service higher debt. And there is no particular indication that older people have higher debt-to-income or debt servicing ratios than younger workers.
So while the economy wide household debt-to-income ratio is high and rising, the distribution of that debt suggests that a large proportion of it is held by households that have the ability to service it. It nevertheless bears watching.
Regional dimensions
I thought I would finish off with some remarks about regional versus metropolitan differences. From a financial stability perspective, we are mainly focussed on the economy as a whole. But we still need to be alert to pockets of risk that have the potential to spill over more broadly. These risks may have important regional dimensions, particularly to the extent that individual regions have less diversified industrial structures and are thus more vulnerable to idiosyncratic shocks. One recent example has been the impact of the downturn in the mining sector on economic conditions in Western Australia, and the subsequent deterioration in the health of household balance sheets and banks’ asset quality. The potential for the drought in eastern Australia to result in household financial stress is another.
Data limitations make it difficult to drill down too far into particular regions. So I am going to focus here on a general distinction between metropolitan areas and the rest of Australia. As noted above, there tends to be a relationship between debt and housing prices. As housing prices rise, people need to borrow more to purchase a home and with more ability to borrow, people can bid up the prices of housing. So one place to look for a metro/regional distinction might be housing prices.
While there is clearly a difference in the absolute level of housing prices in cities and regional areas, over the long sweep, movements in housing prices in the regions have pretty much kept up with those in capital cities (Graph 7). This graph shows an index of housing prices for each of the states broken down into capital city and rest of the state. While there are periods where growth in housing prices diverge, most obviously in NSW and Victoria in recent years, they follow a very similar pattern. This partly reflects the fact that some cities that are close to the capitals tend to experience similar movements in house prices as the capitals.
Graph 7
What about housing debt in regional areas? The data suggest that the incidence of household indebtedness is broadly similar in the capital cities and in the regions (Graph 8). In 2015, the latest year for which we have data, around 50 per cent of regional households were in debt compared with around 45 per cent of households in capital cities. But in previous years this was reversed. At a broad level, the proportion of households in debt seems fairly similar.
Graph 8
Incomes and housing prices tend to be lower on average in regional areas than cities so we might expect debt to also be lower. But how do debt-to-income ratios compare? This next graph shows debt-to-income ratios for cities and regional areas at various points over the past 15 years (Graph 9). In general, average debt-to-income ratios for indebted households in capital cities tend to be a bit higher than those for indebted households in regional Australia. But it is not a huge difference and it mostly reflects the fact that people with the highest incomes – and therefore, higher capacity to manage higher debt-to-income ratios – tend to be more concentrated in cities. In general, it seems that regional households’ appetite for debt is very similar to that of their city counterparts.
Welcome to the Property Imperative weekly to 8th September 2018, our digest of the latest finance and property news with a distinctively Australian flavour.
And by the way, if you value the content we produce please do consider joining our Patreon programme, where you can support our ability to continue to make great content.
Watch the video, listen to the podcast, or read the transcript.
The big news this week was that after Westpac blinked last week, ANZ then CBA both lifted their standard variable mortgage rates for existing borrowers by 16 and 15 basis points (or 0.16% and 0.15% respectively). This was exactly as I had predicted. They both blamed the rising interbank funding rates, claimed that mortgage rates were still lower than three years ago, and that though it was regrettable, the impact would be minimal.
Let’s be clear, existing borrowers are being caned, and whilst some may be able to shop around for a new loan at those attractive teaser rates, many cannot so they are being milked. And there are more rises to come in my opinion.
To put this in perspective, on a typical mortgage this represents an extra $35 a month, but if you are sitting on a big Sydney or Melbourne mortgage it could be much more. We discussed the shift in rates on our posts this week, including “More Bank’s Follow Suit”, and our discussions with people on the industry front line, including Sally Tindal from RateCity and Mandeep Sodhi from HashChing.
NAB of course has not followed the herd so far, so it will be interesting to see whether they will. But the main point to make is this is just another burden on borrowing households at a time when according to our surveys, household finances remain under pressure.
On Tuesday, leaving the cash rate unchanged, the RBA said” One continuing source of uncertainty is the outlook for household consumption. Household income has been growing slowly and debt levels are high”; and last week “the main risks to financial stability will most likely continue to relate to credit quality. Notably, banks’ large exposure to a potential deterioration in housing loan performance is expected to remain a key issue”.
Our analysis of household finance confirms this and the latest responsible lending determinations, where Westpac agreed to pay a very small $35m civil penalty also highlight the issues. Their mortgage hikes will more than cover the penalty.
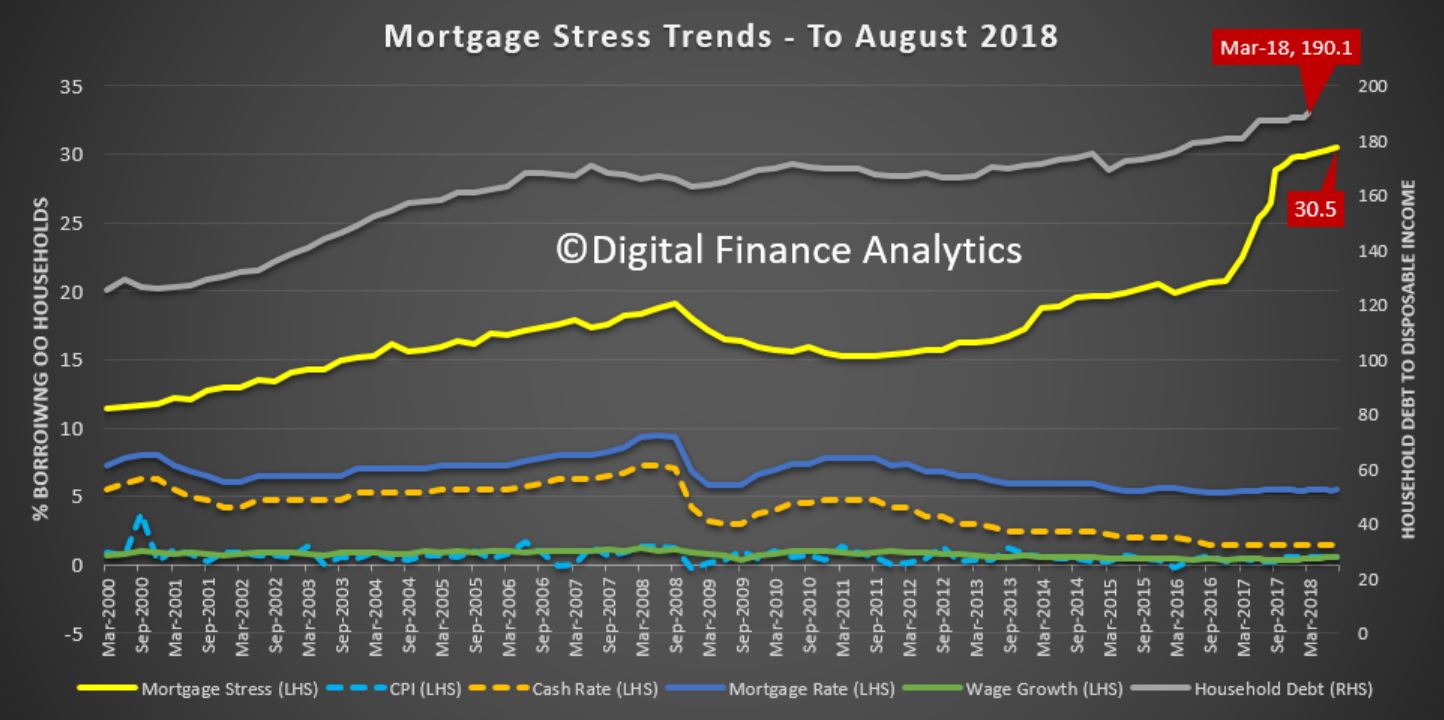
So no surprise to see mortgage stress continuing to rise. Across Australia, more than 996,000 households are estimated to be now in mortgage stress (last month 990,000). This equates to 30.5% of owner occupied borrowing households. In addition, more than 23,000 of these are in severe stress. We estimate that more than 59,000 households risk 30-day default in the next 12 months. We continue to see the impact of flat wages growth, rising living costs and higher real mortgage rates. Bank losses are likely to rise a little ahead. You can watch our show “August 2018 Mortgage Stress Update” for more details. We also did a number of radio interviews on this.
And have no doubt the credit crunch continues to intensify. The latest ABS lending data for July showed a fall in investor mortgages, and a slowing of first time buyers and owner occupied lending. In fact, apart from a small rise in construction finance, all indicators were down. We discussed this in our post “More Negative Lending Indicators”.
Pile on the reduction of borrowing power of households by as much as 40%, the number of refinanced applications being rejected, still running at 40%, so creating mortgage prisoners now that the banks are finally obeying the lending law, plus property investors now seeing capital being eroded, all this combined means lending will be compressed, and this in turn will drive home prices lower. The latest data shows both home prices and auction clearances are still failing.
One other observation worth making. Though hardly reported, the ABS released their June 2018 data relating the securitised loans in Australia “Assets and Liabilities of Australian Securitisers“. It showed that in the past year residential mortgages securitised rose by 8.9% to $108.8 billion. Overall securitised assets rose by 8.2%, which shows mortgage assets grew stronger than system.
This reflects what we have seen in the market with non-bank and some bank lenders using this funding channel. The rise of non-bank securitisation is a significant element in the structure of the market. As major lenders throttle back their lending standards, higher risk loans are moving into the non-bank and securitised sectors. Of course a decade ago it was the securitised loans which took lenders down in the US and Europe.
The growth we are seeing here is in our view concerning, bearing in mind the more limited regulatory oversight. Plus. on the liabilities side of the balance sheet, around 90% of the securities are held by Australian investors, a record.
This includes a range of sophisticated investors, including super funds, wealth managers, banks, and high-net worth individuals. But the point to make is that if home price falls continue, the risks in the securitised pools will grow, and this risk is fed back to the investor pools.
This is yet another risk-laden feedback loop linked to the housing sector, and one which is not fully disclosed nor widely understood. The fact that the securitised pools are rated by the agencies does not fill me with great confidence either!
Even the broader economic data, which showed that Australian economy grew 0.9 per cent in seasonally adjusted chain volume terms in the June quarter 2018, showed that new dwelling investment continued to prop up the numbers, along with government and domestic consumption.
But the two key, and concerning trends are a significant fall in the households’ savings ratio (as they dip into them to support their spending), and the slower GDP per capita growth, which shows that much of the GDP momentum is simply population related. This is based in trend data.
Plus, real national disposable income per capita fell by 0.2% over the quarter though it was up 2.1% over the year. Worse, the real average compensation per employee fell another 0.4% in the year to June 2018 to be 4.2% lower since March 2012. And average remuneration per employee rose by only 1.7% in the year to June, so remains underwater after adjusting for inflation (2.1%). Households remain under the gun. Economist John Adams and I discussed this in our show “A Disastrous Set of Results”.
Of course GDP is a really poor set of measures by which to assess the economy in any case….
One emerging question is the real risks in the banks’ mortgage portfolios as home values fall, and poor lending practices are revealed.
UBS said this week in their latest Australian Banking Sector Update, which involved an anonymous survey of 1,008 consumers, there was a “sharp fall” in the number of “misstatements” reported in mortgage applications over the fourth quarter of 2018 (4Q18). The survey revealed that 76 per cent of respondents reported that the mortgage applications were “completely factual and accurate”, up from 65 per cent throughout the first three quarters of 2018. According to UBS, the improvement in lending standards was largely driven by the scrutiny placed on the industry by the Royal Commission into Misconduct in the Banking, Superannuation and Financial Services Industry, and not off the back of regulatory intervention.
Despite the improvement, UBS claimed that it’s concerned about the 10 per cent of respondents that reported that their broker-originated applications were “partially factual and accurate”, which it considers a “low benchmark”. Moreover, UBS stated that it continues to find that a “substantial number of applicant’s state that their mortgage consultant suggested that they misrepresent on their mortgage applications”. According to the figures, of those who misstated their broker-originated loan applications, 40 per cent said that their broker suggested that they misrepresent their application, which UBS claimed implies that 15 per cent of all mortgages secured via the broker channel were “factually inaccurate following the suggestion of their broker”.
“This is concerning given the heightened scrutiny on the industry, in particular following findings of broker misconduct and broker fraud in the royal commission,” UBS added.
There was an important video out this week, courtesy of the CEC in which Denise Brailey of the Banking and Finance Consumers Support Association (BFCSA), a real consumers champion, discussed mortgage fraud in the system. To cut to the chase, she says that many lenders deliberately built systems and processes to trick customers into loans they should never had got. The central issue is the way the Loan Application Form (LAF) was used. But she also touches on the cultural issues and fake statistics endemic in the system. You can watch the whole story. It is frankly disturbing.
Add to the substantial “liar loans” issue, the fact home price values continue to fall, and funding costs are rising, and we conclude the risks to the banking system are significant. Yet the regulators and bank auditors are not in our view doing their job. As more of this is exposed, expect bank share prices to slide further.
The ASX 200 was down 0.27% on Friday, to 6,144, having reacted to the latest GDP numbers and the bank mortgage repricing. CBA ended the week at 70.5 up 0.53% but was down on recent numbers. Westpac ended at 27.80 down 0.14% and only slightly above the low of 27.30. ANZ was also lower at 28.40, down 0.46%. Expect more downside, as the Royal Commission reports, and more mortgage related issues emerge.
The Aussie fell against the US Dollar, down 1.29% to 71.05 A New Low. While AUD/USD’s descent was not as potent as last week, the pair breached under the December and May 2016 lows below 71.452. Technically, its now cleared to descend to the January 2016 lows at 68.274.
Indeed, not only broken through 71.452, but it also fell under a descending range of support which helped control its decline since May. However, the pair stopped just short of the 61.80% Fibonacci extension at 70.888 which might as well stand as immediate support going forward.
The push through range support also marked the pair’s single largest decline in a day since August 23rd which was over two weeks ago. If the dominant downtrend in AUD/USD once again resumes, a push under 70.888 exposes the 78.6% Fibonacci extension at 70.092.
Meanwhile, near-term resistance is a combination of the December/May 2016 lows and the descending range. Pushing above 71.60 then opens the door to testing the 38.2% extension at 72.007 followed by the 23.6% level at 72.699. With that in mind, the descent through key support levels prolongs the bearish AUD/USD technical outlook.
Moody’s said this week The U.S. economy and financial markets have been pulling away from the rest of the world. Of special importance is the lagging performance of emerging market economies, which, not too long ago, had been the primary driver of world economic growth. The combination of higher U.S. interest rates and the relatively stronger performance of the U.S. economy has triggered a notable and potentially destabilizing appreciation of the dollar versus a host of emerging market currencies.
Excluding the collapse of Venezuela’s currency, other noteworthy appreciations by the dollar since yearend 2008 include the dollar’s 102% surge against Argentina’s peso, the 74% advance in terms of Turkish lira, the 25% climb versus Brazil’s real, the 24% ascent against South Africa’s rand, the 15% increase versus India’s rupee, the 10% climb in terms of Indonesia’s rupiah, and the 11% increase vis-à-vis Pakistan’s rupee.
Emerging market countries having especially large current account deficits relative to GDP are vulnerable to dollar exchange rate appreciation. The funding of large current account deficits requires large amounts of foreign-currency debt that is often denominated in U.S. dollars. As the dollar appreciates vis-à-vis emerging market currencies, it becomes costlier to service dollar-denominated debt in terms of emerging market currencies.
So to the US markets, where the Dow Jones Industrial Average fell 0.31%, to 25,917 while the S&P 500 ended at 2,871, down 0.22%. On the corporate news front, Tesla stock dropped 6.3% after Chief Accounting Officer Dave Morton resigned as the “the level of public attention placed on the company,” prompted him to rethink his future. It ended at 263.24
Gripped by fear the United States and China are heading further down the path toward a full-blown trade war, investors reined in their bets on riskier assets like stocks, pressuring the broader averages. With the administration already expected to impose tariffs on $200 billion worth of goods from China, Trump upped the ante on trade, threatening levies on another $267 billion of goods. The levies on the list of goods could reportedly cover a wide range of products from popular tech companies, including Apple, according to Bloomberg. Apple later confirmed in a letter that the tariffs would affect the Apple Watch, AirPods and Apple Pencil.
“It is difficult to see how tariffs that hurt U.S. companies and U.S. consumers will advance the Government’s objectives with respect to China’s technology policies,” Apple said in the letter.
Apple Inc. fell 0.81% to 221.30 fell on the news, exerting further pressure on the beaten-up tech sector. The NASDAQ slide further, down 0.25% to 7.903 and twitter continued its fall, down 1.04% to 30.49 as a number of the big social media tech stocks were hit after testaments to congress on election interference and moderating content, including charges of censorship.
There were also no new developments as Canada negotiated with the U.S. about a revamp of NAFTA.
The U.S. employment report for August augured strong economic growth. But markets were spooked by an acceleration in wage inflation, which boosted expectations for the Federal Reserve to hike rates twice more this year. Beyond the creation of 201,000 jobs in August and a jobless rate holding near 18-year lows, at 3.9% the focus was on the 2.9% increase in wage inflation, its fastest since April 2009. Although a quarter-point rate hike was already fully priced in for the Sept. 25-26 Fed meeting, odds for an additional increase in December rose to about 76% compared to 70% ahead of the report.
Energy, meanwhile, did little to stem losses in the broader market after ending the day roughly unchanged, as oil prices were pressured by a rising dollar and concerns about oil-demand growth, amid rising trade tensions. On the New York Mercantile Exchange crude futures for October delivery settled at $67.84 a barrel, towards the top the price range. Gold was down 0.21% to 1,202, driven by strength of the US dollar, despite rumours of buying by a number of central banks, including China.
Bitcoin dropped on Friday down 1.31% to 6,420, having plunged from 7385 to 6830, or 7.5%, on Wednesday in reaction to a Business Insider report that Goldman Sachs as decided to drop a year-ago decision to create a crypto-currency trading desk. Apparently Goldman is “uncertain” about the regulatory environment.
Before I go, a couple of reminders, first is that next Sunday 16th September Nine’s 60 Minutes will be running a segment on the outlook for the Property Market. You may recall I was in Sydney a couple of weeks back for a recording. A couple of days ago they came back to get some additional material, as the market is evolving so quickly. It will be interesting to see how they tell the story.
Next we will be launching our new series on the capital markets next week, where we will look at the concepts of the time value of money, bonds and derivatives. Given the size of these markets, and the risks embedded within them, this will be an important series.
And finally, our next live stream Q&A event is scheduled for Tuesday 18th September at 20:00 Sydney, you can set a reminder and also send me questions ahead of time. We will be looking in detail at the property market in the session. I look forward to your questions in the live chat.
If you value the content we produce please do consider joining our Patreon programme, where you can support our ability to continue to make great content.
Australian women are missing opportunities to optimise their credit health and make themselves look good to lenders, according to research from consumer education website, CreditSmart.
The study was conducted online between 15-18 March 2018, with a sample size of 1,026 of Australians aged 18 years and older throughout Australia, out of which 51% of the sample were women.
A huge 89% of women are unaware of changes currently happening in the credit reporting system, and a third of these feel the changes will not impact them in any way. A quarter of Australian women are completely unaware of what a credit score is, and 65% have never checked their credit report.
Rebecca Murray, General Manager of Australian Retail Credit Association (ARCA), which founded CreditSmart, said the results showed a worrying gap in women’s knowledge of their credit health.
It is really important for women to be across these upcoming changes, so they can take advantage of the changes rather than potentially be negatively impacted”, Ms Murray said.
“Going forward, your credit report will become a personal asset which will hold you in good stead for when you need to take out a loan, as lenders will be able to track your account repayment habits on your accounts to assess your creditworthiness,” Ms Murray said.
It is important to understand that your credit score and credit report are both indicators of your credit health. Our research found that men are overall 10% more likely to check their credit report compared to women.
The research, undertaken by YouGov Galaxy, was done ahead of important changes to Australia’s credit reporting system which will see lenders move to comprehensive credit reporting (CCR). As part of this, the Government has introduced legislation that will mean the four major banks will be required to supply half of their customers’ comprehensive credit reporting data with credit reporting bodies by this September and the rest by September 30 next year, to ensure lenders have a complete picture when those individuals apply for credit.
Optimise your credit health
CreditSmart research found that 55% of women either don’t know or have incorrect perceptions on the cost of accessing a copy of their credit report.
Ms Murray stresses the importance of knowing your credit rights, which includes free access to your credit report annually from each of the credit reporting bodies.
“How to use credit responsibly is everybody’s business, irrespective of gender. People with good credit health will be rewarded with more choices of loan products and possibly lower interest rates, so get to know your credit report, fix it if there is something wrong and pay your accounts on time to get the credit you want, when you need it,” she added.
For information on how to optimise your credit health, Ms Murray suggested women should go to the CreditSmart website (http://www.creditsmart.org.au), set up by credit experts to help you understand how recent credit reporting reforms affect you.
CreditSmart has five top tips for keeping your credit report healthy:
Know what’s on your credit report: You can get a free copy of your credit report annually from each of the three main credit reporting bodies Experian, Illion (formerly Dun & Bradstreet), and Equifax.
Keep track of your credit score: Your credit score is like a summary of what’s on your credit report and can give you a quick indication of how credit providers see you. For free credit scores you can refer to CreditSmart.
Don’t let forgetfulness make you miss payments: Talk to your credit provider about setting up an automatic payment, i.e. direct debit, to make sure your regular payments are paid on time.
Fix anything that is incorrect: If you think something is incorrect, you can ask any credit provider or credit reporting body for help to fix that error, so long as they hold some kind of personal credit information about you. This is a free service.
Only borrow what you need: Having too much credit may make it harder for you to get credit for what you really need. If you have more credit than you can comfortably afford, try to close any accounts that you don’t use or decrease your credit limit. Your credit report will show credit providers how much credit you have available, even if you don’t use it.