From The US Conversation.
On July 12, President Trump’s Council of Economic Advisers concluded that America’s long-running war on poverty “is largely over and a success.”
 While the council’s conclusion makes for a dramatic headline, it simply does not align with the reality of poverty in the U.S. today.
What is poverty?
The U.S. federal poverty line is set annually by the federal government, based on algorithms developed in the 1960s and adjusted for inflation.
In 2018, the federal poverty line for a family of four in the contiguous U.S. is $25,100. It’s somewhat higher in Hawaii ($28,870) and Alaska ($31,380).
However, the technical weaknesses of the federal poverty line are well known to researchers and those who work with populations in poverty. This measure considers only earned income, ignoring the costs of living for different family types, receipt of public benefits, as well as the value of assets, such as a home or car, held by families.
Most references to poverty refer to either the poverty rate or the number of people in poverty. The poverty rate is essentially the percentage of all people or a subcategory who have income below the poverty line. This allows researchers to compare over time even as the U.S. population increases. For example, 12.7 percent of the U.S. population was in poverty in 2016. The rate has hovered around 12 to 15 percent since 1980.
Other discussions reference the raw number of people in poverty. In 2016, 40.6 million people lived in poverty, up from approximately 25 million in 1980. The number of people in poverty gives a sense of the scale of the concern and helps to inform the design of relevant policies.
Both of these indicators fluctuate with the economy. For example, the poverty population grew by 10 million during the 2007 to 2009 recession, equating to an increase of approximately 4 percent in the rate.
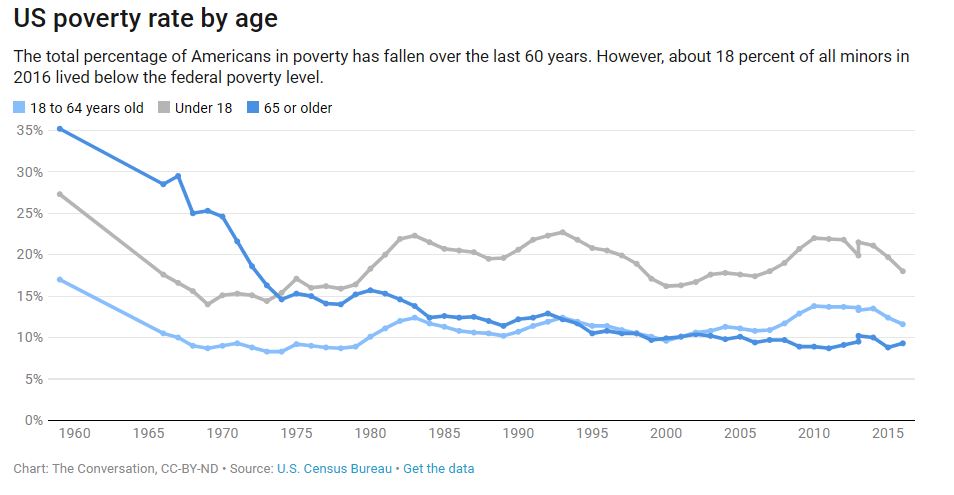
The rates of poverty over time by age show that, while poverty among seniors has declined, child poverty and poverty among adults have changed little over the last 40 years. Today, the poverty rate among children is nearly double the rate experienced by seniors.
 The July report by the Council of Economic Advisers uses an alternate way of measuring poverty, based on households’ consumption of goods, to conclude that poverty has dramatically declined. Though this method may be useful for underpinning an argument for broader work requirements for the poor, the much more favorable picture it paints simply does not reconcile with the observed reality in the U.S. today.
Deserving versus undeserving poor
Political discussions about poverty often include underlying assumptions about whether those living in poverty are responsible for their own circumstances.
One perspective identifies certain categories of poor as more deserving of assistance because they are victims of circumstance. These include children, widows, the disabled and workers who have lost a job. Other individuals who are perceived to have made bad choices – such as school dropouts, people with criminal backgrounds or drug users – may be less likely to receive sympathetic treatment in these discussions. The path to poverty is important, but likely shows that most individuals suffered earlier circumstances that contributed to the outcome.
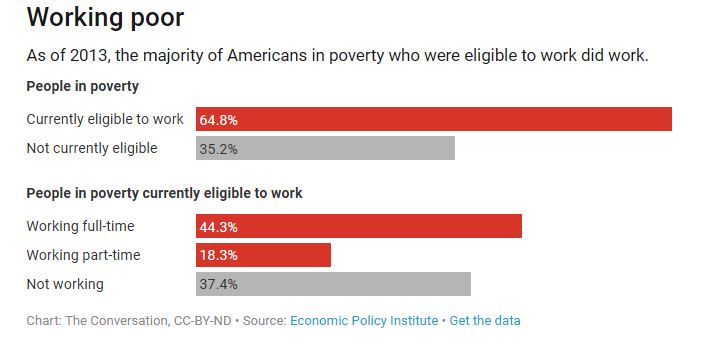
Among the working-age poor in the U.S. (ages 18 to 64), approximately 35 percent are not eligible to work, meaning they are disabled, a student or retired. Among the poor who are eligible to work, fully 63 percent do so.
Earlier this year, lawmakers in the House proposed new work requirements for recipients of SNAP and Medicaid. But this ignores the reality that a large number of the poor who are eligible for benefits are children and would not be expected to work. Sixty-three percent of adults who are eligible for benefits can work and already do. The issue here is more so that these individuals cannot secure and retain full-time employment of a wage sufficient to lift their family from poverty.
 A culture of poverty?
The circumstances of poverty limit the odds that someone can escape poverty. Individuals living in poverty or belonging to families in poverty often work but still have limited resources – in regard to employment, housing, health care, education and child care, just to name a few domains.
If a family is surrounded by other households also struggling with poverty, this further exacerbates their circumstances. It’s akin to being a weak swimmer in a pool surrounded by other weak swimmers. The potential for assistance and benefit from those around you further limits your chances of success.
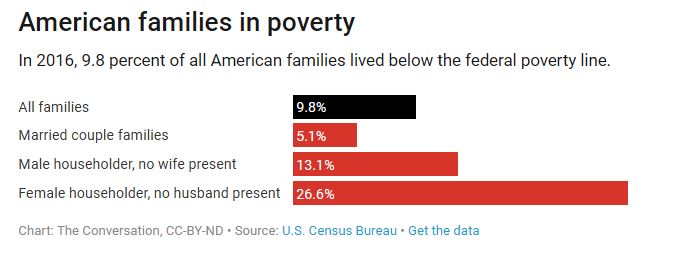 Even the basic reality of family structure feeds into the consideration of poverty. Twenty-seven percent of female-headed households with no other adult live in poverty, dramatically higher than the 5 percent poverty rate of married couple families.
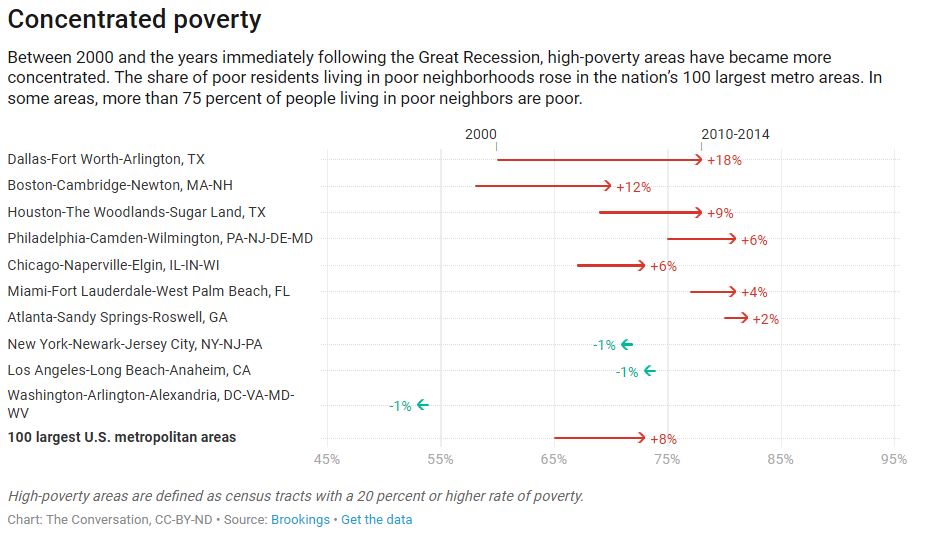
Poverty exists in all areas of the country, but the population living in high-poverty neighborhoods has increased over time. Following the Great Recession, some 14 million people lived in extremely poor neighborhoods, more than twice as many as had done so in 2000. Some areas saw some dramatic growth in their poor populations living in high-poverty areas.
 Given the complexity of poverty as a civic issue, decision makers should understand the full range of evidence about the circumstances of the poor. This is especially important before undertaking a major change to the social safety net such as broad-based work requirements for those receiving non-cash assistance.
Author: Robert L. Fischer Co-Director of the Center on Urban Poverty and Community Development, Case Western Reserve University