
Michael Pascoe has penned an article in the New Daily, which attempts to bring some balance to the discussion of the severity of household debt in Australia.
“there are no guarantees and household debt levels do indeed need watching, but it’s not as simple an Armageddon as the scaremongers would like you to think”.
Good on him, for not just following the herd on this one. Because the debt footprint is more complex than some would like to admit.
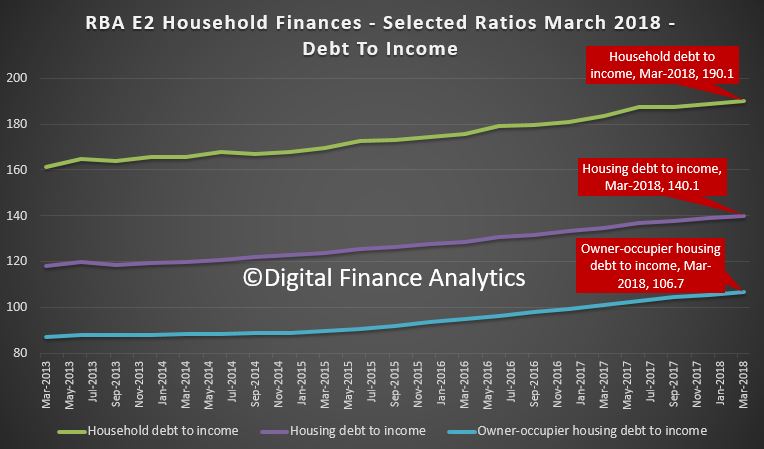
Averaging data tells us very little. For example the RBA chart showing 190 debt to income includes all households, including those without debt, so the ratio is higher for those with big debts.
 Second, you have to look at individual households and their finances. This is of course what our surveys do, alongside details of their overall assets, and net worth.
And yes, many are doing just fine (even if much of those assets are in inflated housing, or superannuation which is locked away).
But it is the marginal borrower who is under the gun now, even at rock bottom interest rates, and banking lending standards are a lot tighter so around 40% of households are having trouble getting a refinance. Plus we do have problems with some interest only loans, especially where the borrower is a serial leveraged investor with a significant number of properties.
Then of course there is the question of whether employment rates will rise or fall, and the quality of new jobs on offer. As a piece in The Conversation today shows:
many jobs are Job creation in the female-dominated health and education service sectors is driving both full-time and part-time employment growth in Australia.
And some of these will be less well paid.
Here is a plot for all households of TOTAL debt repayments as a ratio to income at the current time. This includes households with a mortgage, those who own property outright and those renting. Many have no debt.
For those borrowing, debt can include mortgages (both owner occupied and investor), personal loans, credit cards, and other consumer finance. This does not include business lending.
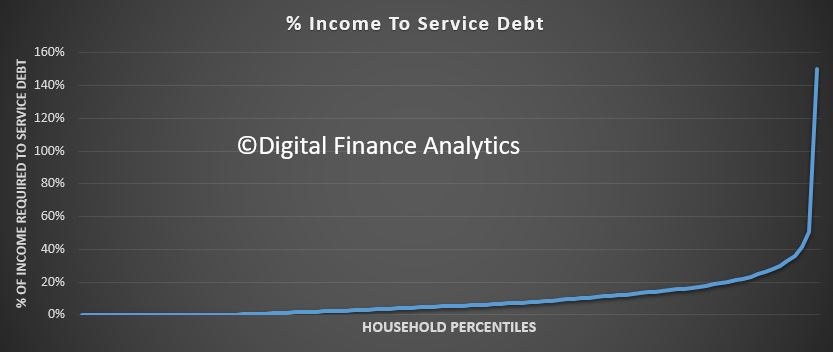 Many more have commitments which require less than 20% of household incomes (from all sources). But others have much higher debt servicing requirements, and a few are through the 100% barrier – meaning ALL income is going to repay debt. Not pretty. In some cases this is triggered by changes in personal circumstances.
If you boil it back to owner occupied mortgage borrowers, then our data suggests around 30% have little wiggle room at current levels. Even small rises would be concerning.
And at the end of the day it will be the marginal borrower who has the potential to trigger issues down the track – as happened in the USA post the GFC.
It is certainly not an all or nothing picture. Granularity is your friend.