The Baby Boom and the U.S. Productivity Slowdown

From The St. Louis Fed On The Economy Blog.

The U.S. economy is currently experiencing a prolonged productivity slowdown, comparable to another slowdown during in the 1970s.

Economists have debated the causes for these slowdowns: The reasons range from the 1970s oil price shock to the 2007-08 financial crisis.

But did the baby boom generation partly cause both periods of slowing productivity growth?

A Demographic Shift

Guillaume Vandenbroucke, an economist at the St. Louis Fed, explored the role of the baby boom generation—specifically, those born in the period of 1946 to 1957 when the birth rate increased by 20 percent—in these slowdowns.

In a recent article in the Regional Economist, he pointed out a demographic shift: Many baby boomers began entering the labor market as young, inexperienced workers during the 1970s, and now they’ve begun retiring after becoming skilled, experienced workers.

“This hypothesis is not to say that the baby boom was entirely responsible for these two episodes of low productivity growth,” the author wrote. “Rather, it is to point out the mechanism through which the baby boom contributed to both.”

Productivity 101

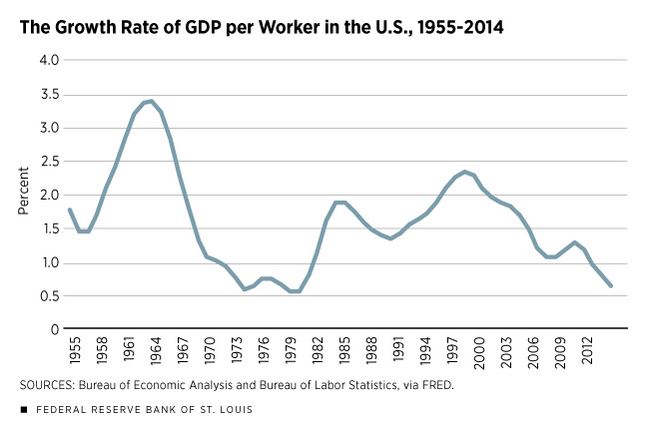
One measure of productivity is labor productivity, which can be measured as gross domestic product (GDP) per worker. By this measure, the growth of labor productivity was low in the 1970s. Between 1980 and 2000, this growth accelerated, but then has slowed since 2000.

“It is interesting to note that the current state of low labor productivity growth is comparable to that of the 1970s and that it results from a decline that started before the 2007 recession,” Vandenbroucke wrote.

How does a worker’s age affect an individual’s productivity? According to economic theory, young workers have relatively low human capital; as they grow older, they accumulate human capital, Vandenbroucke wrote.

“Human capital is what makes a worker productive: The more human capital, the more output a worker produces in a day’s work,” the author wrote.

The Demographic Link

Vandenbroucke gave an example of how this simple idea could affect overall productivity. His example looked at a world in which there are only young and old workers. Each young worker produces one unit of a good, while the older worker—who has more human capital—can produce two goods. If there were 50 young workers and 50 old workers in this simple economy, the total number of goods produced would be by 150, which gives labor productivity of 1.5 goods per worker.

Now, suppose the demographics changed, with this economy having 75 young workers and 25 old workers. Overall output would be only 125 goods. Therefore, labor productivity would be 1.25.

“Thus, the increased proportion of young workers reduces labor productivity as we measure it via output per worker,” he wrote. “The mechanism just described is exactly how the baby boom may have affected the growth rate of U.S. labor productivity.”

The Link between Boomers and Productivity Growth

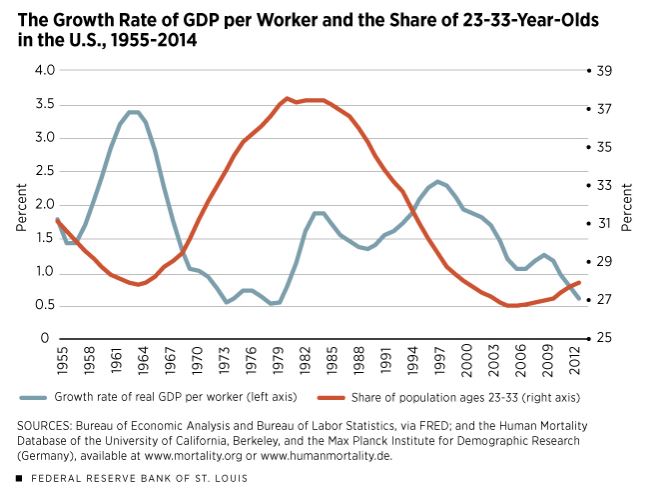
Vandenbroucke then compared the growth rate of GDP per worker (labor productivity) with the share of the population 23 to 33 years old, which he used as a proxy for young workers.

This measure of young workers began steadily increasing in the late 1960s before peaking circa 1980, which represented the time when baby boomers entered the labor force.

Looking at these variables from 1955 to 2014, he found the two lines move mostly in opposite directions (the share of young people growing as labor productivity growth declined) except in the 2000s.

(To see these trends, see the Regional Economist article, “Boomers Have Played a Role in Changes in Productivity.”)

“The correlation between the two lines is, indeed, –37 percent,” Vandenbroucke wrote.1

The share of the population who were 23 to 33 years old began to increase in the late 2000s, which can be viewed as the result of baby boomers retiring and making the working-age population younger.

“This trend is noticeably less pronounced, however, during the 2000s than it was during the 1970s,” the author wrote. “Thus, the mechanism discussed here is likely to be a stronger contributor to the 1970s slowdown than to the current one.”

Conclusion

If this theory is correct, it may be that the productivity of individual workers did not change at all during the 1970s, but that the change in the composition of the workforce caused the productivity slowdown, he wrote.

“In a way, therefore, there is nothing to be fixed via government programs,” Vandenbroucke wrote. “Productivity slows down because of the changing composition of the labor force, and that results from births that took place at least 20 years before.”

Notes and References

1 A correlation of 100 percent means a perfect positive relationship, zero percent means no relationship and -100 percent means a perfect negative relationship.

Home Ownership Foundations Are Being Shaken

From The Conversation.

The nature of the centrepiece of the Australian housing system – owner occupation – is quietly undergoing a profound transformation.

Once taken for granted by the mainstream, home ownership is increasingly precarious. At the margins, which are wide, it is as if a whole new form of tenure has emerged.

Whatever the drivers, significant and lasting shifts are shaking the foundations of home ownership. The effects are far-reaching and could undermine both the financial and wider well-being of all Australian households.

Over the course of 100 years, Australians became accustomed to smooth housing pathways from leaving the parental home to owning their house outright. However, not only did the 2008-09 global financial crisis (GFC) underline the risk of dropping out along the way, but more recent Australian evidence has shown that the old pathways have been displaced by more uncertain routes that waver between owning and renting.

The Household, Income and Labour Dynamics in Australia (HILDA) Survey indicates that, during the first decade of the new millennium, 1.9 million spells of home ownership ended with a move into renting (one-fifth of all home ownership spells that were ongoing in that period). It also shows that among those who dropped out, nearly two-thirds had returned to owning by 2010. Astonishingly, some 7% “churned” in and out of ownership more than once. Many households no longer either own or rent; they hover between sectors in a “third” way.

The drivers of this transformation include an ongoing imperative to own, vying with the factors that oppose this – rising divorce rates, soaring house prices, growing mortgage debt, insecure employment and other circumstances that make it difficult to meet home ownership’s outlays.

Those who use the family home as an “ATM” are at added risk. This relatively new way of juggling mortgage payments, savings and pressing spending needs makes some styles of owner occupation more marginal – as the tendency is to borrow up, rather than pay down, mortgage debts over the life course.

A retirement incomes system under threat

Since its inception, the means-tested age pension system has been set at a low fixed amount. Retired Australians could nevertheless get by provided they achieved outright home ownership soon enough. The low housing costs associated with outright ownership in older age were effectively a central plank of Australian social policy.

This worked well from the 1950s for nearly half a century. But now growing numbers of people retire with a mortgage debt overhang or as lifetime renters grappling with the costs of insecure private rental tenancies.

Moreover, developments in the Australian housing system could undermine a second retirement incomes pillar – the superannuation guarantee. An important goal of the superannuation guarantee is financial independence in old age. But if superannuation pay-outs are used to repay mortgage debts on retirement, reliance on age pensions will grow rather than recede.

A shrinking asset base for welfare

Home ownership is retreating at a time when income inequalities are the highest in nearly seven decades and governments are eyeing housing wealth as an asset base for welfare.

Such policy interest is not surprising. Housing wealth dominates the asset portfolios of the majority of Australian households, boosted by soaring house prices. If home owners can be encouraged or even compelled to draw on their housing assets to fund spending needs in retirement, this will ease fiscal pressures in an era of population ageing.

However, the welfare role of home ownership is already important in the earlier stages of life cycles. Financial products are increasingly being used to release housing equity in pre-retirement years. This adds to the debt overhang as retirement age approaches. It also increases exposure to credit and investment risks that could undermine stability in housing markets.

A gender equity issue

A commonly overlooked angle relates to gender equity. Australian women own less wealth than men, and they also hold more housing-centric asset portfolios.

Estimates from the 2014 HILDA Survey wealth module show that the family home makes up nearly half of the total assets owned by single women, compared to 39% for single men. Women are also more likely to sell their family home to pay for financial emergencies.

Hence, women are more exposed to housing market instability associated with precarious home ownership. Single women are especially vulnerable to investment risk when they seek to realise their assets.

A neglected economic lever

Housing and mortgage markets played a central role in the GFC. Today, it is widely agreed that resilient housing and mortgage markets are important for overall economic and financial stability. There are also concerns that the post-GFC debt overhang is a drag on economic growth.

However, the policy stance in the wake of the GFC has been “business as usual”. There has been very little real innovation in the world of housing finance or mortgage contract design in recent years. This might change if housing were steered from the periphery to a more central place in national economic debates.

Forward-looking policy response is needed

Growing numbers of Australians clearly face an uncertain future in a changing housing system. The traditional tenure divide has been displaced by unprecedented fluidity as people juggle with costs, benefits, assets and debts “in between” renting and owning.

This expanding arena is strangely neglected by policy instruments and financial products. Politicians cling to an outdated vision of linear housing careers that does little to meet the needs of “at risk” home owners, locked-out renters, or churners caught between the two.

The hazards of a destabilising home ownership sector are wide-ranging, rippling well beyond the realm of housing. Part of the answer is a new drive for sustainability, based on a housing system for Australia that is more inclusive and less tenure-bound.

Author: Rachel Ong, Professor of Economics, School of Economics and Finance, Curtin University; Gavin Wood, Emeritus Professor of Housing and Housing Studies, RMIT University; Susan Smith,
Honorary Professor of Geography, University of Cambridge

Fresh Warnings Issued Over Mortgage Stress

From Mortgage Business.

Several industry participants have voiced concern over mortgage stress and the rising risk of defaults, as wage growth fails to keep pace with the costs of living.

Approximately 51,500 borrowers could be at risk of defaulting on their mortgages in the coming year, with over 30 per cent of Australians experiencing mortgage stress, finder.com.au has suggested, after analysing research from Digital Finance Analytics’ (DFA) Household Survey.

Speaking to Mortgage Business, the principal of DFA, Martin North, noted that “at risk” borrowers were most prevalent in mining-centred regions across Queensland and Western Australia. He added that “severe” mortgage stress could be on the rise in other parts of the country.

“There are more people currently at risk in Western Australia and in Queensland, which is an outfall from the mining downturn, but we’re also seeing a significant rise in severe stress in Western Sydney, on the outskirts of Melbourne and around Brisbane,” Mr North said.

“Defaults over the next two years are not necessarily going to be centred in the West or in Queensland, but we’re going to see some more significant risks in and around the main urban centres in Brisbane and Melbourne.”

Mr North attributed the increased risk of mortgage defaults to slow wage growth, cost of living pressures and high mortgage repayment costs for borrowers that were issued with home loans prior to regulatory tightening.

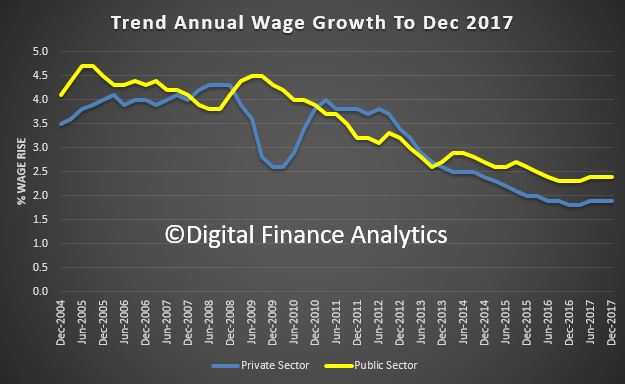
The principal said: “There are a few drivers. The first is that incomes are not growing in real terms, particularly if you’re in the private sector. The income growth is on average 1.9 per cent. A lot of people haven’t had a pay rise in a long time, so income is compressed.

“Secondly, cost of living is rising and that includes everything from electricity bills, child-care costs, cost of fuel, [etc]. So, it’s the impact of incomes versus costs not going in the right direction.

“The third thing is that the costs of the mortgage, particularly in the major urban areas around Sydney and Melbourne, are a lot bigger because home prices have gone up a lot, so people are leveraged. They’ve got very large mortgages and very little wiggle room as a result.”

The market analyst also noted that a lack of financial awareness and household budgeting is to blame for rising levels of mortgage stress. Indeed, according to Mortgage Choice’s Financial Savviness Whitepaper, 54.9 per cent of Australians fail to review their finances at least once a week.

“The finding that more than one in two Australians are not checking their bank accounts on a weekly basis at minimum is quite alarming and it suggests that many people are keeping themselves in the dark when it comes to their finances,” CEO of Mortgage Choice John Flavell said.

The Mortgage Choice CEO added that “keeping a close eye” on finances could allow households to identify savings opportunities.

He said: “Keeping a close eye on your finances is essential in helping you better manage and understand where your money is going, where you can cut back on spending and improve your savings.

“When you know how much money you have available in your account, you will avoid overspending or withdrawing beyond your balance and being hit with an overdraft fee. Moreover, when you’re actively tracking your finances, you will benefit from having greater control and confidence to make decisions, whether they be small discretional expenses or a significant purchase such as a car or property.”

Mr Flavell continued: “[Being] aware of your spending patterns helps you catch any unusual expenses, fees or declined transactions you may not have otherwise been aware of.”

The topic of mortgage stress has been in the spotlight recently, after the Reserve Bank of Australia said that it was keeping a watchful eye on interest-only mortgagors whose terms are due to expire between this year and 2022, as it fears some may find the “step-up” to P&I repayments “difficult to manage”.

In her address to the Responsible Lending and Borrowing Summit this year, the assistant governor of the Reserve Bank of Australia (RBA), Michele Bullock, spoke about household indebtedness and mortgage stress.

Ms Bullock said that while mortgage stress has declined since 2011 (largely as a reflection of the fall in interest rates since that time) and that the number of those classed as being in some financial stress is “not growing rapidly”, around 12 per cent of owner-occupiers with mortgage debt indicated that they would expect difficulty raising funds in an emergency.

Noting that “the increasing popularity of interest-only loans over recent years meant that, by early 2017, 40 per cent of the debt did not require principal repayments”, the assistant governor said that “this presents a potential source of financial stress if a household’s circumstances were to take a negative turn”.

Ms Bullock noted that as a “large portion” of principal-free periods begin to expire, some borrowers may therefore struggle to service their mortgages.

She said: “[A] large proportion of interest-only loans are due to expire between 2018 and 2022. Some borrowers in this situation will simply move to principal and interest repayments as originally contracted.

“Others may choose to extend the interest-free period, provided that they meet the current lending standards. There may, however, be some borrowers that do not meet current lending standards for extending their interest-only repayments but would find the step-up to principal and interest repayments difficult to manage.

“This third group might find themselves in some financial stress. While we think this is a relatively small proportion of borrowers, it will be an area to watch.”

China’s Thrift, and What to Do About It

From The IMFBlog.

What makes China’s citizens so thrifty, and why does that matter for China and the rest of the world? The country’s saving rate, at 46 percent of GDP, is among the world’s highest. Households account for about half of savings, with corporations and the government making up the rest.

Saving is good, right? Up to a point. But too much saving by individuals can be bad for society. That’s because the flip side of high savings is low consumption and low household welfare. High savings can also fuel excessive investment, resulting in a buildup of debt in China. And because people in China save so much, they buy fewer imported goods than they sell abroad. That contributes to global imbalances, according to a recent IMF paper, China’s High Savings: Drivers, Prospects, and Policies. The country’s authorities are aware of the issue and are taking steps to address it.

China’s saving rate started to soar in the late 1970s. A look at some of the causes of the increase points to some potential remedies.

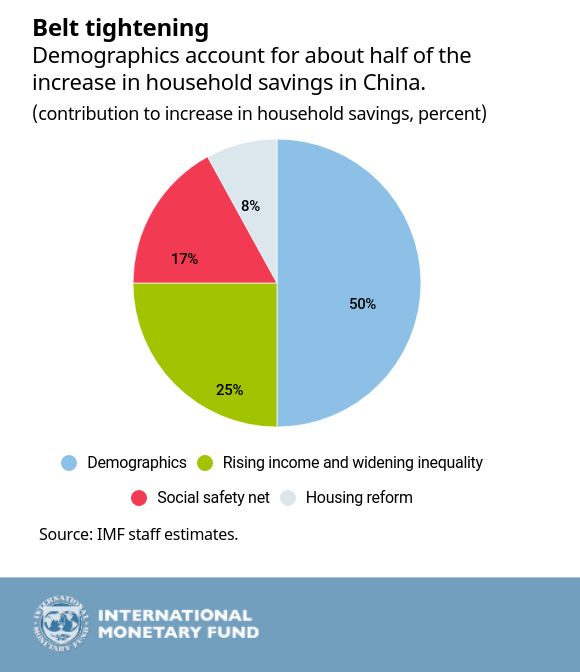
Demographics explain about half the increase in saving, the Chart of the Week shows. China’s average family size dropped dramatically after the introduction of the “one child” policy. That influenced household budgets in two ways. Parents spent less money raising their children. At the same time, because children were traditionally a source of support in old age, having fewer children prompted parents to save more for retirement.

Greater income inequality, resulting from China’s transition to a more market-driven economy, is also a big contributor. A wider gap between rich and poor increases saving because the wealthy spend a smaller proportion of their income on necessities and put more money in the bank.

Economic reform has boosted saving in other ways. More Chinese now live in their own homes, as opposed to housing provided by state-owned enterprises. So they must save for a down payment and for mortgage payments. (Household debt, while still low, has risen rapidly in recent years, linked largely to asset price speculation.) And a decline in government spending on social services during the economic transition in the 1980s and 90s has meant that Chinese must save more for retirement or to pay for health care.

There are several things the government can do to encourage more spending:

  • Make the income tax more progressive and family friendly;
  • Spend more on health care, pensions and education;
  • Spend more on assistance to the poor, which would reduce income inequality.

Of course, China will need more revenue to pay for all of this. One answer would be to increase the dividends paid by state owned enterprises. Another would be to transfer shares of these firms to social security funds. With the right policies, China can encourage spending while avoiding the fate predicted by Confucius: “He who does not economize must agonize.”

Why Are Banks Shuttering Branches?

From The St. Louis Fed On The Economy Blog

On Feb. 6, the Wall Street Journal published a startling statistic: Between June 2016 and June 2017, more than 1,700 U.S. bank branches were closed, the largest 12-month decline on record.1

Structural Shift

That large drop, while surprising, is part of a trend in net branch closures that began in 2009. It follows a profound structural shift in the number and size of independent U.S. banking headquarters, or charters, over the past three decades.

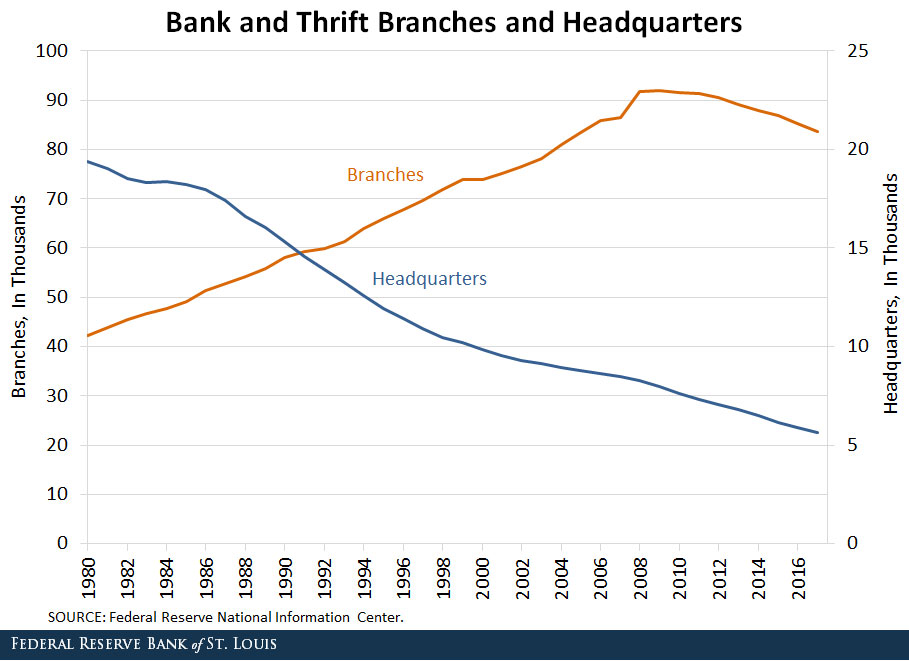
In 1980, nearly 20,000 commercial banks and thrifts with more than 42,000 branches were operating in the nation. Since then, the number of bank and thrift headquarters has steadily declined.

The reasons for the decline in charters and branches are varied. Regarding charters, the passage of the Riegle-Neal Interstate Banking and Branching Efficiency Act in 1994 played a significant role in their decline. Banks operating in more than one state took advantage of the opportunity to consolidate individual state charters into one entity and convert the remaining banks into branches. Almost all states opted in to a provision in the law permitting interstate branching, which led to a steady increase in branches.

Trend Reversal

Even before the number of charters declined, however, the number of branches grew steadily throughout the 1980s, 1990s and early 2000s. It peaked in 2009, when the trend reversed, as seen in the figure below.

Since 2009, the number of commercial bank and thrift branches has shrunk nearly 10 percent, or just over 1 percent per year.

The initial wave of closings can be attributed to a wave of mergers and failed bank acquisitions following the financial crisis. There was an immediate opportunity to reduce cost through the shuttering of inefficient office locations. Branch closings were also influenced by earnings pressure from low interest rates and rising regulatory costs.

More recently, changing consumer preferences and improvements in financial technology have further spurred the reduction in branches. Customers increasingly use ATMs, online banking and mobile apps to conduct routine banking business, meaning banks can close less profitable branches without sacrificing market share.

Uneven Changes

The reduction in offices has not been uniform. According to the Federal Deposit Insurance Corp., less than one-fifth of banks reported a net decline in offices between 2012 and 2017, and slightly more than one-fifth reported an increase in offices.

Just 15 percent of community banks reported branch office closures between 2012 and 2017. And though closures outnumber them, new branches continue to be opened. It’s also important to note that deposits continue to grow—especially at community banks—even as the number of institutions and branches decline.

The Industry of the Future

It seems inevitable that this long-term trend in branch closings will continue as consumer preferences evolve and financial technology becomes further ingrained in credit and payment services.

Although it is unlikely that the U.S. will end up resembling other countries with relatively few bank charters, it seems certain that consumers and businesses will increasingly access services with technology, no matter the size or location of bank offices. This change creates opportunities as well as operational risks that will need to be managed by banks and regulators alike.

Immigration, Unemployment, Wages and House Prices

From The Conversation.

Australia should cut its immigration intake, according to Tony Abbott in a recent speech at the Sydney Institute. Abbott explicitly cites economic theory in his arguments: “It’s a basic law of economics that increasing the supply of labour depresses wages; and that increasing demand for housing boosts price.”

But this economic analysis is too basic. Yes, supply matters. But so does demand.

While migration has increased labour supply, it has done so primarily in sectors where firms were starved of labour, and at a time of broad economic growth.

Immigration has put pressure on infrastructure, but our problems are more a function of governments failing to upgrade and expand infrastructure, even as migrants pay taxes.

And while migrants do live in houses, the federal government’s fondness for stoking demand and the inactivity of state governments in increasing supply are the real issues affecting affordability.

The economy isn’t a fixed pie

Let’s take Abbott’s claims about immigration one by one, starting with wages.

It’s true that if you increase labour supply that, holding other factors that affect wages constant, wages will decline. However, those other factors are rarely constant.

Notably, if the demand for labour is increasing by more than supply (including new migrants), then wages will rise.

This is a big part of the story when it comes to the relationship between wages and migration in Australia. Large migrant numbers have been an almost constant feature of Australia’s economy since the end of the second world war, if not earlier.

But these migrants typically arrived in the midst of economic growth and rising demand for labour. This is particularly true in recent decades, when we have had one of the longest periods of unbroken growth in the history of the developed world.

In our study of the Australian labour market, we found no relationship between immigration rates and poor outcomes for incumbent Australian workers in terms of wages or jobs.

Australia uses a point system for migration that targets skilled migrants in areas of high labour demand. Business is suffering in these areas. Migrants into these sectors don’t take jobs from anybody else because they are meeting previously unmet demand.

These migrants receive a higher wage than they would in their place of origin, and they allow their new employers to reduce costs. This ultimately leads to lower prices for consumers. Just about everybody benefits.

There’s an idea called the “lump of labour fallacy”, which holds that there is a certain amount of work to be done in an economy, and if you bring in more labour it will increase competition for those jobs.

But migrants also bring capital, investing in houses, appliances, businesses, education and many other things. This increases economic activity and the number of jobs available.

Furthermore, innovation has been shown to be strongly linked to immigration. In the United States, for instance, immigrants apply for patents at twice the rate of non-immigrants. And a large number of studies show that immigrants are over-represented in patents, patent impact and innovative activity in a wide range of countries.

We don’t entirely know why this is. It could be that innovative countries attract migrants, or it could be than migrants help innovation. It’s likely that the effect goes both ways and is a strong argument against curtailing immigration.

Abbott’s comments are more reasonable in the case of housing affordability because here all other things really are held constant. Specifically, studies show that housing demand is overheated in part by federal government policies (negative gearing and capital gains tax exemptions, for instance) and state governments not doing enough to increase supply.

Governments have responded to high housing prices by further stoking demand, suggesting that people dip into their superannuation, for instance.

In the wake of Abbott’s speech there has been speculation that our current immigration numbers could exacerbate the pressures of automation, artificial intelligence and other labour-saving innovations.

But our understanding of these forces is nascent at best. In previous instances of major technological disruption, like the industrial revolution, the long-run effects on employment were negligible. When ATMs debuted, for example, many bank tellers lost their jobs. But the cost of branches also declined, new branches opened and total employment did not decline.

In his speech, Abbott said that the government needs policies that are principled, practical and popular. What would be popular is if governments across the country could fix our myriad policy problems. Abbott identified some of the big ones – wages, infrastructure and housing affordability.

What would be practical is to identify the causes of these problems and address these directly. Immigration is certainly not a major cause. It would be principled to undertake evidence-based analysis regarding what the causes are and how to address them.

A lot of that has already been done, notably by the Grattan Institute. What remains is for governments to do the politically difficult work of facing the facts.

Authors: Robert Breunig, Professor of Economics, Crawford School of Public Policy, Australian National University; Mark Fabian, Postgraduate student, Australian National University

Brisbane Area Mortgage Stress Mapping

I was asked recently to show the current mortgage stress footprint in the Brisbane area. Ahead of the February stress modelling update, next week, this is the current situation.

Remember we are looking at stress on a cash flow basis, (money in, money out) and some households may have access to savings or credit cards to tide them over, may have paid ahead, or could even sell. But eventually if cash flow is out of equilibrium, it can lead to problems. It is a leading indicator, while defaults is a lagging indicator.

This map is based on the number of households in each post code in mortgage stress. Click on the image to enlarge.

Want A Wage Rise? – Go To The Public Sector (In Victoria)!

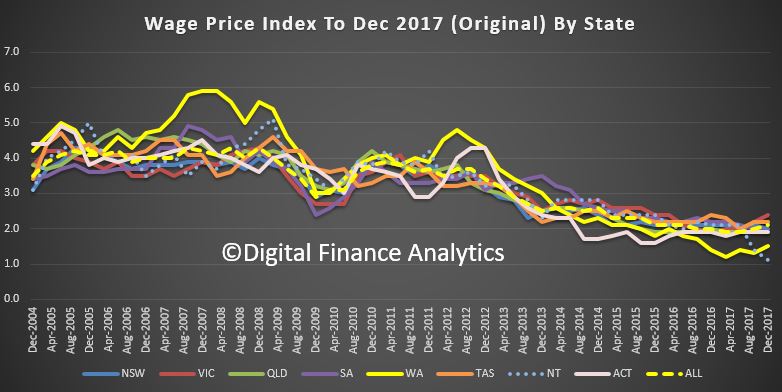
The ABS released their wage price data today for the December 2017 Quarter.  You can clearly see the gap between trend public and private sector rates, with the private sector sitting at 1.9% and public sector 2.4%. The CPI was 1.9% in December, so no real growth for more than half of all households! Hardly stellar…

The seasonally adjusted Wage Price Index (WPI) rose 0.6 per cent in December quarter 2017 according to figures released today by the Australian Bureau of Statistics (ABS).

The WPI rose 2.1 per cent through the year seasonally adjusted to December quarter 2017.

ABS Chief Economist Bruce Hockman said “The annual rate of wage growth has increased for the second consecutive quarter reflecting falling unemployment and underemployment rates, and increasing job vacancy levels.”

Seasonally adjusted, private sector wages rose 1.9 per cent and public sector wages grew 2.4 per cent through the year to December quarter 2017.

In original terms, through the year wage growth to the December quarter 2017 ranged from 1.4 per cent for the Mining industry to 2.8 per cent for the Health care and social assistance industry.

Victoria was the highest through the year wage growth of 2.4 per cent and The Northern Territory recorded the lowest of 1.1 per cent.

Property developer joins lending fray

As the property market cools, some developers are getting into the lending game (and of course outside APRA supervision).  First Time Buyers are significant targets.

From Australian Broker.

Property developer Catapult Property Group has launched a new lending division that will help first home buyers get home loans with a deposit of only $5,000.

The Brisbane-based company encourages first home buyers in Queensland to enter the real estate market now by taking advantage of the state government’s $20,000 grant that is ending on 30 June 2018.

Catapult director for residential lending Paul Anderson said first home buyers do not require a 20% deposit plus fees to enter the property market.

“There are many banks that are happy to finance a purchase from as little as 5% deposit and in some cases even less than that,” he said. “When working with property specialists such as Catapult Property Group who have the builder, broker and financial advisors under the one roof, it’s possible to secure a loan with as little as $5,000.”

To get a home loan with a minimal deposit, the company requires that applicants have a full-time job with a stable employment history, a consistent rental payment record, and a clear credit score.

Borrowers may also need to get lenders’ mortgage insurance.

“Mortgage insurance on a $450,000 home purchase with a minimal deposit usually ranges from $7,000 to $14,000, which is added to your mortgage. This is a more realistic means of entering the property market than trying to save a potentially unattainable amount of around $100,000 for a deposit,” said Anderson.

The company says it has almost $130m of residential projects in Queensland and NSW.

Regional Insolvencies Higher than Capital Cities

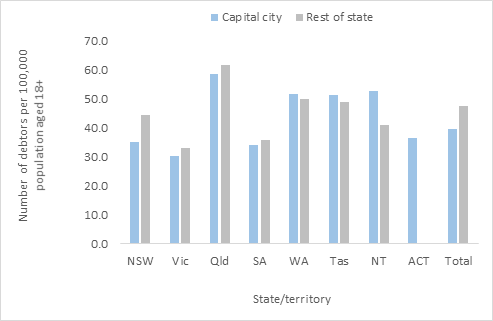
The latest data from The Australian Financial Security Authority (AFSA), regional personal insolvency statistics for the December quarter 2017, shows that on a relative basis more are in distress in the regions than in the major centres.

That said, there were 7,687 debtors who entered a new personal insolvency in the December quarter 2017 in Australia. Of these, 4,785 debtors or 62.2% were located in greater capital cities.

New South Wales – There were 1,320 debtors who entered a new personal insolvency in Greater Sydney in the December quarter 2017. The regions with the highest number of debtors were Campbelltown (NSW) (91), Wyong (80) and Gosford (74). There were 913 debtors who entered a new personal insolvency in rest of New South Wales in the December quarter 2017. The regions with the highest number of debtors were Newcastle (51), Lower Hunter (41) and Wagga Wagga (40).

Victoria – There were 1,064 debtors who entered new personal insolvencies in Greater Melbourne in the December quarter 2017. The regions with the highest number of debtors were Wyndham (72), Tullamarine – Broadmeadows (65) and Casey – South (63).  There were 367 debtors who entered a new personal insolvency in rest of Victoria in the December quarter 2017. The regions with the highest number of debtors were Geelong (54), Bendigo (33) and Ballarat (29).

Queensland – There were 1,021 debtors who entered a new personal insolvency in Greater Brisbane in the December quarter 2017. The regions with the highest number of debtors were Springfield – Redbank (77), Ipswich Inner (60) and North Lakes (54). There were 1,141 debtors who entered a new personal insolvency in rest of Queensland in the December quarter 2017. The regions with the highest number of debtors were Ormeau – Oxenford (102), Townsville (101), Rockhampton (64) and Toowoomba (64).

South Australia – There were 347 debtors who entered a new personal insolvency in Greater Adelaide in the December quarter 2017. The regions with the highest number of debtors were Salisbury (54), Onkaparinga (41) and Playford (40). There were 106 debtors who entered a new personal insolvency in rest of South Australia in the December quarter 2017. The regions with the highest number of debtors were Eyre Peninsula and South West (20), Murray and Mallee (18) and Barossa (16).

Western Australia – There were 776 debtors who entered a new personal insolvency in Greater Perth in the December quarter 2017. The regions with the highest number of debtors were Wanneroo (114), Rockingham (81) and Swan (81). There were 199 debtors who entered a new personal insolvency in rest of Western Australia in the December quarter 2017. The regions with the highest number of debtors were Bunbury (38), Mid West (27) and Goldfields (25).

Tasmania – There were 89 debtors who entered a new personal insolvency in Greater Hobart in the December quarter 2017. The regions with the highest number of debtors were Hobart – North West (30), Hobart Inner (16) and Brighton (13). There were 110 debtors who entered a new personal insolvency in rest of Tasmania in the December quarter 2017. The regions with the highest number of debtors were Launceston (32), Devonport (25) and Burnie – Ulverstone (20).

Northern Territory – There were 55 debtors who entered a new personal insolvency in Greater Darwin in the December quarter 2017. The regions with the highest number of debtors were Darwin Suburbs (19), Palmerston (14) and Litchfield (12). There were 26 debtors who entered a new personal insolvency in rest of Northern Territory in the December quarter 2017. The regions with the highest number of debtors were Alice Springs (12) and Katherine (8).

Australian Capital Territory – In the December quarter 2017, there were 113 debtors who entered a new personal insolvency in the Australian Capital Territory. The regions with the highest number of debtors were Belconnen (32), Gungahlin (32) and Tuggeranong (30).