Households Under The Mortgage Stress Gun In December

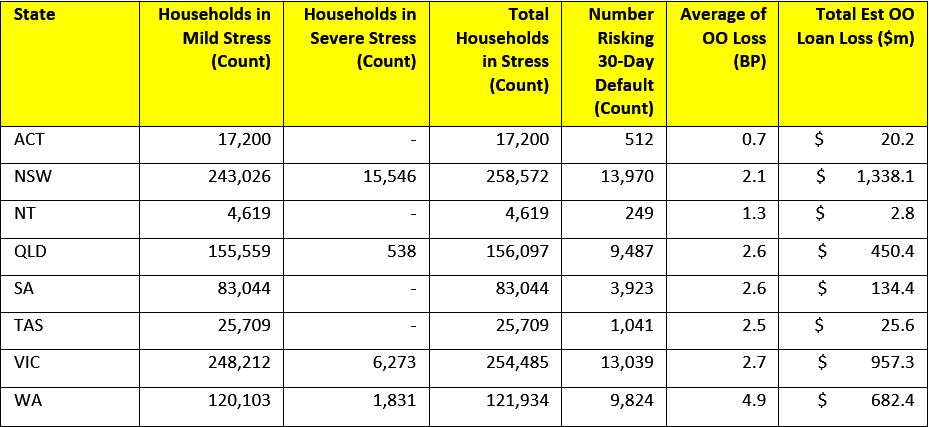
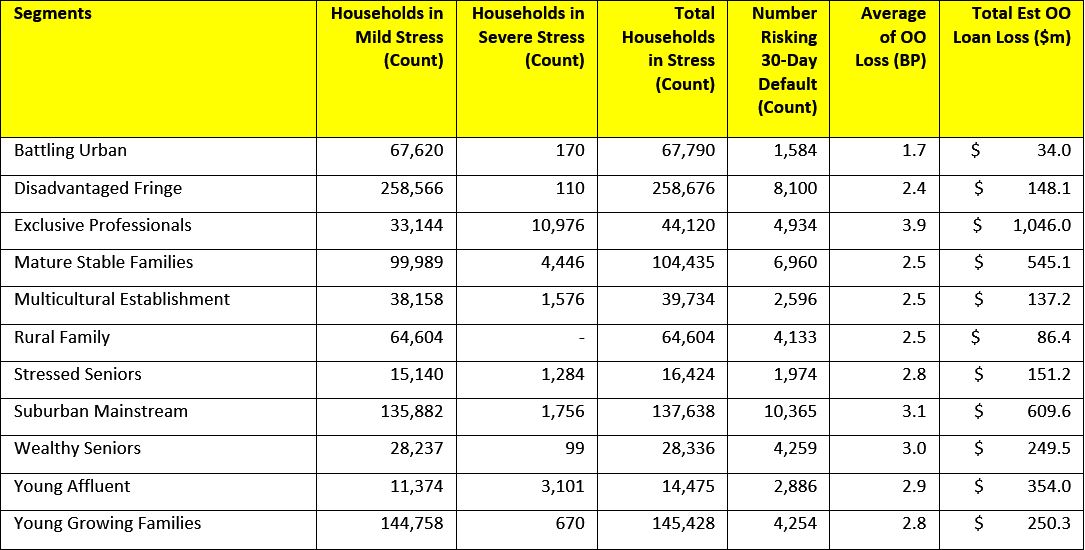
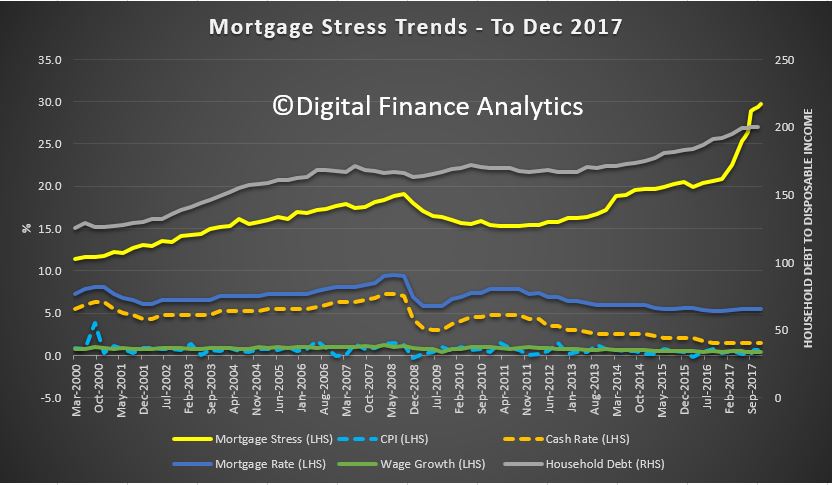
Digital Finance Analytics has released the December mortgage stress and default analysis update. Across Australia, more than 921,000 households are estimated to be now in mortgage stress (last month 913,000). This equates to 29.7% of households. In addition, more than 24,000 of these in severe stress, up 3,000 from last month. We estimate that more than 52,000 households risk 30-day default in the next 12 months, similar to last month. We expect bank portfolio losses to be around 2.8 basis points, though with losses in WA rising to 4.9 basis points. Households in NSW are showing the most significant rise in stress, thanks to larger mortgages relative to income, while income growth is slow.

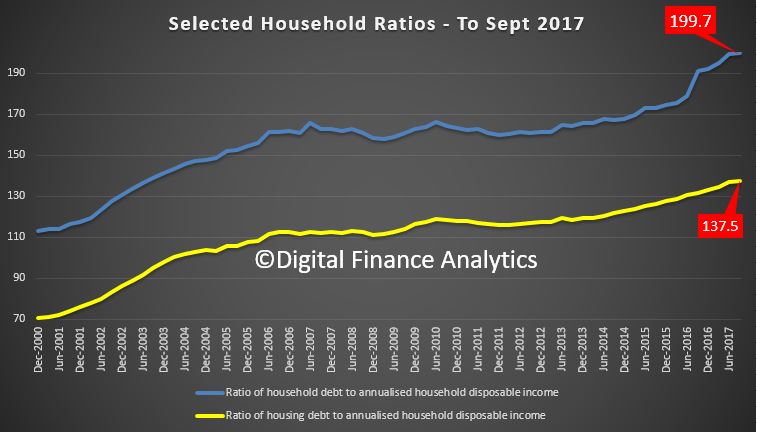
Martin North, Principal of Digital Finance Analytics said “the number of households impacted are economically significant, especially as household debt continues to climb to new record levels. Mortgage lending is still growing at three times income. This is not sustainable”. The latest household debt to income ratio is now at a record 199.7.[1]

Risks in the system continue to rise, and while recent strengthening of lending standards will help protect new borrowers, there are many households currently holding loans which would not now be approved. This is a significant sleeping problem and the risks in the system are higher than many recognise.

Our analysis uses the DFA core market model which combines information from our 52,000 household surveys, public data from the RBA, ABS and APRA; and private data from lenders and aggregators. The data is current to end December 2017. We analyse household cash flow based on real incomes, outgoings and mortgage repayments, rather than using an arbitrary 30% of income.

Households are defined as “stressed” when net income (or cash flow) does not cover ongoing costs. Households in mild stress have little leeway in their cash flows, whereas those in severe stress are unable to meet repayments from current income. In both cases, households manage this deficit by cutting back on spending, putting more on credit cards and seeking to refinance, restructure or sell their home.  Those in severe stress are more likely to be seeking hardship assistance and are often forced to sell.

The forces which are lifting mortgage stress levels remain largely the same. In cash flow terms, we see households having to cope with rising living costs whilst real incomes continue to fall and underemployment remains high. Households have larger mortgages, thanks to the strong rise in home prices, especially in the main eastern state centres, but now there are signs prices are slipping. While mortgage rates remain quite low for owner occupied borrowers, those with interest only loans or investment loans have seen significant rises.  We expect some upward pressure on real mortgage rates in the next year as international funding pressures mount, a potential for local rate rises and margin pressure on the banks.

Probability of default extends our mortgage stress analysis by overlaying economic indicators such as employment, future wage growth and cpi changes.  Our Core Market Model also examines the potential of portfolio risk of loss in basis point and value terms. Losses are likely to be higher among more affluent households.

Stress by The Numbers.

Regional analysis shows that NSW has 258,572 households in stress (251,576 last month), VIC 254,485 (253,248 last month), QLD 156,097 (157,019 last month) and WA 121,934 (123,849 last month). The probability of default rose, with around 9,800 in WA, around 9,500 in QLD, 13,000 in VIC and 14,000 in NSW.

The largest financial losses relating to bank write-offs reside in NSW ($1.3 billion) from Owner Occupied borrowers) and VIC ($957 million) from Owner Occupied Borrowers, which equates to 2.1 and 2.7 basis points respectively. Losses are likely to be highest in WA at 4.9 basis points, which equates to $682 million from Owner Occupied borrowers.

You can request our media release. Note this will NOT automatically send you our research updates, for that register here.

[contact-form to=’mnorth@digitalfinanceanalytics.com’ subject=’Request The December 2017 Stress Release’][contact-field label=’Name’ type=’name’ required=’1’/][contact-field label=’Email’ type=’email’ required=’1’/][contact-field label=’Email Me The December 2017 Media Release’ type=’radio’ required=’1′ options=’Yes Please’/][contact-field label=”Comment If You Like” type=”textarea”/][/contact-form]

Note that the detailed results from our surveys and analysis are made available to our paying clients.

[1] RBA E2 Household Finances – Selected Ratios September 2017

More Debt Burdens Households; Again.

The RBA statistical tables were released just before Christmas, and it included E2 – Selected Household Ratios. This chart of the data tells the story – the ratio of debt to income deteriorated again (no surprise given the 6%+ growth in mortgage debt, and the ~2% income growth).  This got hardly any coverage, until now.  Since then mortgage debt is up again, so the ratio will probably cross the 200 point Rubicon next quarter.

The ratio of total debt to income is now an astronomical 199.7, and housing debt 137.5. Both are at all time records, and underscores the deep problem we have with high debt. [Note: the chart scale does not start from zero]

Granted in the current low interest rate environment repayments are just about manageable (for some), thanks to the cash  rate cuts the RBA made but even a small rise will put significant pressure on households. And rates will rise.

Highly relevant given our earlier post about [US] household spending being the critical economic growth driver, Australia is no different.

The current settings will lead to many years of strain for many households. We are backed into a corner, with no easy way to exit.


Some Segments Are More Likely To Buy, But Is It Enough?

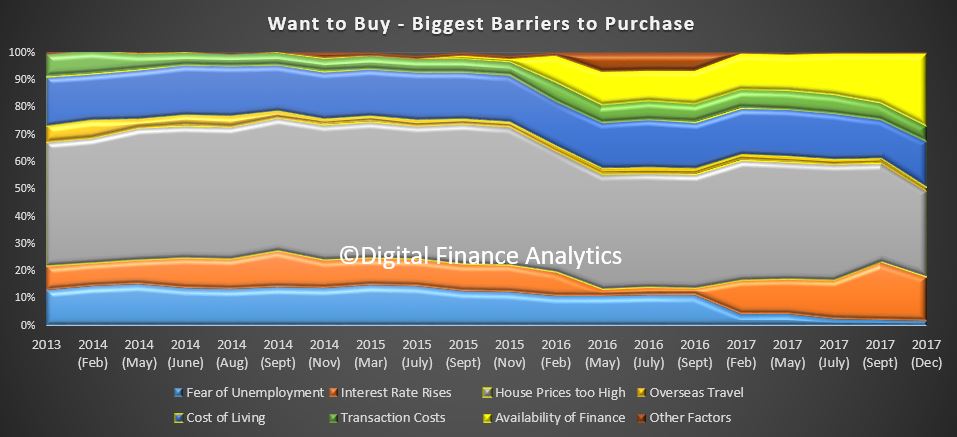
Now, in our review of the results from our household surveys, we look at owner occupied purchasers. We start with “want to buys” – households who would like to purchase but cannot.  High home prices are the strongest barrier (31%), followed by availability of finance (27%), rising costs of living (17%) and concerns about interest rate rises (16%). Unemployment is not currently a major concern.

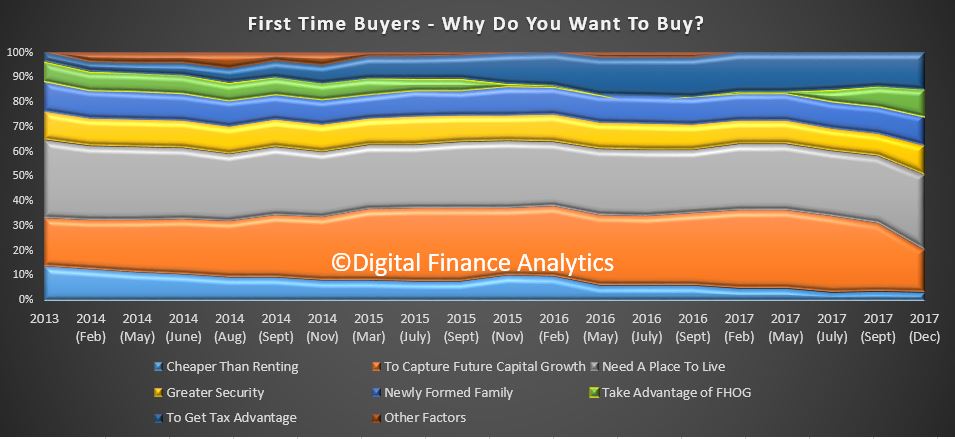
Turning to first time buyers, around 30% are buying for a place to live, while 17% are eying the potential capital gains (down from 31% a year ago). 15% are motivated by tax breaks, and 11% by the availability of first home owner grants (FHOG), up from 1% a year ago.  Greater security is also another factor (12%).

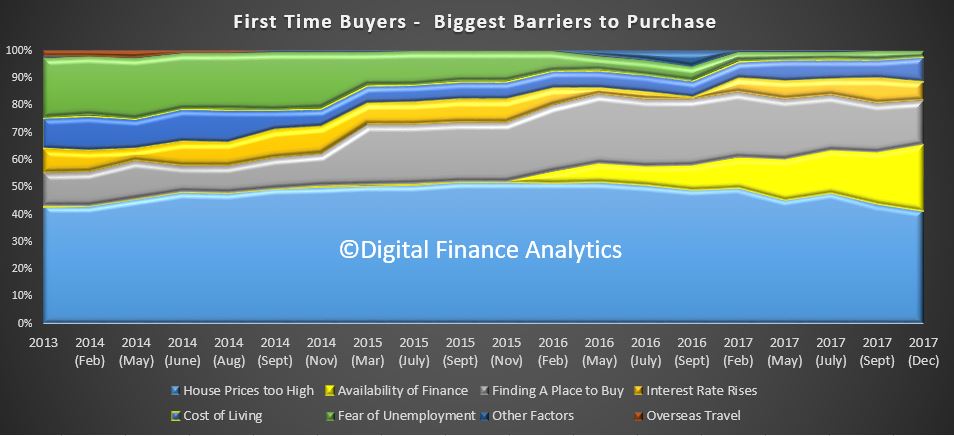
Turning to first time buyer barriers, the most significant challenge is problems with finance availability at 24.5% (compared with 11% a year ago), and house prices 41.1% (compared with 45.5% a year ago). Finding a place to buy is a little easier, down from 24% a year ago to 16% now.

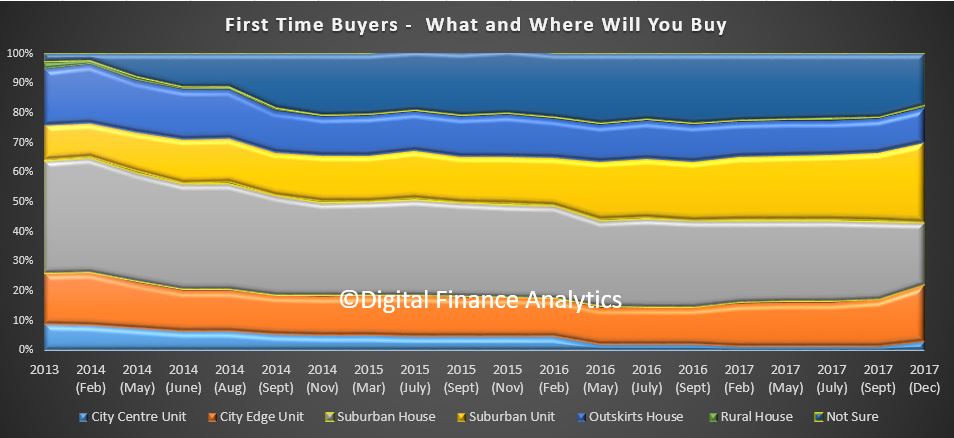
Looking at the type of property they expect to purchase, we see a rise in city edge units, and suburban units, as more purchase an apartment not a house.  17% are not sure what to buy, compared with 22% a year ago.

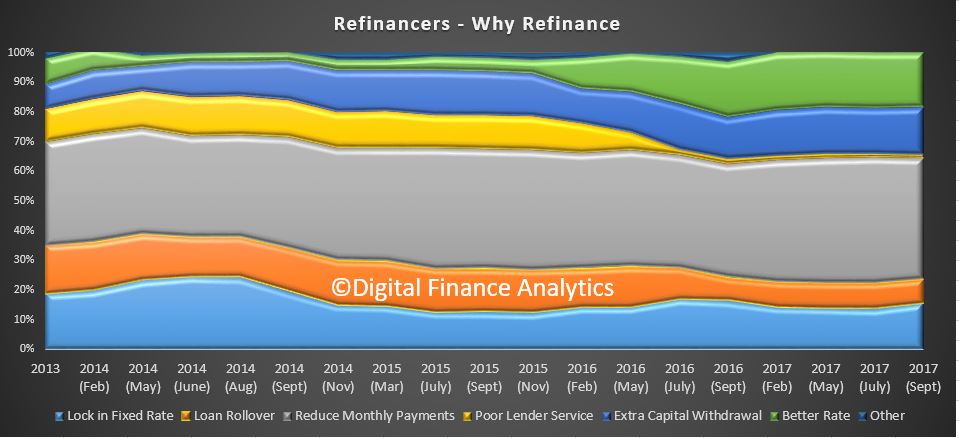
Those seeking to refinance are driven a desire to reduce monthly payments (42%), 17% to withdraw capital, 18% for a better interest rate and 14% to lock in a fixed rate. Poor lender service is not a significant driver of refinancing.

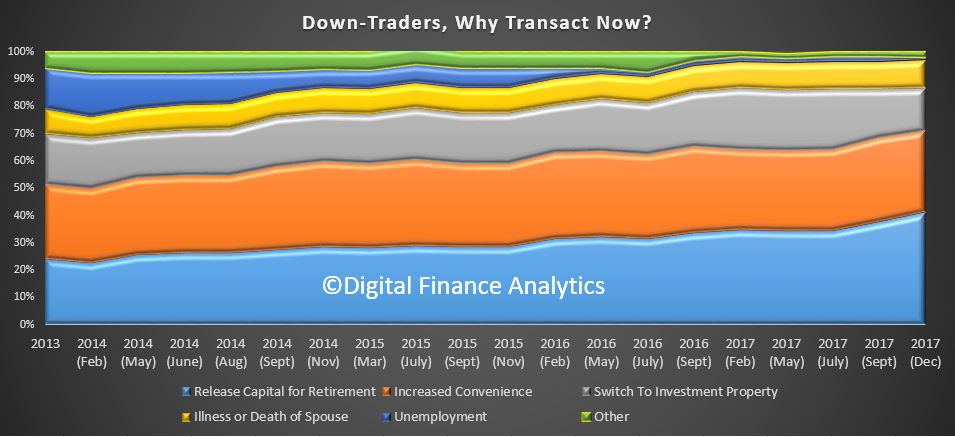
Those seeking to sell and move down the market are seeking to release capital for retirement (41%), up from a year ago, 30% moving for great living convenience, and 10% because of illness or death of a spouse. Interestingly, the attraction of putting funds into an investment property has reduced from 23% a year ago to 16% now.

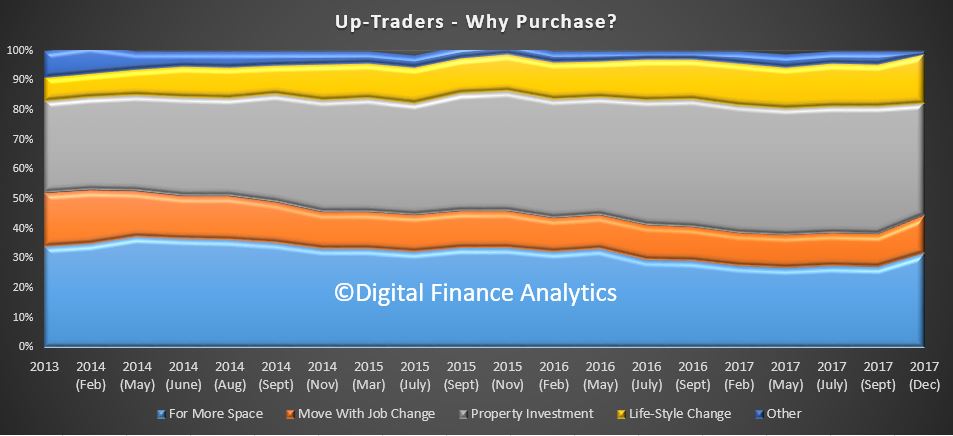
Finally, those seeking to trade up, 32% are doing so to get more space, 38% for investment purposes down from 43% a year ago, 17% for life style change and 13% for job change.

So the surveys highlight the lower appetite for investment property, the barriers limiting access to funds, and the desire to extract capital before prices fall much further.

Putting all this together, we think home prices are likely to fall further, as investor appetite continue to dissipate, and whilst there will be some first time buyer substitution, it will not be sufficient to keep prices high. Sydney, Brisbane and Melbourne markets are most likely to see a fall though 2018.  There is a risk of a more sustained fall if more property investors decide to cut their losses and try to lock in paper profits.


Household Spending Remains Key to U.S. Economic Growth

From The St. Louis Fed On The Economy Blog.

Household-related spending is driving the economy like never before, according to a recent Housing Market Perspectives analysis.

Since the U.S. economy began to recover in 2009, close to 83 percent of total growth has been fueled by household spending, said William R. Emmons, lead economist with the St. Louis Fed’s Center for Household Financial Stability.

“Hence, the continuation of the current expansion may depend largely on the strength of U.S. households,” noted Emmons.

An Examination of the Current Expansion

In July, the U.S. economic expansion entered its ninth year, and it should soon become the third-longest growth period since WWII, Emmons said. He noted that it would become the longest post-WWII recovery if it persists through the second quarter of 2020.

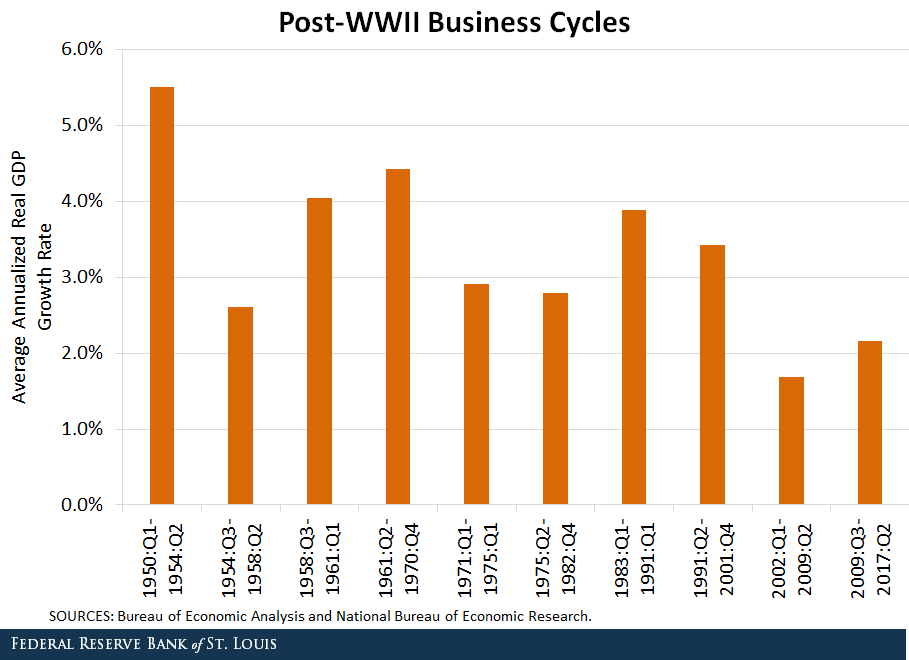
However, the current expansion has been weak and ranks ninth among the 10 post-WWII business cycles, as shown in the figure below.1 “Only the previous cycle, ending in the second quarter of 2009, was weaker,” he said. “That cycle was dominated by the housing boom and bust and culminated in the Great Recession.”

business cycles

The Changing Composition of Economic Growth

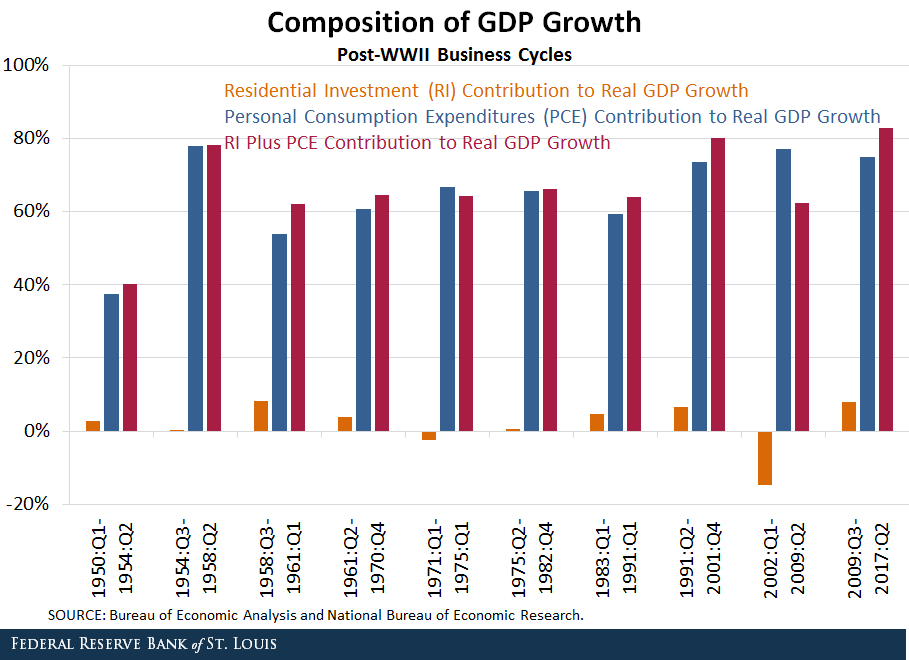
Emmons noted that the composition of economic growth also has changed in recent decades and has generally shifted in favor of housing and consumer spending,2 as shown in the figure below.

GDP Growth

“Only during the brief 1958-61 cycle did residential investment—which includes both the construction of new housing units and the renovation of existing units—contribute proportionally more to the economy’s growth than it has during the current cycle,” Emmons said.

He noted that, perhaps surprisingly, homebuilding subtracted significantly from economic growth during the previous cycle even though it included the housing bubble. “The crash in residential investment was so severe between the fourth quarter of 2005 and the second quarter of 2009 that it erased all of housing investment’s previous growth contributions,” he said.

He noted that residential investment typically subtracts from growth during recessions. Thus, its ultimate contribution to the current cycle likely will be less than currently shown because the next recession will be included as part of the current cycle.

At the same time, he said, personal consumption expenditures (i.e., consumer spending) also have been very important in recent cycles.

Emmons noted that consumer spending has contributed close to 75 percent of overall economic growth during the current cycle. The share was higher in only two other cycles. “Not surprisingly, strong residential investment and strong consumer spending tend to coincide when households are doing well,” he said.

Notes and References

1 The current business cycle began in the third quarter of 2009 and has not yet ended. The provisional “end date” used is the second quarter of 2017, which was the most recent quarter ended at the time this analysis was done.

2 The other components of gross domestic product (GDP) are business investment, exports and imports of goods and services, and government consumption expenditures and gross investment.

A Year In A Week – The Property Imperative 23 Dec 2017

In This Week’s Edition of the Property Imperative we look back over 2017, the year in which the property market turned, focus on the risks to households increased, and banks came under the spotlight as never before.

Welcome the penultimate edition of our weekly property and finance digest for 2017.

We start with the latest Government budget statement, which came out this week.  There was a modest improvement in the fiscal outlook, largely reflecting a boost in tax collections, including from higher corporate profits in the mining sector. But there was also a consumer shaped hole, driven by low wages, lower consumption and lower levels of consumer confidence. Yet, in the outlook, wages are predicted to rise back to 3%, and this supporting above trend GDP growth. This all seems over optimistic to me.

In any case, according to the IMF, GDP is a poor measure of economic progress, with its origins rooted firmly in production and manufacturing. In fact, GDP misrepresents productivity and they say companies that are making huge profits from mining big data have a responsibility to share their data with governments.

The mortgage industry has seen growth in lending at around 6% though the year, initially led by investors piling into the market, but then following the belated regulatory intervention to slow higher risk interest only lending, momentum has switched to first time buyers, at a time when some foreign buyers are less able to access the market. A third of customers with interest-only mortgages may not properly understand the type of loan they have taken out, which could put many in “substantial” stress when the time comes to pay their debt, UBS analysts have warned. We have also seen a change in mix, as smaller lenders and non-banks (who are not under the same regulatory pressure) have increased their share. AFG’s latest Competition index which came out yesterday, showed that Australia’s major lenders have taken a hit with their market share now down to a post-GFC low of 62.57% of the mortgage market.

Household finances have been under pressure this year, with income growth, one third the rate of mortgage growth, so the various debt ratios are off the dial – as a nation we have more indebted households than almost anywhere else.  This is a long term issue, created by a combination of Government Policy, RBA interest rate settings, the financialisation of property, and the rabid growth of property investors – who hold 35% of mortgages (twice the proportion of the UK). The combination of rising costs of living, and out of cycle rate rises, have put pressure on many households as never before – and we have tracked the rise of mortgage stress through the year to an all-time high.

The latest MLC Wealth Sentiment Survey contained further evidence of the pressure on households and their finances. Being able to save has been a challenge for a number of Australians – almost 1 in 5 of us have been unable to save any of our income in recent years, and for more than 1 in 4 of us only 1-5%. Expectations for future income growth are very conservative – nearly 1 in 3 Australians expect no change in income over the next few years and 15% expect it to fall. Our savings expectations for the future are also very conservative – with more than 1 in 5 Australians believing their savings will fall. The “great Australian dream” of home ownership is still a reality for many, but for some it’s just a dream – fewer than 1 in 10 Australians said they didn’t want to own their own home, but 1 in 4 said home ownership was something they aspired to but did not think it would happen.

Of course the RBA continues on one hand to warm of risks to households, as in the minutes published this week, yet also persists with its line that households can cope, with the massive debt burden, as its skewed towards more wealthy groups. They keep referring to the HILDA survey, which is 3 years old now, as a basis for this assertion. They should take note of a Bank of England Working paper which looked at UK mortgage data in detail, and concluded the surveys tend to understand the true mortgage risks in the market – partly because of the methodology used.  They concluded “These results should make policy makers less sanguine about the developments in the UK mortgage market in recent years, which are traditionally analysed using these surveys”.

The latest report from S&P Global Ratings covering securised mortgage pools in Australia to end Oct 2017, showed 30-day delinquency fell to 1.04% in October from 1.08% in September. They attribute part of the decline to a rise in outstanding loan balances during the month, and many older loans in the portfolios (which may not be representative of all mortgages, thanks to the selection criteria for securitised pools). But 90+ defaults remain elevated – at a time when interest rates are rock bottom.

Banks are under the gun, as Government have turned up the pressure this year. There are a range of inquiries in train, from the wide-ranging Banking Royal Commission (which the Government long resisted, but then capitulated), and a notice requiring banks, insurance companies and superannuation funds to detail all cases of misconduct from 2008 onwards has also been issued. The scope includes mortgage brokers and financial advisers. Also the ACCC is looking at mortgage pricing, The Productivity Commission is looking at vertical integration, and we have the BEAR regime which is looking at Banking Executive Behaviour.  This week we also got sight of the Enhanced Financial Services Product Design Obligations, and of course the major banks copped the bank tax. There are also a number of cases before the Courts. This week, NAB said it had refunded $1.7 million for overcharging interest on home loans and CommInsure paid $300,000 following ASIC concerns over misleading life insurance advertising

This tightening across the board is a reaction to earlier period of market deregulation, privatisation and sector growth. But at its heart, the issue is a cultural one, where banks are primary focussing on shareholder returns (as a company that is their job), but at the expense of their customers.  Even now, the decks are stacked against customers, and the newly revised banking code of conduct won’t do much.  We think the Open Banking Initiative will eventually help to lift competition, and force prices lower. But, after many years of easy money, banks are having to work a lot harder, and with much more lead in the saddle bag. Meantime, it is costing Australia INC. dear.

More significantly, the revised Basel rules, though watered down, still tilts the playing field towards mortgage lending, and makes productive lending to business less attractive.  Also there is more to do on bank stress testing according to the Basel Committee. The regulation framework is in our view faulty.

One question worth considering, as the USA and other Central Banks lift their base cash rates, is whether there is really a “lower neutral rate” now. Some, in a BIS working paper have argued that Central Banker’s monetary policy have driven real interest rates lower, rather than demographics. But another working paper, this time from the Bank of England, comes down on the other side of the argument.  The paper “Demographic trends and the real interest rate” says two-thirds of the fall in rates is attributable to demographic changes (in which case Central Bankers are responding, not leading rates lower). In fact, pressure towards even lower rates will continue to increase. This is a fundamentally important question to answer. We suspect the role of Central Bankers in driving rates is less significant than many suspect, and structural changes are afoot.

Rates in Australia have stayed low this year, at 1.5%, despite the RBA saying this is below the neutral setting, and we expect the bank to move later in 2018, upwards. The rate of rise is now expected to be lower than a year ago, but the international pressure will be up. In addition, the US tax reforms will likely switch more investment to the US, and so banks, who rely on international funding, will likely have to pay more. So we still expect real rates to go higher ahead, creating more pressure on households. Also, of course as rates rise, the costs of Governments running deficits rises, something which will be a drag on the budget later.

Home prices continued to rise through 2017 in the eastern states, while in NT and WA they fell. Recent corrections in Sydney may be an indication of what is ahead in the Melbourne market too. Demand remains strong, but lending standards have been tightened, and investors are getting more concerned about future capital appreciation. This year building approvals were still pretty strong, in line with firm population growth. As an aside, an OECD report this week said that Australian property may well be a target for money laundering, and more needs to be done to address this issue.  Auction volumes continue to slide, and we have seen a significant fall in recent weeks.

So, this year we have seen changes in the financial services landscape, the property market is on the turn, and household’s debt levels are rising, creating financial stress for many. As a result, we expect many to spend less this Christmas.

Next time we will discuss the likely trajectory through 2018, but we wanted to wish all our followers a peaceful and restful holiday season. We have really appreciated all the interest in our work – through the year we have more than doubled our readership, thanks to you.

Many thanks for watching. Check back next week for our views on what 2018 may bring.
Bad data collection means we don’t know how much the middle class is being squeezed by the wealthy

From The Conversation.

Australia is falling behind other nations and international bodies in measuring inequality, particularly the concentration of wealth. This also means we are in the dark about the trends affecting Australia’s middle class.

The main source of local data is the Australian Bureau of Statistics (ABS), which publishes a Survey of Income and Housing every two years. The survey provides no information on the wealth of Australia’s top 10%, let alone the top 1% or the top 0.1%. Nor does it quantify the bottom 50%.

The ABS also publishes an index known as the “Gini coefficient”, but as the recent World Inequality Report points out, this indicator can produce the same score for radically different distributions of wealth and downplays the distribution’s top end.

Studying the different groups (such as the top 10%, the middle 40% and the bottom 50%) has become standard in the flourishing international literature on inequality. It has also been embraced by international agencies such as the Organisation for Economic Co-operation and Development (OECD), the International Monetary Fund, the World Bank and increasingly, the United Nations.

As a sign of how far Australia has slipped behind, when we reported on wealth inequality in 2016, we had to draw on data for the top 10% that the ABS had supplied to the OECD but which were not published here in Australia.

Why looking at the middle class matters

The World Inequality Report finds that the share of the world’s wealth owned by the richest 10% of adult individuals is now over 70%. Meanwhile the poorest 50% of people owns under 2% of the total wealth. This is extreme economic inequality.

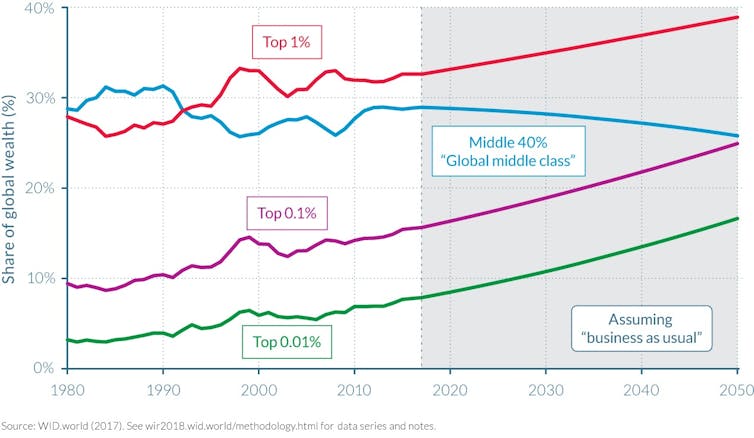
Changes in recent decades have been driven by a surge in wealth accumulation at the very top of the distribution. Worldwide, the wealthiest 1% now owns 33% of the total, up from 28% in 1980. In the United States, the top 1% share has risen from a little over 20% to almost 40%.

This is not a simple story of growing extremities between the global rich and poor. On the contrary, the wealth-share of the bottom 50% has barely changed since 1980.

This means the rise in the top share has come at the expense of that held by the middle class, defined as the 40% of people whose wealth-share lies between the median and the top 10%.

This middle-class squeeze is a long-established trend. The wealth of the top 1% exceeded that of the middle class in the early 1990s, and is projected to reach almost 40% by 2050.

Most gains have accrued to the top 0.1%, a tiny elite whose wealth is projected to equal that of the middle class around the same year. This crossing point has already been reached in the United States, where the top 0.1% now has about the same wealth-share as the bottom 90%.

The squeezed global wealth middle class, 1980-2050

Facundo Alvaredo, Lucas Chancel, Thomas Piketty, Emmanuel Saez and Gabriel Zucman, _World Inequality Report 2018, World Inequality Lab. 2017, Figure E9, p. 13

Better data collection

There is a glaring need to reform Australia’s archaic wealth inequality statistics to make them commensurate with international practice. The political implications are significant.

If there is a squeeze on middle-class wealth, as is happening in many other countries, it is likely to create greater political volatility. Access to more and better data is the key to understanding the trends, and will help ground debate, deliberations and policy decisions. The ABS’ household survey needs to be restructured and integrated with the national accounts and, ideally, tax data.

Perhaps the current Australian government, responsible for funding the ABS, is unconcerned. In that case, it is worth remembering that the ABS is charged with servicing both the Commonwealth and the states, most of whom transferred their statistical agencies to the national body in the 1950s on the understanding that their data requirements would continue to be met. The limitations in the existing data hinder the ability of the states to frame policies for their vital housing, education and health services.

The Council of Australian Governments could be a suitable forum to advance reform, particularly in the event of continued federal inertia. Alternatively, given the revolutionary advances in data collection since the 1950s, it might be feasible for the states to again think about establishing their own statistical agencies to ensure their needs – which is to say, our needs – are properly met.

Authors:Christopher Sheil, Visiting Fellow in History, UNSW; Frank Stilwell, Emeritus Professor, Department of Political Economy, University of Sydney

People on low incomes are sacrificing basic goods to take out insurance

From The Conversation.

[Insurance] is the one thing I will not skimp on, because we don’t know what’s around the corner with my husband being unwell and a disabled son. And now I’ve hurt my foot. I mean, accidents happen. I don’t know what’s around the corner. That’s the first thing that gets paid.

Maggie (all names in this article are psuedonyms), is a single woman in her 50s who lives with her husband and son with disability. She feels health insurance is essential to prepare for seemingly inevitable risks.

To afford insurance, Maggie cuts down on expenses by not buying clothes; she gets free clothes from charity organisations. She also saves money by only purchasing the cheapest marked-down foods that will expire soon and avoiding public transport to save money. And when things are tight she skips meals to make do.

Some people on low incomes put insurance cover first – even if it means doing without basic goods, our research finds. Yet low-income households are the most likely to lack private insurance cover.

Insecure work, low and unstable incomes, and increasingly haphazard and unreliable social protections in education, health, transport and housing continue to make the lives of low-income households risky. Insurance can mitigate some of the harms low-income people face.

To understand how households with low or precarious incomes manage short and longer-term risks, we surveyed 70 people in three areas of suburban Melbourne that experience high levels of financial insecurity. We asked questions about household income and expenditure and how they coped with unexpected expenses.

We found that in order to pay for insurance people were cutting down on heating, food and outings.

Weighing up the odds

The financial problems faced by people on a low income are often explained by poor financial skills, knowledge and behaviours. Yet our research shows that low-income households are also constrained by uncertain and inadequate incomes, unaffordable housing and unexpected high energy costs.

Some of the people we surveyed weighed up their risk of serious incidents and went without insurance because the everyday risks they experienced were more pressing than potential future risks.

Ted, a single man in his fifties receiving the Newstart Allowance, would have liked to have insurance but explained that it was:

just cost prohibitive. I’d rather try and get a roof over my head…than being insured should something happen down the track.

Malcolm, a casually employed factory worker also receiving the Newstart Allowance, said his car was “not worth insuring” for property damage, even though not having insurance exposed him to risk if he damaged another person’s car.

It’s a financial balancing act. Most things that could get damaged on my car I could fix myself…It’s just unnecessary for me. And if it gets written off, it gets written off, and I move on.

Mending the safety net to reduce avoidable risks

Increasingly, private insurance is filling the gaps left by government policies. Instead of enduring the indignities of income support, people are encouraged to take out income protection insurance.

Private health insurance is promoted as a way of avoiding the queue for health care. Inadequate public transport means an increased reliance on private transport – with all the risks and costs that entails.

Insurance providers are aware of the increased risks of inequality. The data insurance companies gather provides fine grained information about the nature of risks to which individuals and insurance companies are exposed.

Research commissioned by the Actuaries Institute notes that because of this data gathering, a growing proportion of the population will be deemed so risky that the price of insurance will become too great for them.

Poor people who already lead risky lives will then be faced with even more risk. The Actuaries Institute report argues that there will be a greater need for government subsidised compulsory insurance to protect those who are exposed to risk beyond their control. But greater access to insurance isn’t the only answer.

Our research suggests that investment in the social safety net could reduce some of the avoidable risks that come with poverty. The government should be ensuring low-income households have access to adequate, predictable income; affordable, quality housing, accessible, affordable public transport and health care. All of these things reduce risks for individuals and contribute to a less divided and risky society.

Authors: Dina Bowman, Principal Research Fellow, Research & Policy Centre, Brotherhood of St Laurence and Honorary Senior Fellow, University of Melbourne; Marcus Banks, Senior Research Fellow, Work & Economic Security, Research & Policy Centre, Brotherhood of St Laurence. Social policy and consumer finance researcher, School of Economics, Finance and Marketing, RMIT University

GOP tax plan doubles down on policies that are crushing the middle class

From The Conversation.

The U.S. middle class has always had a special mystique.

It is the heart of the American dream. A decent income and home, doing better than one’s parents, and retiring in comfort are all hallmarks of a middle-class lifestyle.

Contrary to what some may think, however, the U.S. has not always had a large middle class. Only after World War II was being middle class the national norm. Then, starting in the 1980s, it began to decline.

President Donald Trump has portrayed the tax plan Congress is wrapping up as a boon for the middle class. The sad reality, however, is that it is more likely to be its final death knell.

To understand why, you need look no further than the history of the rise and decline of the American middle class, a group that I’ve been studying through the lens of inequality for decades.

The middle class rises

The middle class, which Pew defines as two-thirds to two times the national median income for a given household size, began to grow after World War II due to a surge in economic growth and because President Franklin Delano Roosevelt’s New Deal gave workers more power. Before that, most Americans were poor or nearly so.

For example, legislation such as the Wagner Act established rights for workers, most critically for collective bargaining. The government also began new programs, such as Social Security and unemployment insurance, that helped older Americans avoid dying in poverty and supported families with children through tough times. The Home Owners’ Loan Corporation, set up in 1933, helped middle-class homeowners pay their mortgages and remain in their homes.

Together, these new policies helped fuel a strong postwar economic boom and ensured the gains were shared by a broad cross-section of society. This greatly expanded the U.S. middle class, which reached a peak of nearly 60 percent of the population in the late ‘70s. Americans’ increased optimism about their economic future prompted businesses to invest more, creating a virtuous cycle of growth.

Government spending programs were paid for largely with individual income tax rates of 70 percent (and more) on wealthy individuals and high taxes on corporate profits. Companies paid more than one-quarter of all federal government tax revenues in the 1950s (when the top corporate tax was 52 percent). Today they contribute just 5 percent of government tax revenues.

Despite high taxes on the rich and on corporations, median family income (after accounting for inflation) more than doubled in the three decades after World War II, rising from $27,255 in 1945 to nearly $60,000 in the late 1970s.

The fall begins

That’s when things started to change.

Rather than supporting workers – and balancing the interests of large corporations and the interests of average Americans – the federal government began taking the side of business over workers by lowering taxes on corporations and the rich, reducing regulations and allowing firms to grow through mergers and acquisitions.

Since the late 1980s, median household incomes (different from family incomes because members of a household live together but do not need to be related to each other) have increased very little – from $54,000 to $59,039 in 2016 – while inequality has risen sharply. As a result, the size of the middle class has shrunk significantly to 50 percent from nearly 60 percent.

One important reason for this is that starting in the 1980s the role of government changed. A key event in this process was when President Ronald Reagan fired striking air-traffic control workers. It marked the beginning of a war against unions.

The share of the labor force that is organized has fallen from 35 percent in the mid-1950s to 10.7 percent today, with the largest drop taking place in the 1980s. It is not a coincidence that the share of income going to earners in the middle fell at the same time.

In addition, Reagan cut taxes multiple times during his time in office, which led to less spending to support and sustain the poor and middle class, while deregulation allowed businesses to cut their wage costs at the expense of workers. This change is one reason workers have received only a small fraction of their greater productivity in the form of higher wages since the 1980s.

Meanwhile, the real buying power of the minimum wage has been allowed to erode since the 1980s due to inflation.

While the middle class got squeezed, the very rich have done very well. They have received nearly all income gains since the 1980s.

In contrast, household median income in 2016 was only slightly above its level just before the Great Repression began in 2008. But according to new unpublished research I conducted with Monmouth University economist Robert Scott, the actual living standard for the median household fell as much as 7 percent due to greater interest payments on past debt and the fact that households are larger, so the same income does not go as far.

As a result, the middle class is actually closer to 45 percent of U.S. households. This is in stark contrast to other developed countries such as France and Norway, where the middle class approaches nearly 70 percent of households and has held steady over several decades.

The Republican tax plan

So how will the tax plan change the picture?

France, Norway and other European countries have maintained policies, such as progressive taxes and generous government spending programs, that help the middle class. The Republican tax package doubles down on the policies that have caused its decline in the U.S.

Specifically, the plan will significantly reduce taxes on the wealthy and large companies, which will have to be paid for with large spending cuts in everything from children’s health and education to unemployment insurance and Social Security. Tax cuts will require the government to borrow more money, which will push up interest rates and require middle-income households to pay more in interest on their credit cards or to buy a car or home.

The benefits of the Republican tax bill go primarily to the very wealthy, who will get 83 percent of the gains by 2027, according to the Tax Policy Center, a nonpartisan think tank.

Meanwhile, more than half of poor and middle-income households will see their taxes rise over the next 10 years; the rest will receive only a small fraction of the total tax benefits.

Trump touts the GOP tax plan with a group of ‘middle-class families.’ Reuters/Kevin Lamarque

From virtuous to vicious

While Republicans justify their tax plan by claiming corporations will invest more and hire more workers, thereby raising wages, companies have already indicated that they will mainly use their savings to buy back stock and pay more dividends, benefiting the wealthy owners of corporate stock.

So with most of the gains of the $1.5 trillion in net tax cuts going to the rich, the end result, in my view, is that most Americans will face falling living standards as government spending goes down, borrowing costs go up, and their tax bill rises.

This will lead to less economic growth and a declining middle class. And unlike the virtuous circle the U.S. experienced in the ‘50s and ’60s, Americans can expect a vicious cycle of decline instead.

Author: Steven Pressman, Professor of Economics, Colorado State University

Global inequality is on the rise – but at vastly different rates across the world

From The Conversation.

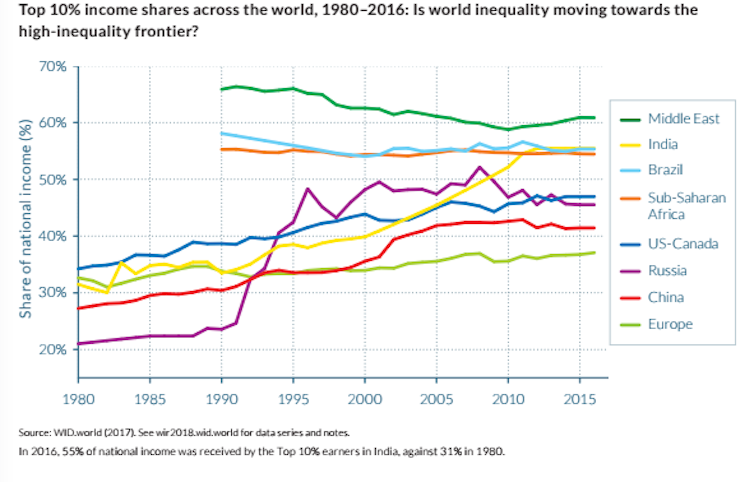
Inequality is rising almost everywhere across the world – that’s the clear finding of the first ever World Inequality Report. In particular, it has grown fastest in Russia, India and China – places where this was long suspected but there was little accurate data to paint a reliable picture.

Until now, it was actually very difficult to compare inequality in different regions of the world because of sparse or inconsistent data, which lacked credibility. But, attempting to overcome this gap, the new World Inequality Report is built on data collection work carried out by more than a hundred researchers located across every continent and contributing to the World Wealth and Income Database.

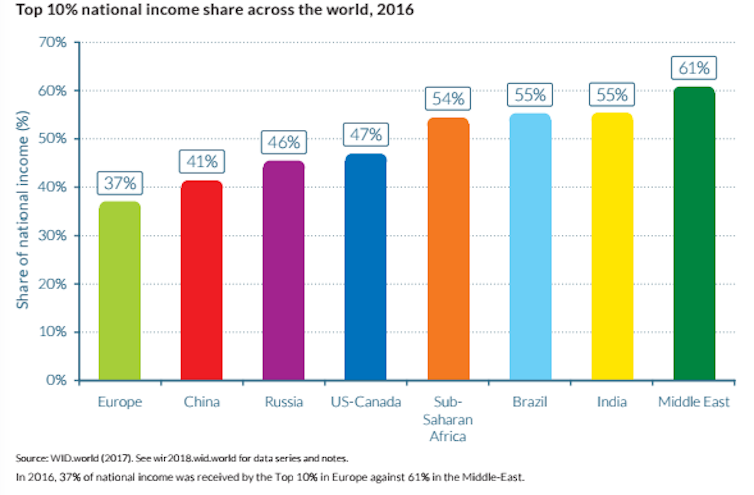
Europe is the least unequal region of the world, having experienced a milder increase in inequality. At the bottom half of the table are Sub-Saharan Africa, Brazil and India, with the Middle East as the most unequal region.

Since 1980, the report shows that there has been rising inequality occurring at different speeds in most parts of the world. This is measured by the top 10% share of income distribution – how much of the nation’s income the top 10% of earners hold.

Places where inequality has remained stable are those where it was already at very high levels. In line with this trend, we observe that the Middle East is perhaps the most unequal region, where the top 10% of income earners have consistently captured over 60% of the nation’s income.

Inequality is always a concern

Even in Europe, where it is less pronounced, equality always raises ethical concerns. For example, in Western Europe, many do not receive a real living wage, despite working hard, often in full-time employment. Plus, the data shows that the top 10% of earners in Europe as a whole still hold 37% of the total national income in 2016.

Rising income inequality should be focal to public debate because it is also a factor which motivates human behaviour. It affects how we consume, save and invest. For many, it determines whether one can access the credit market or a good school for our children

This, in turn, may affect economic growth, raising the question of whether it is economically efficient to have unequal societies.

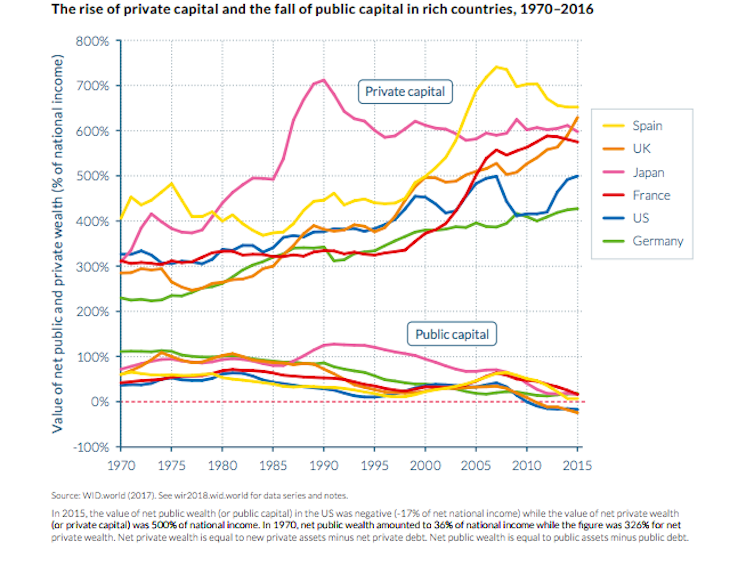
Going into the details of what drives the rise in income inequality, the report shows that unequal ownership of national wealth is an important force. National wealth can be either publicly owned (for example, the value of schools, hospitals and public infrastructure) or privately owned (the value of private assets).

Since 1980, very large transfers of public to private wealth occurred in nearly all countries, whether rich or emerging. While national wealth has substantially increased, public wealth is now negative or close to zero in rich countries. In particular, the UK and the US are countries with the lowest levels of public capital.

Arguably, this limits the ability of governments to tackle inequality. Certainly, it has important implications for wealth inequality among citizens. It also indicates that national policies shaping ownership of capital have been a major factor contributing to the rise of inequality since 1980.

Inequality in the developing world

Resource rich economies are traditionally considered to be prone to conflict or more authoritarian in terms of how they are governed. What this new report tells us is that some resource rich economies, such as “oil economies”, are also extremely unequal. This was often suspected because natural resources are often concentrated in the hands of a minority. Until this report, however, there was no clear evidence.

The World Inequality Report appears to show us that the Middle East region may be even more unequal than Central and South America, which have long been held up as some of the most unequal places on Earth.

Another significant finding is that countries at similar stages of development have seen different patterns of rising inequality. This suggests that national policies and institutions can make the difference. The trajectories of three major emerging economies are illustrative. Russia has an abrupt increase, China a moderate pace and India a gradual one.

The comparison between Europe and the US provides an even more striking example – Western Europe remains the place with the lowest concentration of national income among the top 10% of earners.

Compared with the US, the divergence in inequality has been spectacular. While the top 1% income share was close to 10% in both regions in 1980, it rose only slightly to 12% in 2016 in Western Europe, while it shot up to 20% in the US. This might help explain the rise in populism. Those left behind grow impatient when they do not see any tangible improvement (or even a worsening) in their living conditions.

It is not just important to reduce inequality to make society more fair. Equal societies are associated with other important outcomes. As well as political and social stability, education, crime and financial stability may all suffer when inequality is high.

With this new data at our fingertips, we can now act to learn from the policies of more equal regions and implement them to reduce inequality across the world.

Author: Antonio Savoia, Lecturer in Development Economics, University of Manchester

Digital Transformation IS Revolutionary

An excellent article from Mckinsey which makes the point that if Digital Transformation this isn’t on your agenda, then you’ve got the wrong agenda! Its not about new shiny tech things.  Rather, all value chains will be disrupted, it is revolutionary. The benefits are breathtaking.

Digital transformation is about sweeping change. It changes everything about how products are designed, manufactured, sold, delivered, and serviced—and it forces CEOs to rethink how companies execute, with new business processes, management practices, and information systems, as well as everything about the nature of customer relationships. I’m seeing leaders who get this. They’re all over it: they want to launch five transformation initiatives right now; they’re talking to me and every digital leader they know about where the technology threats are coming from; and they’re hiring the best people to advise them. Yet I’m shocked by—even fearful for—the many CEOs I know who seem to be asleep at the switch. They just don’t see the massive disruption headed their way from digital threats, seen or unseen, and they don’t seem to understand it will happen very quickly.

So when I see CEOs who may be experimenting here and there with AI or the cloud, I tell them that’s not enough. It’s not about shiny objects. Tinkering is insufficient. My advice is that they should be talking about this all the time, with their boards, in the C-suite—and mobilizing the entire company. The threat is existential. For boards, if this isn’t on your agenda, then you’ve got the wrong agenda. If your CEO isn’t talking about how to ensure the survival of the enterprise amid digital disruption, well, maybe you’ve got the wrong person in the job. This may sound extreme, but it’s not.

It’s increasingly clear that we’re entering a highly disruptive extinction event. Many enterprises that fail to transform themselves will disappear. But as in evolutionary speciation, many new and unanticipated enterprises will emerge, and existing ones will be transformed with new business models. The existential threat is exceeded only by the opportunity.