When Holding Cash Beats Paying Debt

From The US On The Economy Blog.

For families who are struggling financially, there are times when it is better to keep some cash on hand, even if they hold high-interest debt.

A recent In the Balance article highlights the importance of emergency savings to the financial stability of struggling households. It was authored by Emily Gallagher, a visiting scholar at the St. Louis Fed’s Center for Household Financial Stability, and Jorge Sabat, a research fellow at the Center for Social Development at Washington University in St. Louis.

The Struggle to Make Ends Meet

Many families continue to struggle to make ends meet, the authors said, noting a recent Federal Reserve survey that estimated that almost half of U.S. households could not easily handle an emergency expense of just $400.

Given this, they asked: “Should more families be encouraged to hold a liquidity buffer even if it means incurring more debt in the short-term?”

In explaining why it might make sense, for example, to keep $1,000 in a low-earning bank account while owing $2,000 on a high-interest-rate credit card, Gallagher and Sabat’s research suggests this type of cash buffer greatly reduces the risk that a family will:

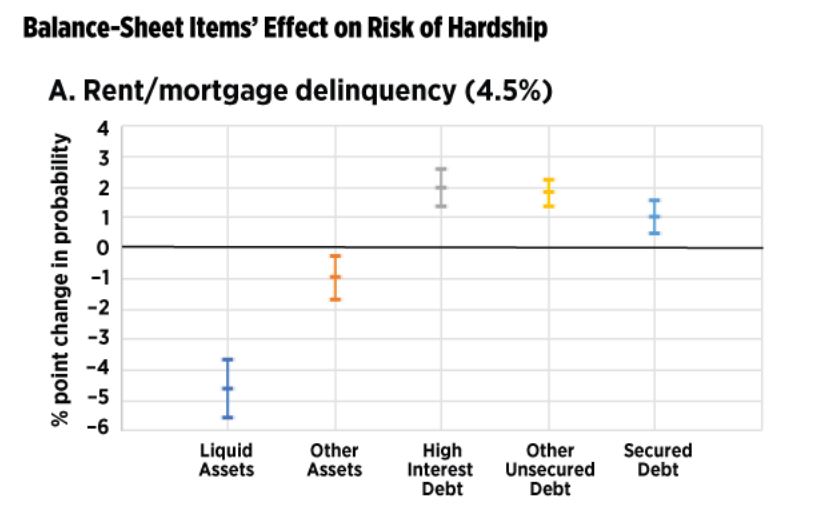
  • Miss a rent, mortgage or recurring bill payment
  • Be unable to afford enough food to eat
  • Be forced to skip needed medical care within the next six months

Linking Balance Sheets and Financial Hardship

Gallagher and Sabat investigated which types of assets and liabilities predicted whether a household would experience financial hardship over a six-month period.

Their survey encompassed detailed financial and demographic results that covered two time-period observations for the same household: one at tax time, and the other six months after tax time.

“This feature of our data set is ideal for capturing the probability that a household that is currently financially stable falls into financial hardship in the near term,” the authors explained. “Furthermore, the survey samples only from low-to-middle income households, our population of interest for understanding the antecedents of financial hardship.”

They tracked families in the first survey who said they hadn’t recently experienced any of these four main types of financial hardship:

  • Delinquency on rent or mortgage payments
  • Delinquency on regular bills, such as utility bills
  • Skipped medical care
  • Food hardship (going without needed food)

Gallagher and Sabat also asked if the family had any balances in:

  • Liquid assets, such as checking and saving accounts, money market funds and prepaid cards
  • Other assets, including businesses, real estate, retirement or education savings accounts
  • High-interest debt, such as that from credit cards or payday loans
  • Other unsecured debt, such as student loans, unpaid bills and overdrafts
  • Secured debt, including mortgages or debts secured by businesses, farms or vehicles

Controlling for factors such as income and demographics, they then tracked whether the 5,000 families in the survey had suffered a financial shock that would affect the results.

Cash on Hand Matters Most

The authors found that having liquid assets or other assets always predicted lower risk of encountering hardship of any kind, while having debts generally increased the risk of hardship.

Liquid assets had the most predictive power, Gallagher and Sabat said. They noted that a $100 increase (from a mean of $6) was associated with a 4.6 percentage point reduction in a household’s probability of rent or mortgage delinquency.

Liquid assets also significantly reduced the likelihood of entering into more common forms of hardship. A $100 increase in liquidity was associated with declines in the rates of:

  • Regular bill delinquency (by 8.3 percentage points)
  • Skipped medical care (by 6.3 percentage points)
  • Food hardship (by 5.2 percent percentage points)

“These estimated effects are substantial relative to the probability of encountering each hardship,” they said.

Conclusion

“Our findings suggest that households should be encouraged to maintain at least a small buffer of liquid savings, even if the cash in that buffer is not being used to pay down high-interest debt,” Gallagher and Sabat concluded.

Unemployment Remained Steady In November 2017

The ABS released the November 2017 employment data today. Overall, the rates remained steady at 5.4% but in trend and seasonally adjusted terms.  But there are considerable differences across the states, and age groups. Female part-time work grew, while younger persons continued to struggle to find work.

Full-time employment grew by a further 15,000 persons in November, while part-time employment increased by 7,000 persons, underpinning a total increase in employment of 22,000 persons. Over the past year, trend employment increased by 3.1 per cent, which is above the average year-on-year growth over the past 20 years (1.9 per cent).

Trend underemployment rate decreased by 0.2 pts to 8.4% over the quarter and the underutilisation rate decreased by 0.3 pts to 13.8%; both quite high.

The unemployment rate was highest in WA at 6.2% and is still rising, while the lowest was in the ACT at 3.8% and falling.  The rate was 4.6% in NSW, 5.7% in VIC,  5.8% in QLD and SA. TAS was 5.9% and NT 4.6%; all in trend terms.

The ABS said that overall employment increased 22,200 to 12,380,100, unemployment decreased 2,900 to 707,300, the participation rate increased less than 0.1 pts to 65.4% and the monthly hours worked in all jobs increased 3.8 million hours (0.2%) to 1,734.4 million hours.

Home Renovation Spending On The Slide Too

According to the HIA, in the December 2017 edition of their Renovations Roundup report which is released today, low wage growth and fewer home sales resulted in a slowing in renovations activity in 2017.

The HIA Renovations Roundup is the most comprehensive regular review of Australia’s $33 billion home renovations market. The report also includes the exclusive results of a survey of 595 renovations firms right across the country.

“The near term outlook for home renovations demand is being held back by sluggish wages growth. Because renovations activity is often initiated by the new owners of older homes, the dip in established house turnover over the past 12 months has not accelerated renovations activity this year,”

“During 2017, home renovations work contracted by 3.1 per cent. A further decline of similar magnitude is projected for 2018.

“The medium term holds better prospects for renovations activity. Interest rates are set to remain lower for longer than previously expected. The ageing of Australia’s dwelling stock will also work in favour of renovations demand – the number of houses in the key renovations age bracket of 30-35 years is going to rise substantially until the early part of the 2020s decade.

“Even though current conditions in the renovations market are marking time, the HIA renovations market survey suggests that 40 per cent of firms still intend to take on extra employees over the next 12 months.” said Shane Garrett, HIA’s Senior Economist.

HIA forecasts that renovations activity will suffer a 3.1 per cent decline during 2018 but that a 3.2 per cent recovery will take hold during 2019. In 2020, the pace of expansion is set to accelerate to 5.7 per cent.

Further growth of 0.9 per cent in 2021 is expected to bring the value of the home renovations market to $35.57 billion – compared with $33.36 billion in 2017.

Greater Perth Mortgage Stress Mapping – Nov 2017

We continue our series featuring the results of our November Mortgage stress update. Today we look at Greater Perth and Western Australia. In WA we estimate there are 124,000 households in mortgage stress, which equates to 30.2% of borrowing households in the state, up 2,500 from last month.  We estimate that 9,800 households risk 30-day default in the next 12 months.

Here is the mortgage stress map for Perth and the surrounding area.

The most stressed WA post code (and second highest nationally) is 6065. This is the area around Wanneroo, including Tapping, Hocking and Landsdale and is located about 25 kilometres north of Perth. It is an area of high population growth and residential construction mainly on smallish lots.  There are more than 6,617 households in mortgage stress in the region. The average home price is $635,000 compared with $529,000 in 2010, and down from a peak of $813,000 in 2014. There are about 17,000 households in the district, with an average age of 33. The average income is $8,300 a month, and 58% have a mortgage with average repayments of $2,170, well above the WA and national averages.

6065 is ranked 4th nationally in terms of prospective mortgage defaults. 6210, including Mandurah and Meadow Springs in the 10th most stressed post code in WA, based on the number of households, but ranks first nationally in terms of potential risk of default.

Greater Adelaide Mortgage Stress Mapping – Nov 2017

We continue our series featuring the results of our November Mortgage stress update. Today we look at Greater Adelaide and South Australia. In SA we estimate there are 80,530 households in mortgage stress, which equates to 28.3% of borrowing households in the state.  We estimate that 3,900 risk 30-day default in the next 12 months.

Here is the mortgage stress map for Adelaide and the surrounding area.

The post code with the highest number of households in stress is 5108, Paralowie and Salisbury with 2,821; a suburb of Adelaide, North & North East Suburbs about 19 kms from the CBD.  There are around 10,500 households in the area, and the average age is 34 years. The ABS Census says children aged 0 – 14 years made up 20.8% of the population and people aged 65 years and over made up 12.3% of the population.

80% of households here live in separate houses. Around 40% have property with a mortgage. The average mortgage repayment is $1,300 a month. The average monthly household income is around $4,440 giving an average loan to income ratio of 29.1%.  The SA income average is higher at $5,250.  In 2010, the average home price was around $210,000 compared with 285,000 today, reflecting average annual growth of around $12,000, well below the national average.

5108 is ranked 90 on our national default ranking.

Next time we look at Perth and WA


Being middle class depends on where you live

From The Conversation.

Politicians are fond of pitching to the “average Australian” but judging by the income of Australians, whether you are middle class depends on where you live. And where we live tells a rich story of who we are as a nation – socially, culturally and economically.

Income is at the heart of access to services and opportunities, which are differing and unequal based on where you live.


Our ability to afford housing that meets our needs largely determines where we live. In turn, where we live influences access to other important features of our lives which shape lifelong and intergenerational opportunities. For example, student performance is associated with everything from where a student lives to their parent’s occupation.

Household incomes in capital cities are typically among the highest, with incomes declining the further you live from major cities. So it’s understandable why Australians living outside or on the fringes of cities might feel somewhat left behind.

The Australian Bureau of Statistics presents “average” income as a range based on where you live. This range is marked by a lower number (30% of incomes) at the beginning and the higher number (80% of incomes) at the top.

This “average” income varies substantially between different rural areas from A$78,548 – A$163,265 in Forrest (ACT) to A$10,507 – A$26,431 in Thamarrurr (NT). This is actually an equivalised household income which factors in the economic resources like the number of people and their characteristics, between households.


The difference between the top and bottom of this range of “average” household income also shows greater inequality within areas.

Even within the greater Sydney metropolitan area, there’s significant differences in household income between areas. The average household equivalised income in Lavender Bay is around A$40,000 – A$95,000 higher than it is in Marayong.

The difference in income is marked, and there are other differences too. People in Marayong are on average younger than Lavendar Bay. Family size is smaller in Lavendar Bay. Over half of the Lavendar Bay residents hold university degrees, compared to a more skill-based workforce in Marayong.

Why there is no one “average” Australian

Cities offer access to myriad employment options. Industries associated with relatively high incomes are typically concentrated in cities to take advantage of global connections.

Sydney, Melbourne and Canberra are notable standouts based on household income. So if you live close to these major cities you’d be getting the most opportunities in terms of employment and income, given the you’re the right candidate.

But not everyone wants to live in the centre of cities. Housing, lifestyle and neighbourhood preferences also play a role in where we live, but are still influenced by income and proximity to such things as employment and family and friends.

Also, infrastructure which supports social and economic wellbeing is essential in communities, regardless of where we live.

What politicians should be talking about instead

Improving the different and unequal access across areas requires better internet connectivity and advances in the way we work. Policies around housing and family-friendly workplaces go some way to supporting Australians in work.

Any measures to redress inequalities require understanding the needs and wants of communities. Proposed planning to reconfigure the greater city of Sydney around population and socioeconomic infrastructure offers an example of a data-driven approach to planning. Whether the proposed reconfiguration of Sydney leads to improvements or greater segmentation will be revealed in practice.

Politicians rarely reflect the characteristics of the people they represent, particularly when we consider the remuneration, entitlements and perks of political office. The longer politicians are in office, and somewhat removed from the people they represent, the further they potentially become from gauging their electorate.

Yet politicians profess to know what the average Australians they represent needs and wants. They apply this to a range of things from service delivery to representation on political matters. And this is within reason.

But without current experience we struggle to see things from perspectives other than our own. Take for example the way some have come to label themselves outsiders from the social and political elite to advance their credibility with average Australians.

Bringing politicians in touch with the diversity of needs and wants of Australians starts with a self-check and recognition of individual bias (conscious or unconscious). This is the first step toward really understanding and connecting with Australians – be it in the “average” or otherwise.

Author: Liz Allen, Demographer, ANU Centre for Social Research and Methods, Australian National University

Greater Brisbane Mortgage Stress Mapping – Nov 2017

Continuing our series on mortgage stress, we feature the results for Brisbane and QLD today. Overall, in the state, stress has fallen a little thanks to brighter employment prospects, especially in the south east. However, some regional areas are under severe pressure.

We estimate there are 157,019 households across the state, down from 162,726 last month. However, around 9,600 in QLD risk default over the next 12 months.

Here is the stress mapping for Greater Brisbane to November 2017.

The post code with the highest stress count is 4350, around Drayton and Toowoomba, about 100 kilometres from Brisbane. We estimate 5,975 households are in mortgage stress. The average home price is $490,000, compared with $382,000 in 2010. There are about 27,000 households in the region and the average age is 37. The average income is $5,300 a month. Around 30% have a mortgage and the average mortgage repayment is $1,510.

Here is the top 10 listing across the state, together with the national default ranking.

Next time we look at South Australia.


Greater Melbourne Mortgage Stress Mapping – Nov 2017 – Pressure Is Mounting

Continuing our series on mortgage stress, we feature the results for Melbourne and VIC today. In fact more than half the post codes nationally in the top 10 are in VIC, so risks are rising fast here (and prices are still rising too!).

In November another 3,000 households in VIC slipped into stress, reaching a new high of 253,000. 13,000 of these risk default in the next 12 months.

Next, here is the overall listing of the top 10 most stressed post codes across VIC as at the end of November 2017. We also show the relative default risk ranking across the country. Cranbourne has the 2nd highest default ranking nationally this month.

The most stressed post code in the state is 3805, which includes Narre Warren and Fountain Gate. This area is around 38 kilometers south east of Melbourne. Here 5,076 households are in mortgage stress. The average home price is $545,000 compared with $366,000 in 2010.  There are more than 15,000 families in the area, and the average age is 34 years. The average household income is just over $7,000 a month, which is higher than the national average. 54% of homes are mortgaged and the average monthly repayment is $1,700 slightly below the national average of $1,755.

Next is 3806, Berwick and Harkaway which is around 40 kilometers south east of Melbourne, with 4,923 households in mortgage stress. The average home price is $625,000 compared with $451,000 in 2010. There are around 13,000 families in the area, with an average age of 36. More than 47% of households here have a mortgage and the average repayment is $1,850 compared with the average income of $7,600.

Next is 3810, Packenham, with 4,693 households now in mortgage stress and in the same position as last month. It is around 54 kms south east of Melbourne. The average home price is around $435,000 compared with $290,000 in 2010. According to the latest census the average age is 32 years and there are more than 12,600 families in the district. The average monthly household income is $5,900, below the average in the state as well as nationally. 46% of homes have a mortgage, compared with the VIC average of 35%. The average monthly mortgage repayment is $1,700.

Then comes 3064 Craigieburn, Mickleham and Roxburgh Park.  It is about 24 kms North from Melbourne. Around 4,445 households in the area are in mortgage stress. There are about 19,300 households in the area and the average age is 30. The average home prices in 2010 was $335,500 and is now worth $489,400. The average income is around $6,400, which is slightly above the Victorian and Australian averages.  88% of properties in the area are separate houses, and most have three or more bedrooms. More than 56% of homes here are mortgaged and the average repayment each month is $1,733, which is close to the average in Victoria, but lower than the Australian average.

Next is post code 3350, which includes Ballarat and the surrounding area, It’s about 100 kilometres from Melbourne and is down one place from last month. In this region there are 4,429 households in mortgage stress. The average property value is $335,000, compared with $281,000 in 2010. There are more than 14,500 families in the area and the average age is 37, line ball with the average across the state. The average monthly income is $5,300, well below the national and state averages. Around 33% of households have a mortgage and the average repayment is $1,408 a month.

Finally is post code 3037, which includes areas around Delahey, Hillside and Sydenham; around 20 kms north west of Melbourne.  Here around 4,268 households are in mortgage stress. Of the 13,000 households in the district, more than half have a mortgage and the average age is 33. The average home price is around $530,000, up from $365,000 in 2010. The average monthly income is around $7,200 and the average mortgage repayment is $1,730.

We continue to see mortgage stress still strongly associated with fast growing suburbs, where households have bought property relatively recently, often on the urban fringe. The ranges of incomes and property prices vary, but note that it is not necessarily those on the lowest incomes who are most stretched. Banks have been more willing to lend to these perceived lower risk households but the leverage effect of larger mortgages has a significant impact and the risks are underestimated.

Next time we will look at Brisbane.


Greater Sydney Mortgage Stress Mapping – Nov 2017

Having released our November Mortgage Stress analysis, we now look across the states in more detail. Today we look at NSW and Greater Sydney.

NSW has 251,576 households in stress, up 9,000 from last month, and we estimated there are around 13,900 households at risk of default over the next 12 month in the state.

Here is the stress mapping around Great Sydney of the count of households in difficulty. We see a swathe of issues across Western Sydney.

The post code with the highest count of stressed household is 2170, the area around Liverpool, Warwick Farm and Chipping Norton, which is around 27 kilometers west of Sydney. There are 6,807 households in mortgage stress here. The average home price is $803,000 compared with $385,000 in 2010. There are around 27,000 families in the area, with an average age of 34. The average income is $5,950. 36% have a mortgage and the average repayment is about $2,000 each month.

Next is the area around Campbelltown, 2560, which is around 43 kilometers inland from Sydney. Here 5,786 households are in mortgage stress. The average home price is $625,000, up from $320,000 in 2010. Around 20,000 households live in the area with an average age of 34 years. The average income is $6,100 a month. 37% have a mortgage and the average repayment is higher than the national average at $1,800.

We continue to see mortgage stress still strongly associated with fast growing suburbs, where households have bought property relatively recently, often on the urban fringe. The ranges of incomes and property prices vary, but note that it is not necessarily those on the lowest incomes who are most stretched. Banks have been more willing to lend to these perceived lower risk households but the leverage effect of larger mortgages has a significant impact and the risks are underestimated.

Next, here is the overall listing of the top 10 most stressed post codes across New South Wales as at the end of November 2017. We also show the relative default risk ranking across the country. We will explore risk of default further in a later post, not least because we get different distributions depending on whether we look at the number of defaults, or the absolute value at risk.

Meanwhile, in our next stress-related post, we will look at Victoria.

Mortgage Stress Continues On a High Plateau In November

Digital Finance Analytics has released the November mortgage stress and default analysis update. Across Australia, more than 913,000 households are estimated to be now in mortgage stress (last month 910,000) and more than 21,000 of these in severe stress, the same as last month. Stress is sitting on a high plateau. This equates to 29.4% of households. We see continued default pressure building in Western Australia, as well as among more affluent household, beyond the traditional mortgage belts across the country. Stress eased a little in Queensland, thanks to better employment prospects.

We estimate that more than 52,000 households risk 30-day default in the next 12 months, similar to last month. We expect bank portfolio losses to be around 2.8 basis points, though with losses in WA rising to 4.9 basis points.

We discuss the findings from our analysis and count down the top 10 post codes, to identify the most highly stressed post code currently in the country.

As continued pressure from low wage growth and rising costs bites, those with larger mortgages are having more difficulty balancing the family budget. As a result, risks in the system continue to rise, and while recent strengthening of lending standards will help protect new borrowers, there are many households currently holding loans which would not now be approved. These stressed households are less likely to spend at the shops, which will act as a further drag anchor on future growth, one reason why retail spending is muted. The number of households impacted are economically significant, especially as household debt continues to climb to new record levels. Mortgage lending is still growing at three times income. This is not sustainable. The latest household debt to income ratio is now at a record 193.7.[1]

Our analysis uses the DFA core market model which combines information from our 52,000 household surveys, public data from the RBA, ABS and APRA; and private data from lenders and aggregators. The data is current to end November 2017. We analyse household cash flow based on real incomes, outgoings and mortgage repayments, rather than using an arbitrary 30% of income.

Households are defined as “stressed” when net income (or cash flow) does not cover ongoing costs. Households in mild stress have little leeway in their cash flows, whereas those in severe stress are unable to meet repayments from current income. In both cases, households manage this deficit by cutting back on spending, putting more on credit cards and seeking to refinance, restructure or sell their home.  Those in severe stress are more likely to be seeking hardship assistance and are often forced to sell.

The forces which are lifting mortgage stress levels remain largely the same. In cash flow terms, we see households having to cope with rising living costs whilst real incomes continue to fall and underemployment remains high. Households have larger mortgages, thanks to the strong rise in home prices, especially in the main eastern state centres. While mortgage rates remain quite low for owner occupied borrowers, those with interest only loans or investment loans have seen significant rises.  We expect some upward pressure on real mortgage rates in the next year as international funding pressures mount, a potential for local rate rises and margin pressure on the banks. We revised our expectation of potential interest rate rises, given the stronger data on the global economy and the recently announced Finance Sector  Royal Commission.

Probability of default extends our mortgage stress analysis by overlaying economic indicators such as employment, future wage growth and cpi changes.  We have also extended our Core Market Model to examine the potential of portfolio risk of loss in basis point and value terms. Losses are likely to be higher among more affluent households.

Gill North, Joint DFA Principal and Professorial Research Fellow in the law school at Deakin University, said “the numbers of households in mortgage and financial stress in Australia are at record levels and the consequential risks and likely adverse impacts are difficult to overstate. When external events and or the personal circumstances of these highly indebted households deteriorate, the number of people who cannot afford to rent or purchase a home is likely to increase exponentially, leaving many more households without adequate accommodation. In extreme instances, other households may lose the residential property they presently live in due to rental defaults or a forced sale or foreclosure.”

While there have been numerous inquiries into housing affordability and homelessness in Australia, the issues involved are complex, and real progress has been limited (at best). For policy options to make any meaningful difference to the nature and scale of housing affordability and homelessness, policy makers and others need to acknowledge the sheer magnitude of the problem, and respond accordingly.

One of the options that policy makers have considered to address affordable housing issues and to provide housing for the most vulnerable sections of the community is the use of social impact investment.  Gill North was part of a team that reviewed the potential for impact investment models to provide housing for the vulnerable and reported to the Australian Housing and Urban Research Institute (AHURI). The report on “Supporting Vulnerable Households To Achieve Their Housing Goals: The Role Of Impact Investment” is available from https://ssrn.com/author=905894. The report authors acknowledge and thank AHURI for the funding that allowed this important research”.

By the Numbers

Regional analysis shows that NSW has 251,576 households in stress (242,399 last month), VIC 253,248 (250,259 last month), QLD 157,019 (162,726 last month) and WA 123,849 (121,393 last month). The probability of default rose, with around 9,800 in WA, around 9,600 in QLD, 13,000 in VIC and 13,900 in NSW.

The largest financial losses relating to bank write-offs reside in NSW ($1.3 billion from Owner Occupied borrowers) and VIC ($870 million from Owner Occupied Borrowers, which equates to 2.1 and 2.7 basis points respectively. Losses are likely to be highest in WA at 4.9 basis points, which equates to $682 million from Owner Occupied borrowers and $108 million from Property Investors over the next 12 months.

You can request our media release. Note this will NOT automatically send you our research updates, for that register here.

[contact-form to=’mnorth@digitalfinanceanalytics.com’ subject=’Request The Nov 2017 Stress Release’][contact-field label=’Name’ type=’name’ required=’1’/][contact-field label=’Email’ type=’email’ required=’1’/][contact-field label=’Email Me The Nov 2017 Media Release’ type=’radio’ required=’1′ options=’Yes Please’/][contact-field label=”Comment If You Like” type=”textarea”/][/contact-form]

Note that the detailed results from our surveys and analysis are made available to our paying clients.

[1] RBA E2 Household Finances – Selected Ratios June 2017