Rental insecurity: why fixed long-term leases aren’t the answer

From The Conversation.

The insecurity of rental housing and unsatisfactory condition of many properties are receiving much-deserved media attention following the release of a national survey of tenants.

However, the stock response to the insecurity this revealed – longer fixed-term agreements – is not the answer. The solution to the failure of existing legal protections must take into account the structural features of the rental market, including the mobility of tenants.

The survey, commissioned by Choice, National Shelter and the National Association of Tenant Organisations, presents evidence of a widespread sense of worry, dissatisfaction and injustice on the part of tenants. According to respondents:

  • 75% feel that competition for rental properties is “fierce”;
  • 50% are concerned about being “blacklisted” on a tenancy database;
  • 50% have experienced some form of discrimination;
  • 30% live in properties requiring non-urgent repairs, and 8% require urgent repairs;
  • 11% experienced a rent increase; and
  • 10% reported an angry response after requesting repairs.

Residential tenancy laws cover many of these problems. That tenants are not successfully exercising their legal rights indicates a deeper problem of insecurity in renting. This problem is both structural and legal.

Small landlords and mobile tenants

Small landlords dominate the Australian rental sector: 72% own a single property each. Most (62%) make a net rental loss, so it is important to them that they can switch out of the sector when it suits them.

Research for the Australian Housing and Urban Research Institute (AHURI) indicates that 21% of landlords exit the sector within their first 12 months. By five years, 59% will have exited.

When landlords exit, they might sell to another landlord or an owner-occupier. Older research indicates that the transfer of rental housing into owner-occupation is a significant feature of the Australian market.

These dynamics cause structural insecurity for tenants. They also mean many landlords do not willingly tie up their sole asset in a long fixed term.

Despite the legal and structural insecurity of the sector, most moves by tenants are for their own reasons.

The ABS Housing Mobility and Conditions survey shows that tenants generally are very mobile: 81% have been in their current premises for less than five years. About half of moves between rental premises were for “personal reasons” (including family and employment reasons); 20% were to get more suitably sized housing; and 15% because of a termination notice from the landlord.

This degree of mobility suggests it is not in most tenants’ interest to enter into long fixed terms and the rental liability it entails. That’s not to mention the risk of being tied to a small landlord who is an unknown quantity and has no business reputation to protect.

Residential tenancies law in Australia

Each state and territory in Australia has its own Residential Tenancies Act. These differ in the details but are broadly similar in outline. All provide standard terms for tenancy agreements, processes for rent increases and terminations, and relatively accessible dispute resolution and eviction procedures.

Most do a decent job, on paper at least, when it comes to repairs and maintenance. Generally speaking, landlords are obliged to ensure rented premises are provided fit for habitation and maintained in a reasonable state of repair.

This means tenants are entitled to repairs even if the premises were in bad condition to begin with, and even if they pay relatively low rent. Tasmania is an exception: there, landlords are obliged to maintain premises in the condition in which they were first provided.

Similarly, each state and territory prohibits landlords from interfering in tenants’ quiet enjoyment of their premises. Most expand this right to protect tenants’ “reasonable peace, comfort and privacy”.

These are important protections, even though there may be scope to improve them – for example, by adding specific standards for safety devices and fixing particular legal defects like Tasmania’s. The great problem is that the ability of landlords to give notices of termination without grounds undermines the existing protections in every state and territory.

Without-grounds termination notices give cover to terminations by landlords for bad reasons, such as retaliation and discrimination. This means the prospect of receiving such a notice hangs over tenants when repairs and other issues arise.

What’s the solution, then, to high insecurity?

The legal insecurity of tenants might be improved in several ways.

Under the current laws of each state and territory, a fixed term prevents the landlord from terminating without grounds, and on other grounds such as sale or change of use of the premises, for the duration of the fixed term. It also prevents the tenant from lawfully terminating without grounds.

The idea of long fixed-term tenancy agreements is occasionally raised in the media and has caught the attention of the New South Wales and Victorian governments in their reviews of residential tenancies laws. Both those governments are considering how to facilitate long (five-year) fixed terms, including by altering other aspects of their laws – such as the protections about repairs.

But this approach presents problems of its own. Long fixed terms are unwieldy for landlords and tenants. Trying to make them more useful also threatens other valuable legal protections.

The present structures of the Australian rental sector call for different reforms.

We can reconcile the mobility of tenants with their sense of insecurity if we think of “security” as more than just the legal right to occupy. AHURI researchers have conceived of “secure occupancy” to encompass a person’s ability to make a home of premises and exercise housing autonomy. This includes the ability to confidently get repairs done in one’s premises, or keep a pet – and to freely decide to make a new home elsewhere.

This conception points towards a stronger reform agenda for improving security. Instead of long fixed terms, we should abolish without-grounds termination by landlords.

The law should instead provide a comprehensive set of reasonable grounds for termination, with notice periods and exclusion periods appropriate to each ground. This accommodates our present lot of small landlords, and can be done immediately.

Over a longer term, we should set our housing tax and finance policies to get a more stable sort of landlord. That would be one who operates at greater scale, has a reputation to protect and is less interested in switching out of the sector than in receiving a steady trickle of rents from secure tenants.

Author: Research Fellow, Housing Policy and Practice, UNSW

Bank Switching Is A Pain

According to the Customer Owned Banking Association, Australians are willing to switch home loans but believe the process is too painful, there’s too much paperwork and it’s not worth the effort.

These are some of the key findings of a national poll of 1000 Australians by BLACKMARKET Research on what drives competition in the banking market.

“This poll shows Australians want competitive home loans, but they’re being let down by the switching system,” COBA CEO Mark Degotardi said.

“Polls like this tell us there’s a problem – people want to switch but find it too hard to do so, so they simply give up. That’s not genuine banking competition.

“We believe one of the reasons is the amount of time between a consumer asking to switch and their current home loan provider completing the paperwork.

“All stakeholders need to have a closer look at this issue to see if switching can become more efficient.

“If people want to switch from a major bank to a customer owned banking institution, we find it hard to understand in 2017 how it can take up to three months in some cases.”

The BLACKMARKET Research poll of 1000 Australians found:

  • 36% of people say are they are fairly/very likely to change home loans in the next 12 months
  • More than one-third of people say they haven’t switched because the process is painful
  • One in five gave the reason of paperwork or it not being worth the effort for not switching

The poll also found many customers were happy with their current provider, including four out of five customer owned banking customers.

“Customer owned banking is doing well, with market leading customer satisfaction and net promoter score ratings,” Mr Degotardi said.

“Part of the reason is our highly competitive and award winning products, including our home loans that have average standard variable home loan rates 0.64%* lower than the big four banks.

“If consumers shop around they will see there’s real value in switching to a customer owned alternative.”

*14 February, 2017: Comparison calculated using data sourced from the Canstar Online Database for standard variable rate products, which are available to owner occupiers borrowing $400,000 at an 80% LVR. Package, basic, and introductory rates are excluded.

More On Household Debt, From The ABC

ABC’s RN Breakfast‘s Business Reporter Michael Janda discussed household debt as part of his segment on Radio National Breakfast this morning, and was kind enough to mention our recent research on owner occupied and investment housing debt sensitivity.

There was a subsequent flurry on Twitter discussing the DFA research approach.

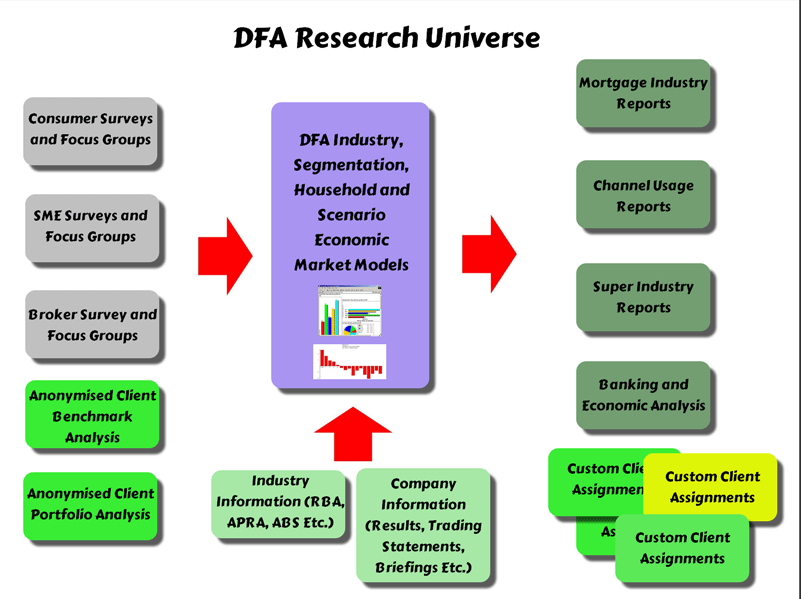
To be clear, our household modelling is based on a rolling 26,000 statistically robust omnibus survey, to which each month we add 2,000 new households and drop off the oldest set. We have data from more than 10 years of research and it feeds our programme of activity and is reflected in the DFA blog.

From a mortgage stress perspective, we run our modelling, based on our household profiles and segments, which looks at net cash flow (before tax) and we also sensitive the modelling based on potential future rate movements. We take account of their total financial position, including other debt demands, and costs of living.

You can read more about our modelling here.  If you want to read our mortgage stress work, this overview is a great place to start.

P.S. Our research is separate and distinct from other research in the housing affordability arena, including the international Demographia survey. Whilst some of the findings may align, the research is based on different underlying research sources.


More First Time Buyers Open An Account At “The Bank of Mum and Dad”

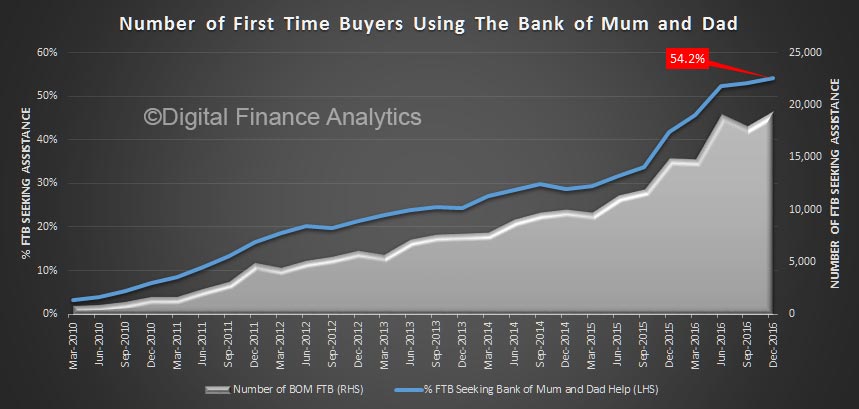
We have updated our analysis of assistance first time buyers are getting from their families in a desperate effort to get into the housing market at a time when the entry barriers in terms of price and affordability are as high as ever they have been. In addition, high loan-to-value loans are less available, so first time buyers need a larger deposit, and first owner grants are harder to access. Savings interest rates are also very low.

We released analysis a few months back, which caused quite a stir as it highlighted the inter-generational  issues in play. We have now updated the quarterly analysis with data to December 2016.

First, more first time buyers are getting help from parents – up to 54% in the past quarter. This help varies from a loan for a deposit, a cash present, help with transaction expenses, or ongoing assistance with mortgage repayments or other household expenses.   Parental guarantees are falling out of favour.

Parents are able to assist, thanks to the wealth effect created by home price appreciation, which is still occurring in the eastern states, though more patchily elsewhere.

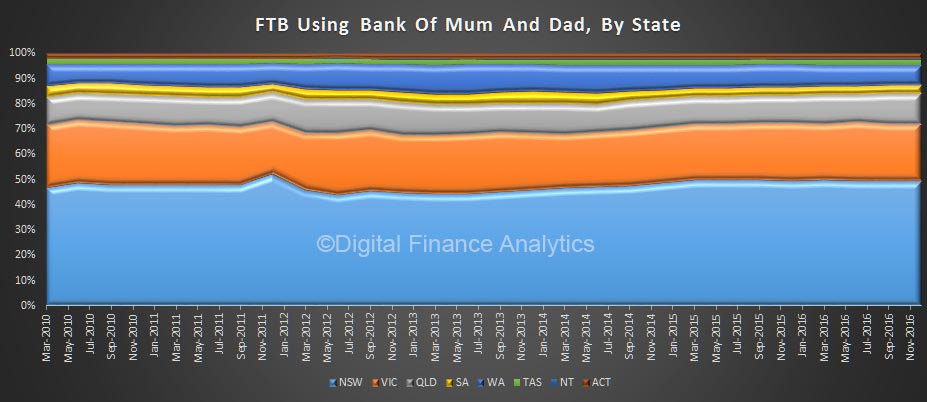
Just under half the assistance is going towards first time buyers in NSW (mainly Greater Sydney), where the affordability issues are most difficult, and home prices the highest. But other states are also, to some extent, also in the game.  Ignoring the volume growth, the percentage mix has been relatively stable.

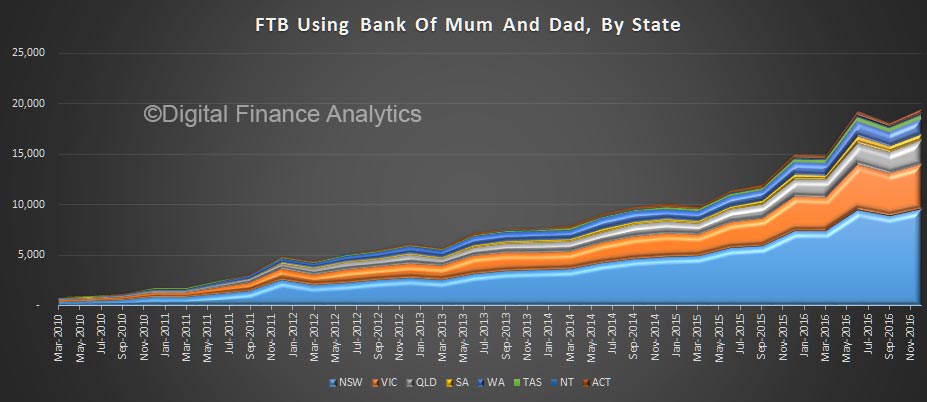
But here is the volume picture, which shows the relative number across states (note the small counts in some states are less statistically robust), but the trends are clear.

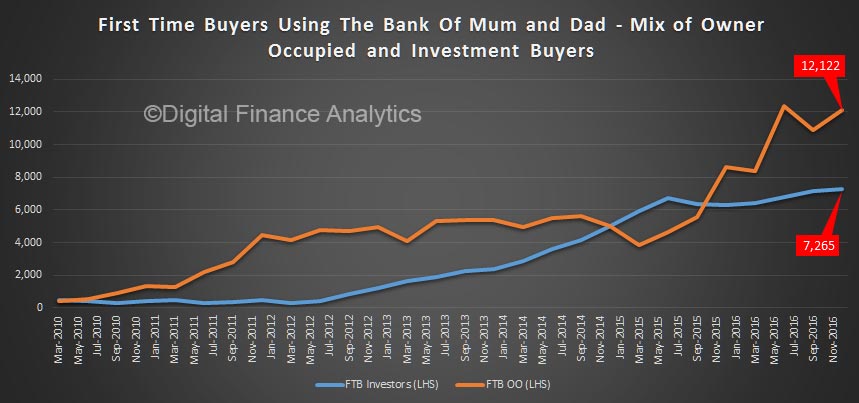
Another cut on the data is looking at the type of property being purchased. In 2015, more investment property was is the mix, but now the growth is among owner occupied purchasers.

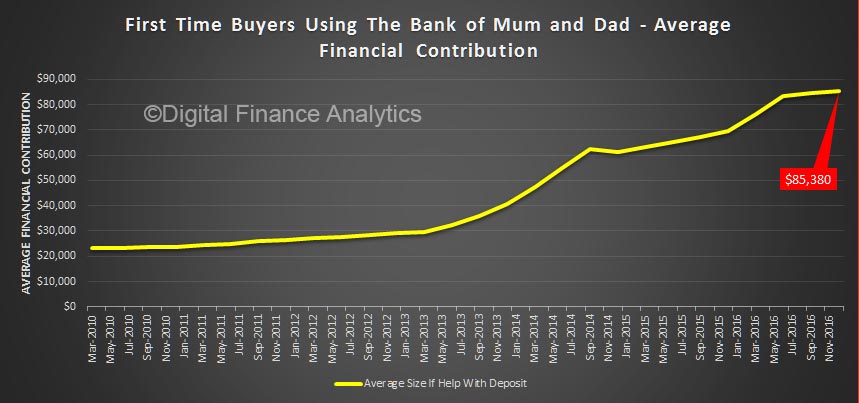
In terms of the value of the financial contribution, it varies. But for those making a loan or payment direct to assist in a purchase by way of a deposit, the average amount is now north of $85,000.

If parents bring forward payments to assist their offspring, it is worth asking whether this act of kindness may have unintended consequences.

  • First, are parents giving away some of their future financial security?
  • If it is a loan, is the basis of repayment clear, and documented?
  • When a bank assesses a mortgage application do they consider the source of the deposit – receiving a “seagull” lump sum is not the same as demonstrating a history of saving, and the risk profiles down the track are different.

It also raises complex questions around equity between siblings, and a whole raft of questions relating to inter-generational finance.

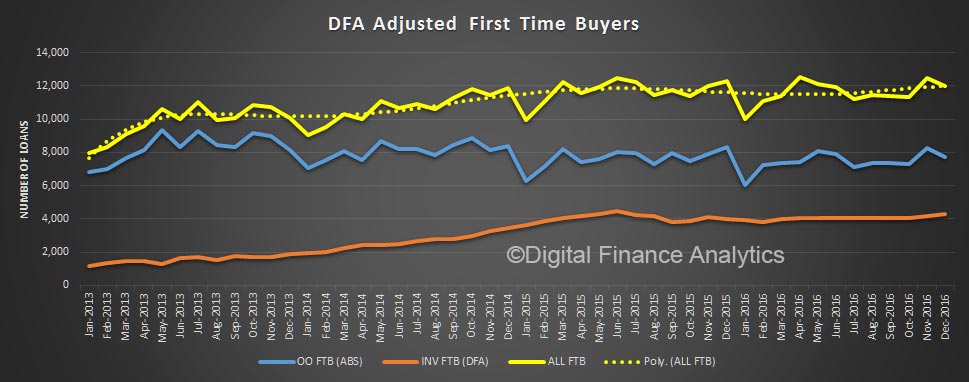
It is also worth remembering that more first time buyers are going to the investment sector before purchasing their own home for owner occupation, as our first time buyer tracker shows.

Australia Post salary scandal highlights our nation’s growing wage inequality

From The Conversation.

How much more than an average worker should a CEO earn? Research shows Australians believe CEOs should earn eight times more. It is perhaps unsurprising, then, that revelations about the salary of Australia Posts CEO Ahmed Fahour have caused a public furore this week.

Fahour’s pay is estimated at up to 119 times that of a postal worker, and 73.5 times that of the average earnings in the transport, postal and warehousing industry.

In 2015-16, he earned A$5.6 million – made up of A$4.4 million in salary and superannuation, and a A$1.2 million bonus. This has – at least for now – rightly put wage inequality on the national political agenda.

Questions of transparency

It’s not just that it’s a lot of money. Australia Post has, until this week, been able to keep Fahour’s salary top secret. It adamantly did not want us to know, even trying to gag the Senate committee it was required submit the information to in 2016.

Australia Post protested that revealing the size of the managerial swag-bag might mean people would “become targets for unwarranted media attention”. It also griped that making the bulging pay packets public could “lead to brand damage for Australia Post”.

This is corporate double-speak writ large. Brand damage for sure. But the reason is that the top-six Australia Post executives earn the same as half of the business’ total profits. Customers and citizens might rightly think this is just wrong – and, in the end, the customer is the one who is paying.

Executive pay comparisons

There is a rule of thumb in business ethics called the “New York Times Test”. It states that a business should not do anything that it would not want to see reported on the front page of the newspaper. Australia Post has not only failed this test, but it has deliberately tried to avoid being subject to it by its insistence on secrecy.

Australia Post is especially sensitive because it is a government-owned corporation. So, while it can still earn profits, there are no shareholders it is accountable to. Ultimately, Australia Post is answerable to the government.

Overindulgent executive salaries are usually rationalised with vague arguments that eschew responsibility. Managers and their PR minions harp on about the need to compete for global talent. Australia Post joined the chorus, very specifically defending the salaries of its chiefs because they were “in line with market practice”.

The poverty of this argument is palpable. Australia is leading the way internationally on this executive salary creep. And top postal executives in other countries earn a fraction of what is paid here. Britain’s postal boss does well, earning the equivalent of A$2.5 million. Fahour’s US counterpart takes home just A$543,616. In Canada, the salary is A$497,000.

The public has responded to news of Fahour’s salary with justified indignation. Even Prime Minister Malcolm Turnbull chimed in, saying he thinks Fahour’s salary is excessive.

As exorbitant as Fahour’s salary might be, it is just the tip of the iceberg when it comes to executive pay in Australia. It even looks relatively modest when compared to the sums taken home by CEOs in the corporate sector.

Peter and Steven Lowy at Westfield share A$25 million in realised pay. Seek’s Andrew Bassat yields just under A$20 million, and Nick Moore at Macquarie Group scrapes in over A$16 million.

These salary extravagances seem tame if you think that the top 1% of Australians have as much wealth as the bottom 70%. Gina Rinehart and Harry Triguboff alone own more that the bottom 20%.

Missing the broader point

The real point of all of this has been totally missed in the rush to side-step political accountability.

For Turnbull, it was just another “not my job” moment. The Australia Post board responded in a similarly dismissive way, with a promise to have “a discussion” the best it could muster.

At least the Senate had the nerve to call Australia Post chairman John Stanhope to publicly justify its executive wage bill at Senate Estimates later this month.

Meanwhile, the cost of living for average Australians and its relationship to wages and penalty rates remain key political issues. This is quite right, given the way that people are rewarded by corporations is a key determinant of income inequality.

No doubt the earnings of Australia Post’s top brass will fade from the headlines. What won’t fade so quickly is the way the gaps between the earning of those executives and rest of the Australian population keeps getting bigger.

This cannot be dismissed with facile arguments about the “politics of envy”. Instead, we need to take heed of research that clearly shows inequality is continuing to widen in Australia, and that this rising inequality is harmful to economic and social stability.

Author: Carl Rhodes, Professor of Organization Studies, University of Technology Sydne

Pension age rises will mean later super access

From The NewDaily.

The age at which you can receive the age pension is on the rise, up to 65.5 from July 1 and it could be as high as 70 within two decades.

There’s a big unanswered question related to that which the politicians don’t seem to want to touch; will that push up the superannuation preservation age?

The pension age will move to 67 by 2023 under a measure introduced by Labor back in 2009. The government has it slated to move to 70 by 2035 although PM Turnbull and Social Services minister Christian Porter side stepped the issue when Labor brought it up in parliament this week.

Labor, for the record, opposes the move and has done so since it was first introduced.

The measure was originally recommended to start in 2053 by the Abbott Government’s Audit Committee chaired by Tony Shepherd. But the Abbott budget in 2014 brought this back to 2035.

But even if the move to 70 were to come off the agenda in the medium term, there is still currently a mismatch between the age you can take super and the age you get the pension.

A few years ago you could take your super at 55. Now it’s 56 and it is moving  towards  60, a point it will reach for those born from mid 1964 in 2021.

Supernatants are getting older. Source: ATO

The point of raising the preservation age was to keep it within five years of the pension age. Allowing the gap to widen would “encourage people to take their super, spend it and live off the pension,” said Ian Yates, CEO of lobby group Council on the Ageing.

Robert Curley, a director of Association of Independent Retirees, said his organisation would support a move. “The super preservation age should be maintained at five years below the pension age.”

But some take a much harder line than this. Brendan Coates, a researcher with the Grattan Institute, told The New Daily that he “supports an increase in both the pension age and the super preservation age to 70.”

“It would help reduce the budget deficit and increase GDP quite significantly.”

Mr Coates said research done by Grattan in 2012 had shown that those two measures would “cut the budget deficit by $12 billion in today’s dollars and increase GDP by at least 2 per cent”.

The economic benefit would come from “pushing people to work for longer”, Mr Coates said. The budget benefits would come from lower pension payments and higher taxes on super savings.

Of course not everyone takes what many would see as such a hard line approach. Mr Curley said “if you take the preservation age to 67 or 70 it negates the idea of super”.

“There needs to be a reasonable period for people to access and enjoy their superannuation.” Keeping too big a gap between preservation and pension age would also negate the idea of super by encouraging people to spend it early, he said.

Mr Coates said any increase in both benchmarks would have to be done gradually and adequate arrangements put in place to allow older people who could no longer work to be get the disability pension (which pays the same as the age pension).

“Otherwise there would be be a risk that people who couldn’t work any more would be forced onto Newstart [unemployment benefits],” Mr Coates said.

A spokesman for Labor’s superannuation shadow minister
Katy Gallagher said the opposition “did not have a view” on raising the preservation age. Financial Services Minister Kelly O’Dwyer did not respond to questions on the issue from The New Daily.

Mr Yates said resources would have to be put in place to help older people transition to new roles and jobs that matched their capabilities if working lives were to be extended to 70.

“If people are working longer we can’t expect them to have the same career path from 25 to 70.”

Extending working lives is a big issue through the OECD. As the following chart shows, Australia currently sits around the average of its peers.

OECD retirement ages in 2014. Source: OECD

Canadian Prime Minister Justin Trudeau was elected on a platform of reversing a retirement age rise from 65 to 67. But recently an economic advisory committee recommended a rise and measures to encourage people to work beyond 70.

So Just How Sensitive Are Property Investors To Rising Interest Rates Now?

Having looked at changes in investment loan supply, and the motivations of the rising number portfolio property investors, today we use updated data from our rolling household surveys to look at how property investors are positioned should mortgage rates rise. In fact, for many, rates have already been raised, thanks to lender repricing independent of any RBA cash rate move, some as much as 65 basis points. We think there is more to come, as loan supply gets tighter, international financial markets tighten and competitive dynamics allows for hikes to cover capital costs and to bolster margins.

To assess the sensitivity we model households ability to service mortgage debt, taking into account their other outgoings, and rental income.  We are not here looking at default risk, but net cash flow. How high would rates rise before they were under pressure? Where they also have owner occupied loans, or other debts, we take this into account in our assessment.

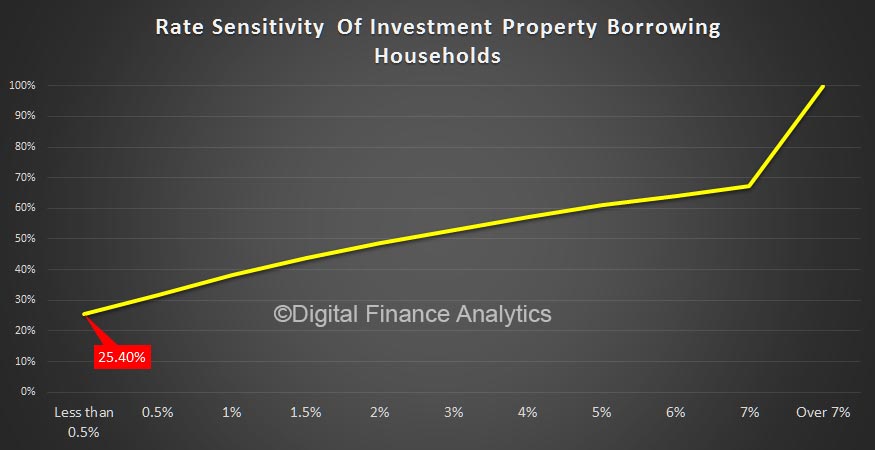
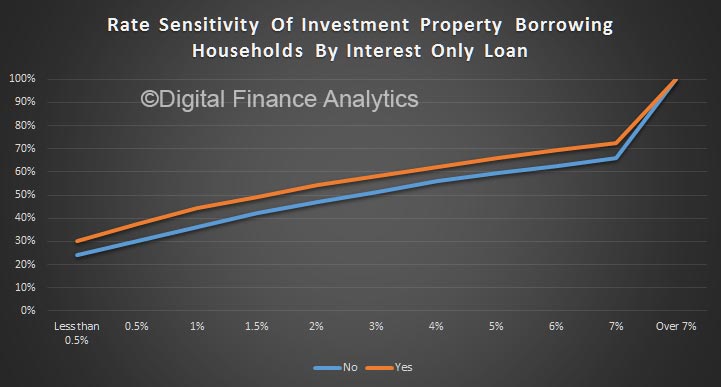
The first chart is a summary of all borrowing investor households. The horizontal scale is the amount by rates may rise, and for each scenario we make an assessment of the proportion of households impacted, on a cumulative basis. So as rates rise, more households would feel pain.

The summary shows that nationally around a quarter of households would struggle with a rate hike of up to 0.5%, and as rate rose higher, this rises to 50% with a 3% rate rise, though 40% could cope with even a rise of 7%.

So a varied picture. But it gets really interesting if you segment the analysis. Those who follow DFA will know we are a great believer in segmentation to gain insight!

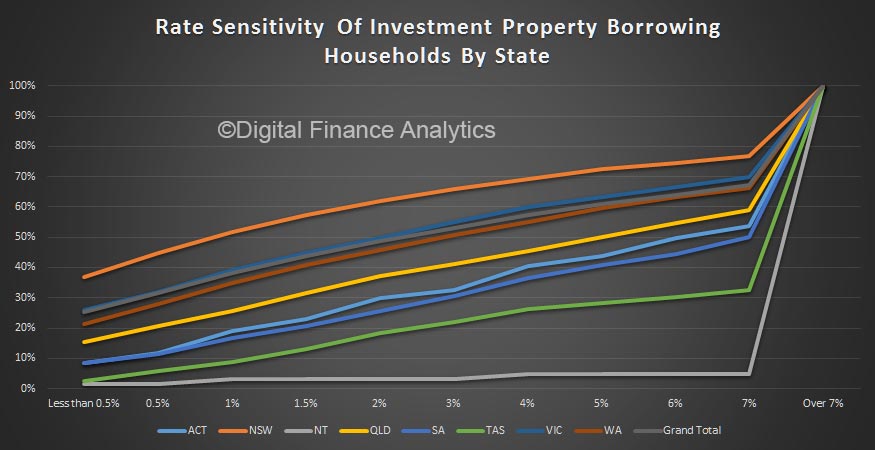
A state by state analysis shows that households in NSW are most exposed to a small rate rise, with 36% estimated to be under pressure from a 0.5% rise (explained by large mortgages and static rental yields), compared with 2% in TAS.

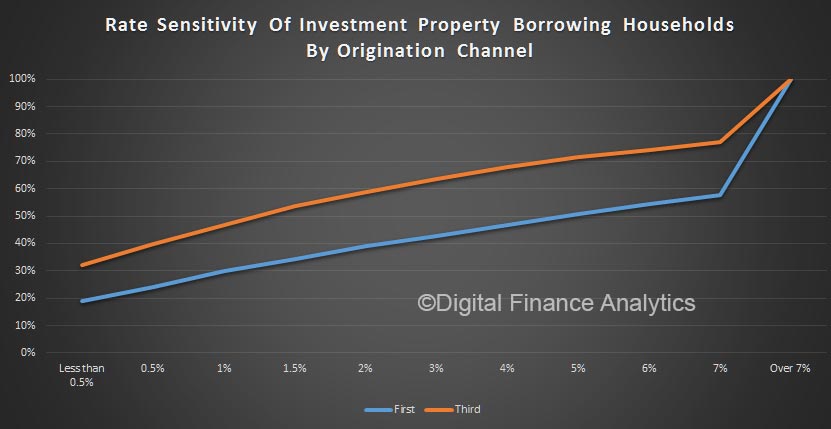
Origination channel makes a difference, with those who used a mortgage broker or advisor (third party) more exposed compared with those who when direct to a lender. The pattern is consistent across the rate rise bands.  This could be explained by brokers knowing where to go to get the bigger loans, or the type of households going to brokers.

Households with interest only loans are 6% more exposed to a small rise, and this gap remains across our scenarios. No surprise, as interest only loans are more sensitive to rate movements. We have not here considered the tighter lending criteria now in play for interest only lending.

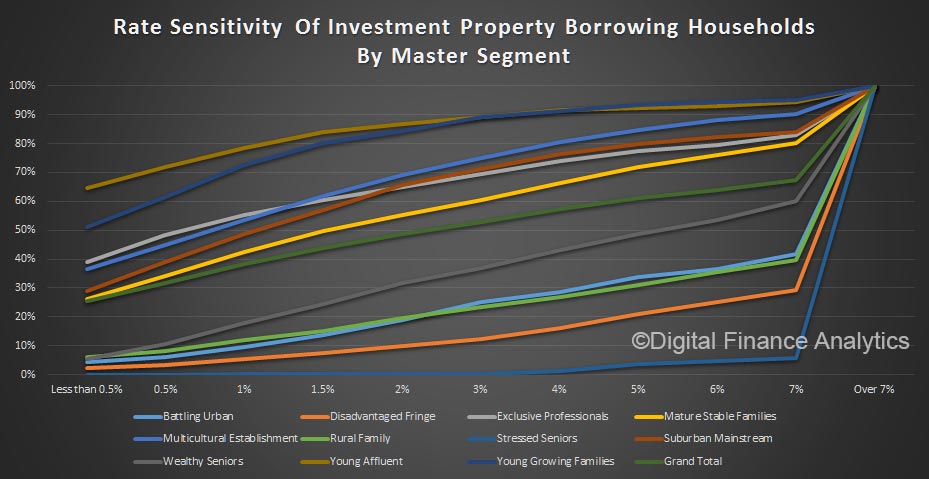
Our master segmentation reveals that it is Young Affluent and Young Growing Families who are most exposed, followed by Exclusive Professionals. Some of the more affluent are portfolio investors, so are more leveraged, despite larger incomes.

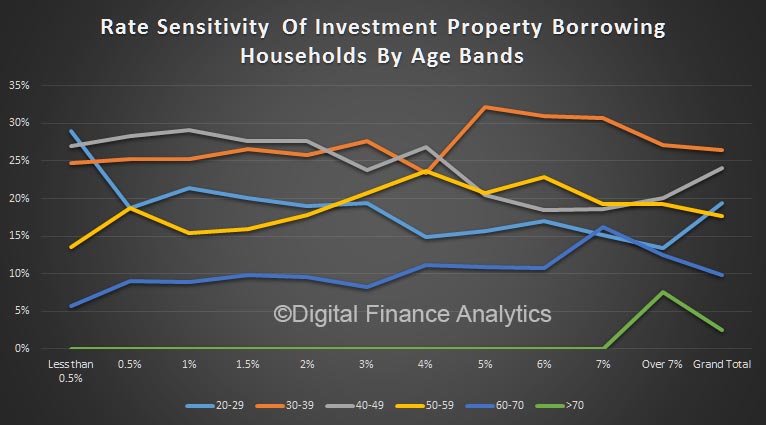
Finally, we can present the age band data, which shows that those aged 40-49 have the greatest exposure as rates rise, though young households are most sensitive to a small rise.  Note this does not reveal the relative number of investor across the age groups, just their relative sensitivity.

This all suggests that lenders need to get granular to understand the risks in the portfolio. Households need to have a strategy to prepare for rate rises and should not be fixated on the capital appreciation, at the expense of cash flow management, especially in a rising rate environment.

‘Speeding’ housing investors are pushing families too far

From The NewDaily.

Market watchers are expecting a bombshell to be dropped on the property market next week, with Commonwealth Bank reportedly about to close its doors to refinancing housing investors wishing to migrate from other banks.

Fairfax Media suggested this could send “shockwaves” through the property market – though whether it will cause a price correction is far from certain.

At present, the consensus view is that CBA is simply taking a breather from lending to investors so as not to breach the mortgage growth speed limit imposed by the regulator.

The Australian Prudential Regulatory Authority introduced the speed limit in late 2014, requiring banks to limit growth in their investment mortgage books to 10 per cent per annum.

But even if CBA does slam on the brakes on Monday, it won’t be nearly enough.

A broker’s view

One independent mortgage broker told The New Daily that the speed limit is a fairly weak measure for controlling the housing credit bubble because so many smaller lenders exist to pick up the overflow of demand from the big banks.

So an ANZ customer chasing a better deal at CBA may now find their broker raking up names they’ve never heard of.

AFG, for instance, offers what the broker calls a “white label” home loan built on funding from a number of other banks.

A confident investor should have no problem signing up with such a provider, although less savvy investors may baulk at moving away from the psychological safety of the big banks.

A second flaw

The net result of the speed limit is to slow lending to a degree, but it has likely helped smaller lenders take additional market share.

The latter is not a stated goal of the policy, and even the real goal – to reduce investor activity – really doesn’t go far enough.

To understand why, two factors need to be considered. The first is population growth and the second is inflation. Consumer price index inflation is currently running at 1.5 per cent per annum, and population growth is around 1.4 per cent.

Combining those two figures, the amount of money lent against the housing market would have to grow just under 3 per cent to stay ‘steady’ in relation to the rest of the economy.

In fact, although the value of mortgage debt in Australia has grown by an average of 8 per cent since the onset of the GFC, the last calendar year saw banks’ mortgage books grow by almost exactly the ‘steady’ amount – 2.9 per cent.

That’s partly due to lower volumes of homes changing hands, and partly due to a slow-down in house price growth.

Why 10 per cent is too much

What’s alarming about the 10 per cent speed limit, which CBA is apparently hitting and other banks are getting close to, is that it’s more than three times the ‘steady’ rate of growth.

That means the mortgage market continues to be rebalanced away from owner-occupiers and towards investors.

It is investors driving extraordinary price growth in Sydney – up more than 60 per cent since 2012 – and Melbourne, and it is first home buyers and young families being priced out of the market.

This has to change. One suggestion, from economist Leith van Onselen, is to halve the speed limit to 5 per cent. That would still see investment loans growing faster than the population and inflation, but it would at least be a start.

Let’s get the language right

It would also be useful if media commentators could start focusing on the younger, more vulnerable portion of the housing market rather than celebrating the windfall capital gains made by the older and wealthier portions.

To illustrate what I mean, I’ve prepared two charts from the same set of ABS numbers for Sydney – one with a happy upward slant, the other with a depressing downward slide.

The first, which many readers will be familiar with, shows the huge capital gains investors have made in the past few years –expressed as the house price to income ratio.

The second looks at this period of financial exuberance from the first home buyer’s perspective where the question is not “how many incomes is my asset worth?” but rather “how much of the asset is my income worth?”

From that perspective, the appropriate headline is not ‘House prices boom in Sydney’ or ‘Investor returns at record levels’ – it is ‘Purchasing power of wages plummets’ or ‘Housing affordability tumbles’.

The Deadly Embrace Of Housing

The latest RBA Chart pack, out today, with data to early February 2017 really highlights the critical role housing plays in household finances. If the home price growth music were to stop, things would get tricky.

Overall net wealth continues to lift, supported by rising dwelling prices, (and fully priced financial assets).

Everyone seems to benefit from high home prices.

Investment loan flow is now as large as owner occupied flow, as investors continue to bet on housing for future growth, in a low interest rate environment.

House prices continue to rise following slower growth earlier in the year.

Household debt continues to grow, whilst ultra-low interest rates make interest repayments manageable – though of course there are mortgage rate rises in the works.


Do Investment Property Investors Also Use SMSF’s?

We recently featured our analysis of Portfolio Property Investors, using data from our household surveys. We were subsequently asked whether we could cross correlate property investors and SMSF using our survey data. So today we discuss the relationship between property investors and SMSF.  We were particularly interest in those who hold investment property OUTSIDE a SMSF.

To do this we ran a primary filter across our data to identity households who where property investors, and then looked at what proportion of these property investors also ran a SMSF. We thought this would be interesting, because both investment mechanisms are tax efficient investment options.  Do households use both? If so, which ones?

We found on average, around 13% of property investors also have a self managed super fund (SMSF). Households in the ACT were most likely to be running both systems (17%), followed by NSW (14%) and VIC (12.8%).

Older households working full time were more likely to have both an SMSF and Investment Property, but we also noted a small number of younger households were also using both tax shelters.

We found a significant correlation between income bands and use of SMSF among investment property holders (this does not tell you about the relative number of households across the income bands, just their relative mix). Up to 30% of higher income banded households have both a SMSF and Investment Property.

Finally, we look across our master household segments. These segments are the most powerful way to understand how different household groups are behaving.  The most affluent groups tend to hold both investment property and SMSF – for example, 30% of the Exclusive Professional segment has both.  Less affluent households were much less likely to run a a SMSF.

This shows that more affluent households are more able and willing to use both investment tax shelter structures. It also shows that any review of the use of negative gearing, investment properties and the like, needs to be looked at in the context of overall tax planning. Given the new limits on superannuation withdrawals, we expect to see a further rotation towards investment property, which as we already explained has a remarkable array of tax breaks and incentives. We expect the number of Portfolio Property Investors to continue to rise whilst the current generous settings exist.