NSW and VIC Population Increased The Most

CoreLogic’s latest – population growth slows nationally but New South Wales and Victoria attract a record high proportion of the population increase.

Demographic data for the December 2015 quarter was released by the Australian Bureau of Statistics yesterday.

Chart 1

At the end of 2015, the national population was estimated to be 23,940,278 persons having increased by 1.4% or 326,073 persons over the year.  Although the population continues to increase at a fairly rapid pace, the rate of population growth has been trending lower since it peaked at 2.2% over the year to December 2008.

Chart 2

Nationally, population growth is driven by two factors: migration and natural increase (births minus deaths).  Over the 12 months to December 2015, the national population increased by 148,935 persons due to natural increase and by 177,138 persons due to net overseas migration.  Net overseas migration has increased a little over the quarter but has fallen dramatically since it peaked at 315,687 persons over the 12 months to December 2008.  Natural increase is -1.0% lower over the year while net overseas migration is -0.5% lower.

Chart 3

Looking at state population data, New South Wales and Victoria have recorded the greatest increases in population over the past year, up by 106,116 and 109,830 persons respectively.  Across the other states and territories the annual population increases have been recorded at: 59,714 persons in Queensland, 11,180 persons in South Australia, 30,980 persons in Western Australia, 2,110 in Tasmania, 840 persons in Northern Territory and 5,271 persons in the Australian Capital Territory.  The above chart shows the rate of population growth over the year and it shows that not only has Victoria seen the greatest increase in population over the year it also has the fastest rate of growth of all states and territories.

Chart 4

Over the past year, Victoria has accounted for 33.7% of the total increase in the national population (more than a third) which is a record-high for that state.  Elsewhere, South Australia accounted for 3.4% of national population growth (lowest since March 2002) and Western Australia accounted for 9.5% of population growth (lowest since December 2002).  The above chart highlights that historically either New South Wales or Queensland has typically accounted for the highest proportion of population increases.  Since the financial crisis, New South Wales and Victoria have accounted for increasing proportions of national population growth due to their stronger economies and the subsequent lure of job opportunities in Sydney and Melbourne.

At the state level there are two components of migration; net overseas migration and net interstate migration.  It is important to look at how the trends across each category of migration impact on population growth in each state.

Chart 5

Throughout 2015 almost three quarters of net overseas migration occurred in either New South Wales (38.6%) or Victoria (34.2%).  The chart shows that annual net overseas migration to New South Wales and Victoria is continuing to rise (albeit at a moderate pace) but is falling elsewhere.  The 34.2% of national new overseas migration for Victoria over the year was a record-high.  Queensland accounted for just 11.0% of net overseas migration over the year, its lowest share since March 1991 and well below the 20.1% of national net overseas migration the state attracted in March 2009.  Western Australian net overseas migration accounted for just 8.2% of national net overseas migration, a far cry from its recent peak of 23.9% in September 2012.  As the mining boom has faded and the New South Wales and Victorian economies have strengthened over recent years, more migrants have been choosing to settle in these two states and fewer are settling in Queensland and Western Australia.

Chart 6

Victoria and Queensland are the only two states that have recorded positive net interstate migration over the 2015 calendar year with net interstate migration cancelling itself out at a national level.  Over the year, net interstate migration was recorded at +13,049 persons in Victoria, which is an historic high.  In Queensland, following a long decline in net interstate migration, the number of migrants crossing to border into Queensland has started to turn, recorded at +8,326 over the past year its highest level since March 2013.  Across the other states and territories, the losses from net interstate migration have been recorded at: -8,749 in New South Wales, -4,967 in South Australia, -4,313 in Western Australia, -79 in Tasmania, -2,732 in Northern Territory and -535 in Australian Capital Territory.  The net outflow in New South Wales is the largest since March 2014, South Australia’s outflow is the greatest since September 1996 and Western Australia’s outflow is the greatest on record.  Tasmania’s net outflow is the lowest since June 2011, the Northern Territory’s is the lowest since December 2013 as is the Australian Capital Territory’s.

Although population growth is continuing to trend lower, it is becoming more evident that growth is much greater in the states with stronger economies (NSW and Vic).  It is clear that the economic strength of a state is key to attracting more residents not just domestically but also internationally.  It also looks that as housing becomes increasingly unaffordable in the two capital cities of NSW and Vic, interstate migration into Queensland (the third largest state) is beginning to pick-up again.  I would suggest this is being driven by an improving employment market accompanied by a much more affordable housing market.

The more up-to-date overseas arrivals and departures data indicates that net overseas migration is likely to continue to slow over the coming quarters.

Australians’ growing property debt in retirement calls for super planning

Data from ING DIRECT reveals that Australians are increasingly taking property debt into their retirement years, with the number of over 65 year olds still holding a mortgage rising by 28 per cent in the past three years. This finding aligns with data from our own surveys, as shown in this data extract from DFA analysis of owner occupied loans held by those over 50.

Old-Mortgages

Of those in their retirement years that still have a mortgage, 26 per cent hold an investor loan while 74 per cent are owner occupiers. The average debt they are holding is $158,000.

Mark Woolnough, Head of Third Party Distribution at ING DIRECT commented: “As property prices climb and people wait longer to get onto the property ladder, it’s not a surprise that people are holding their home loan debt later in life.  However, proper planning is critical to make sure that this debt doesn’t cause stress in later years and people can enjoy the retirement they have worked hard for.”

According to ING DIRECT’s Autumn Buyers Guide, since June 2012 the average capital city residential property has increased in value by 32 per cent, with growth of 7.6 per cent in the past 12 months alone. The average age of a home buyer has also risen in recent years to 38.

Mr Woolnough added:  “We talk about superannuation and property as the barbells of a person’s financial lifecycle – in most cases they are the two biggest investments that a person will ever make.

“Research has shown us that people are very open to discussing broader financial needs when they are sourcing a mortgage, such as their superannuation, and brokers are in a great position to encourage and support their clients to consider and sort their super in light of this growing property debt trend.”

The analysis is based on ING DIRECT’s own customer base. ‘Retirement years’ considers those customers aged between 65 and 79.

What’s the key to home ownership for Gen Y?

From The Conversation.

Over the last 25 years, home ownership rates have fallen sharply for young Australians. Between 1982 and 2011, the home ownership rate for young adults aged 25 to 34 years dropped from 56% to 34%. Growing concerns about their home ownership prospects have prompted those in Generation Y (defined as 18-35 years for the purposes of this article) to become increasingly vocal about the difficulties of achieving home ownership.

This article draws on survey data from more than 4,300 respondents collected as part of the Bankwest Curtin Economics Centre Housing Affordability Report 2016. These findings highlight the housing affordability concerns of Generation Y.

The vast majority (86%) of Gen Y households living in the private rental sector or with their parents aspire to own a home, although not necessarily in the short term. Of these households, 30% believed they would be able to buy a home in the next two to five years. One-quarter believed home ownership was five to ten years away. Only 6% did not believe they would ever be able to buy a home.

Although many are choosing to delay home ownership as a lifestyle choice, others are forced to delay because of a lack of affordable housing options. Across all age groups, home owners were more likely to perceive their housing as affordable.

The survey reported that those living in unaffordable housing were making significant sacrifices to meet their housing costs. And 55% said sustaining high housing costs was leading to mental health issues, with those most affected in the private rental sector. This highlights the importance of affordable housing.

The ‘bank of mum and dad’

The deposit gap is the biggest barrier to home ownership. The survey calculated the average gap between the deposit currently available to an individual and the amount the individual expected to need for home purchase. This gap was around A$50,000.

Among Gen Ys already in home ownership, 38% reported they had received financial assistance from their parents or grandparents. For those yet to enter home ownership, only 17% expected to receive some assistance to buy. A further 24% indicated help might be offered.

Therefore, almost 60% of Gen Ys surveyed are unlikely to receive the benefit of intergenerational assistance. This may prevent them from ever entering home ownership.

Parental assistance to purchase

Housing opportunities for ‘Generation Rent’

Assistance for home purchase is becoming more and more important for Gen Ys. They are being dubbed “Generation Rent” as the Great Australian Dream of home ownership moves further out of their reach.

Among Gen Y survey respondents, three-quarters rated the First Home Owner Grant and stamp duty relief as being important in helping them into home ownership. Even the scrapped first home saver accounts scheme was viewed as important. The generation is becoming increasingly reliant on these volatile demand-side incentives.

Importance of government assistance

So what can be done to help those who wish to enter home ownership but lack financial support? Government-backed low-deposit loans such as Keystart in Western Australia and Homestart in South Australia, which are designed for those on low to moderate incomes, have made a real difference to thousands of households. Although not without risk to government, these type of loans could be introduced in other states.

Shared ownership products enable the purchaser and a third party to share ownership of the dwelling, which reduces deposit requirements and monthly payments. These are successful in the UK, accounting for 18% of total housing stock, and are growing in popularity in Australia under the schemes noted above. There may be scope for community housing providers to step into this sector in partnership with private developers.

Discounted home ownership is another option. This option could be tied to developer contributions as part of inclusionary zoning requirements. However, it must be structured in a way that ensures any discount on the market price is retained in perpetuity.

The National Rental Affordability Scheme had its critics but at least provided a supply of affordable housing that reduced the rental burden for many households. That, in turn, increased their chances of saving for a deposit.

The rental sector is in dire need of a replacement scheme, which could possibly be enhanced using a model whereby investors offering new rental dwellings below market rents for a defined period are eligible for stamp duty relief. The argument will be raised that this will encourage demand from investors, raising prices.

Ultimately, the only long-term solution to improve the home ownership prospects of young Australians is to change the imbalance between incomes and house prices.

It is more critical than ever for government to implement meaningful structural reforms that improve home purchase affordability for Generation Y. Otherwise, growing numbers of Gen Ys all over Australia face a lifetime of renting without the financial and emotional security of home ownership.

Authors: Director, Australian Housing and Urban Research Institute, Curtin Research Centre, Curtin University;Senior Research Officer, Curtin Business School, Curtin University;Deputy Director, Bankwest Curtin Economics Centre, Curtin University


Australian Household Credit Card Debt Profiling

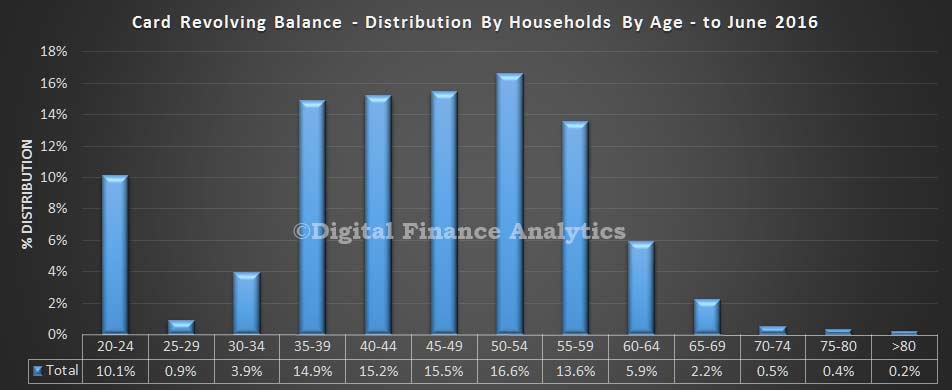
Following the US card data analysis we reported this morning, we have been looking at the situation among Australian households by using data from our household surveys. We extracted the average revolving balance data from our surveys, and mapped this first to household age bands. We find that the largest proportion of debt are found in households aged 50-54, and more generally, older households have more debt, similar to the US findings. The spike in the 20-24 age bands is explained by young households yet to own a property, and often living with parents, or in shared accommodation, with larger spending appetites.

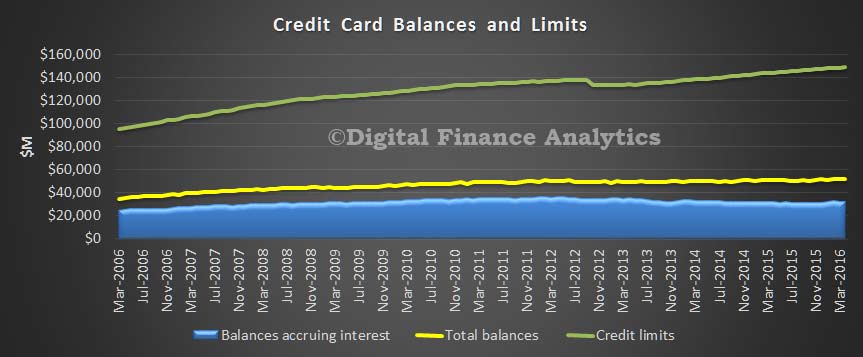
CC-Bals-Age-RangesData from the RBA also shows that nationally, whilst credit limits have steadily increased, the total balances accruing interest have not.

CC-Bals-We also looked at households by our master segments, and found that most debt sits with our suburban households. These are relatively stable households, but not the most affluent. Stressed households, relatively, hold lower debt balances.

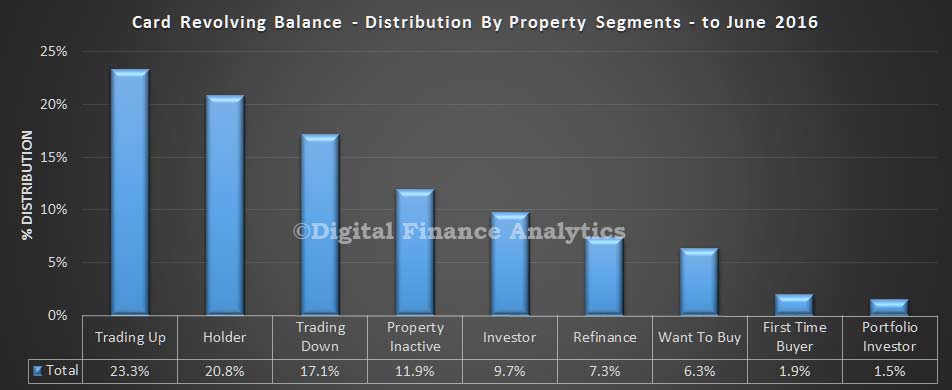
CC-Bals-Segs-RangesThis is confirmed by looking at households by our property segmentation. The highest debt distribution is found in households looking to trade up, hold property, or trade down. These groups have significant assets behind them. Other groups, including first time buyers have lower debt balances.

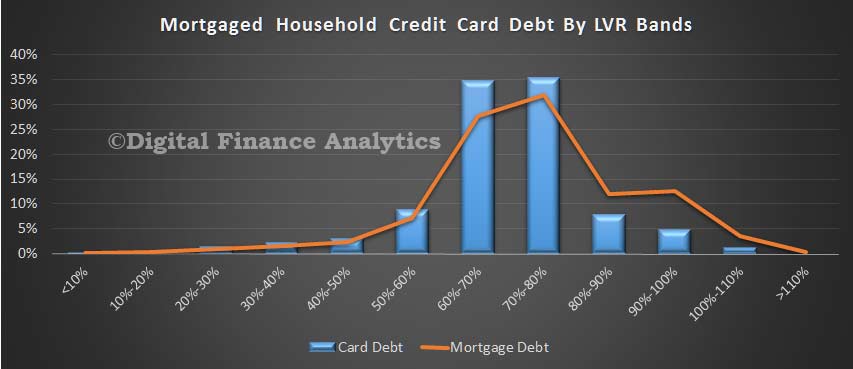
CC-Bals-PtySegs-RangesIn our final piece of analysis, we looked are credit card debt distribution by the loan to value of those with mortgages. We found the largest debt levels reside in LVR bands between 60-80%, where the same is true of mortgage balances. So, we can see a correlation between LVR bands and credit card revolving debt.

CC-Bals-MortgAge-RangesSo, overall we conclude that older households, especially with a mortgage hold the highest card balances, and that card lending is intrinsically connected with home lending.


The Wealth Gap Widens

From Business Insider.

Australia has always lauded its working class culture, and the subsequent rise of the middle class, but the very nature of society is changing dramatically. In fact, we’re currently experiencing the biggest gap in wealth the country has ever seen.

New research by social researchers McCrindle, based on the latest analysis of the Australian Bureau of Statistics wealth and income data, breaks down the annual household income by quintiles of two million of Australia’s 10 million households. While the average household earns just over $107,000 annually, the top 20% earns more than twice that amount while the bottom 20% take home around one-fifth of the average at just . In other words, the wealth of the highest quintile households on average is 71 times that of the lowest quintile households.

Using the Gini coefficient measure of income spread — with 0 being perfect equality and 1 being total inequality — Australia is facing the most unequal level ever seen, at 0.446 compared to 0.417 in the mid 1990s. In the 20 years since, average household gross incomes have increased 60% from $66,196 to $107,276 today, while over the same period, incomes of the highest quintile have increased by 74% from $149,552 to $260,104. The details are below.

Infographic: McCrindle.

Mortgage Stress Falls As Rates Are Cut

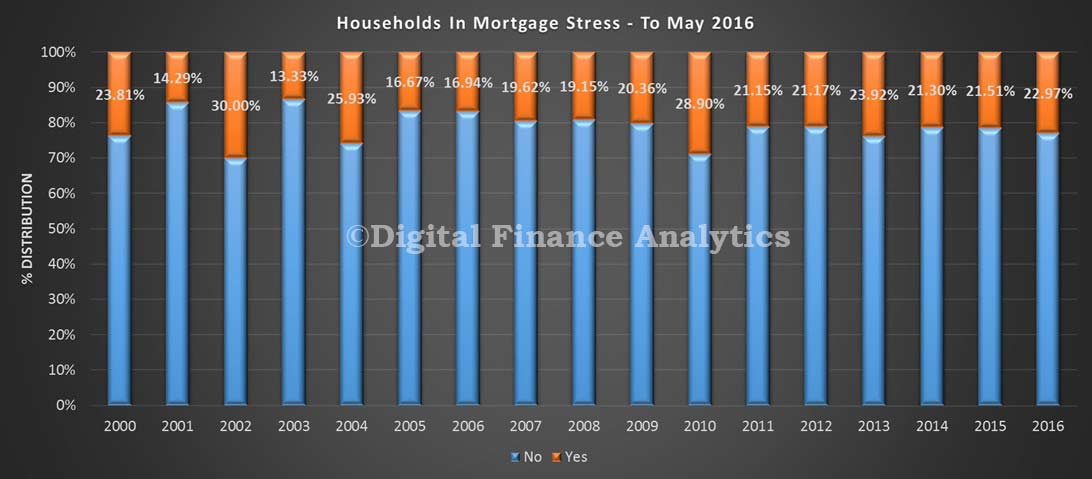
We have run our mortgage stress models, using data from our latest household surveys. At the moment, 21.73% of households are in difficulty (a fall thanks to lower rates from last years), though some locations and segments are above 30%. You can read about how we calculate mortgage stress in the Anatomy of Mortgage Stress.

Households in stress are having to cut back spending, are likely to be putting more on credit cards, will have refinanced to reduce payments, may be in arrears, or are taking to a broker about refinancing.  The stress model has been updated with the latest survey data, and recent mortgage repricing. This covers owner occupied loans only. In our experience, stressed households, in a flat income environment do not recover, and grind on into greater difficulty later – also of course they are very exposed should rates rise.

Our first chart shows the proportion of households in stress by age of loan. (Of course most loans are just a few years old, so there are more households in recent years. We still see the impact of high first time buyer volumes in 2010 flowing though to higher stress levels, still.

Stress-June-2016-By-Loan-Age

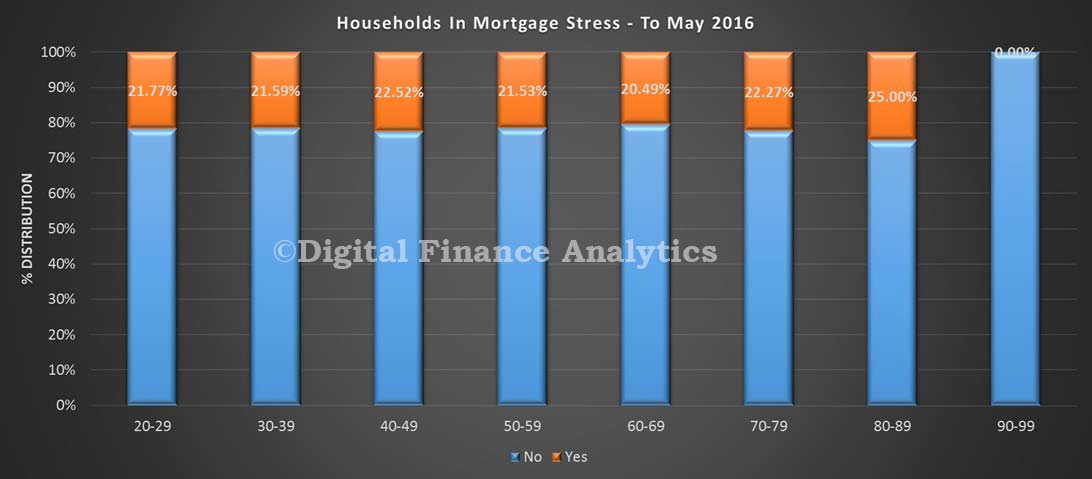
Stress is not just the domain of the young. In fact proportionally, older households with loans are more likely to be stressed – though the numbers with a mortgage are much lower – this is because incomes are squeezed, and households have outstanding mortgages for longer.

Stress-Aged-June-2016

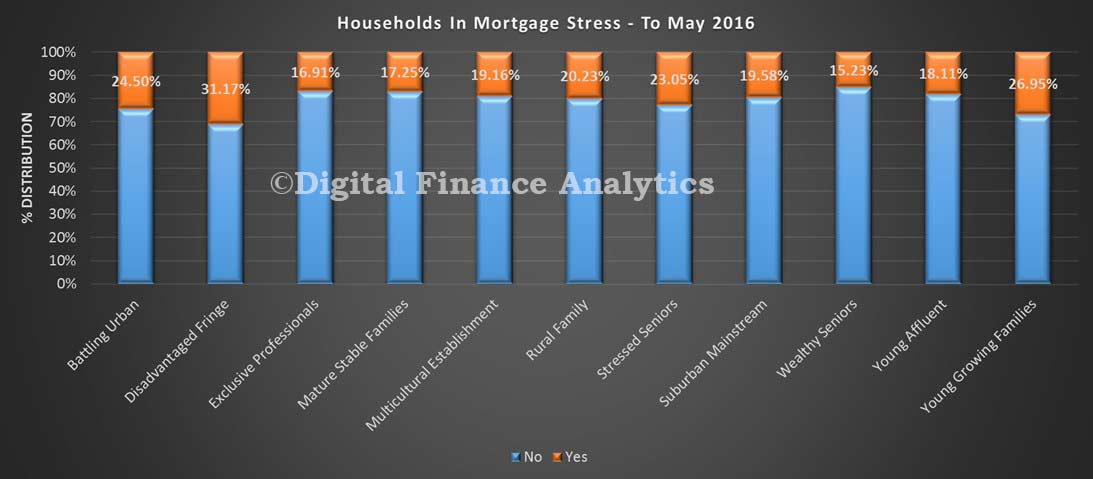
Our master household segmentation shows that younger families, and disadvantaged households are more likely to be in stress. The affluent are least impacted.

Segment-Stress-Data-June-2016

Finally, we have a view by state and region. There are considerable differences across the states and by location. Again, this does not show the relative count by area, but remember half of all loans reside in NSW and VIC.

Stress-Regions-June-2016Overall we conclude that the cash rate cuts and deep discounts on refinanced loans have eased the pain for many households, despite static incomes. This chimes with recent improved household finance confidence levels.

Provided rates stay low, or go lower, stress levels will remain contained provided employment rates do not rise. Of course the real killer would be interest rate rises. But we are now not expecting lifts in rates anytime soon.

Why an apartment bust could prove calamitous

From The New Daily.

Go into the city at night and turn your eyes upward. The dark eyes of city apartment towers stare back. Night after night, it’s the same – some windows never brighten. Nobody is there to flick the light switch because the apartments are empty. Water usage statistics confirm it – 7 per cent of apartments in certain high-density city areas lie vacant according to one estimate.

It is not clear exactly how many vacant properties are the possession of overseas investors keen to park money in a safe place, but anecdotal evidence suggests they are a big contributor to the phenomenon. Vacant apartments are a danger to us all. They are like little pockets of combustible material that could turn a bit of smouldering at the edges of the apartment market into a consuming fire that damages the whole housing market and the whole economy.

Empty vessels make the most sound

An apartment left vacant is a particular kind of investment. One where the investor doesn’t need cash flow, but wants to grow – or at least maintain – their capital investment. It is selected because it seems safe. So far, that assumption has been a good one. Apartment prices have risen alongside Australia’s house prices.

house and apartment pricesBut if apartment prices fall, people who invested in vacant apartments will have reason to second-guess. Why, they may ask, am I keeping my money in a losing bet? Vacant apartments are easy to put on the market – you don’t need to move, or even evict tenants. You just call your real estate agent. If the apartment market were ever to fall, vacant apartments could accelerate that movement.

But why would they even?

There is a good argument Australia needs apartments. We are quarter-acre obsessed even as our cities grow too large to adequately function. For a long time we were building too few. Hence the steady price rises that have only been exacerbated by interest rates at very low levels. But the rise in prices has inspired developers to go crazy. These next charts shows approvals in Sydney and Brisbane. The change in the preferred type is obvious and severe.
qld houses vs appartmentsnsw houses and apartmentsIs it possible we might not just catch up with demand for apartments, but exceed it? One might want to hope the discipline of a free market would ensure the apartment market doesn’t wobble. Bad news – even the head of the RBA Financial Stability Department, Lucy Ellis, thinks otherwise.

“Just as there’s a Greater Fool Theory of investment that helps perpetuate booms in prices of financial assets, it sometimes seems that there is a Slower Builder Theory of property development, where everyone knows that not all the projects underway will make money but yours will if you can just complete it before the other guys complete theirs.”

Many builders rushing their buildings to completion would only exacerbate any price fall. In bad news for developers still in the hard-hat stage, there are hints apartments may already be more numerous than the market can stomach. According to reports in the financial press, some apartments bought off the plan in Melbourne are selling for hundreds of thousands of dollars less than they were bought for, while owners are raising sales commissions to help clear excess stock in other towers.

RBA Governor Glenn Stevens made explicit mention of apartments last time the central bank cut rates, suggesting the bank doubted overall dwelling prices would rise much longer because “considerable supply of apartments is scheduled to come on stream over the next couple of years”.

The number of units under construction is startling.
units under constructionSafe as houses …

Don’t think house owners can just watch apartment prices fall and not get singed. The two markets are linked and an apartment glut can lead to a house price fall. This might be what the OECD was talking about when it said: “The unwinding of housing-market tensions to date may presage dramatic and destabilising developments.” But if a destabilising house price wreck happens we shouldn’t look up at those unoccupied apartments and blame their owners. We should blame ourselves for letting it happen.

Jason Murphy is an economist and journalist who has worked at Federal Treasury and the Australian Financial Review. His Twitter handle is @jasemurphy and he blogs about economics at Thomas The Think Engine.

Our cities will stop working without a decent national housing policy

From The Conversation.

We have to move the housing conversation beyond a game of political football about negative-gearing winners and losers. Australia needs a bipartisan, long-term, housing policy. Why? Because we have a slow-burn, deepening crisis that is affecting Australians who are already highly vulnerable and disadvantaged. They include:

The UN Rapporteur on Human Rights, following a visit in 2007, concluded that Australia was failing to deliver the fundamental human right of adequate housing because of the lack of any co-ordinated national strategy. Nothing has changed since 2007.

A failure to join the dots of housing policy

Our cities will stop working if we do not do something. A decent long-term housing policy is not just about the million or so Australians who are in housing need, marginal housing or homeless. In reality, housing demand and supply for all tenures is intricately connected.

Failed first-time buyers rent privately, increasing demand and rent levels. This pushes lower-income families towards social housing waiting lists and, at the end of the queue, those on marginal incomes are more likely to experience homelessness. Investors push out would-be home buyers by leveraging generous tax breaks that are not available to renters who are saving up to buy.

Rental affordability is worsening, including for key workers in our cities. First-time buyers are having difficulty entering an overheated market. We face the prospect of a permanent “generation rent”.

Changes in the value of new lending, 2008-2016

Changes in the value of new lending to investors, first-home buyers and subsequent buyers from December 2008 to March 2016. CoreLogic, ABS

More than 40% of people in private rental pay more than 30% of their income for housing – and this is after taking into account Commonwealth Rent Assistance. The 30% threshold is generally recognised as the level at which financial stress is experienced.

While states and territories have a wealth of experience and a clear role in delivery, the fact is the Commonwealth government must take a leadership role in co-ordinating national housing policy and connected programs across the four sectors of our housing system: home ownership; affordable private rental; social housing; and specific housing for Aboriginal, disability and homelessness needs.

It can be done; it has been done before. In 1945, Australia also faced a housing crisis. Despite skills and materials shortages and the financial difficulties of the post-war economy, the Commonwealth built 670,000 homes in ten years.

Decent housing underpins jobs, growth and productivity. Well-located, affordable housing is critical for preventative health, to provide a stable home environment for education and self-confidence, and for a productive workforce.

We need a national program of home building to meet the shortfall in all forms of housing. While this will not in itself resolve all problems, it is critical to a successful housing policy.

How much will it cost and where’s the money?

This is the subject of a new research report, Towards a National Housing Strategy, by Compass Housing working with a group of peak bodies, housing academics and community housing providers.

The Ache for Home report lays out a plan for a $10 billion social and affordable housing fund. St Vincent de Paul

To get the long-term benefits of decent housing, we must recognise that providing this has an up-front cost and we are in a tight fiscal environment. The Ache for Home Report estimates a A$10 billion housing bond could meet the needs of the 100,000 currently homeless people. Across all tenures, Australia could build 500,000 homes in ten years for an annual investment of $12.5 billion.

Even if the Commonwealth government took full responsibility for funding a national building program of such scale, the annual investment would equate to less than one-fifth of the current annual cost of capital gains (CGT) exemption on the main residence. The bonus of investment on such a scale could be the boost to the wider economy in which each $1 spent on construction created a $1.30 gain.

A national housing strategy would need to do two key things to raise the cash needed:

  • rebalance current tax settings to redirect money to where it is most needed; and
  • revise fiscal settings to attract more private capital into housing.

Innovative financial models have been developed internationally that can bring private finance to the table. The development of an arm’s length, government-funded financial intermediary to provide loan guarantees within a housing bond approach is one model with merit. It is used in the UK, the US and Europe.

Rebalancing subsidy arrangements across housing sectors means ring-fencing current housing support and redirecting it across the housing system. Reforms of capital gains tax exemptions and discounts, as well as negative-gearing concessions, are contentious, but are levers to improve housing supply.

CGT exemptions for the main residence cost taxpayers $54 billion in 2014-15. Nearly 90% of the benefit went to the top 50% of earners. And the costs are increasing. The CGT discount of 50% on capital gains, including investment properties, will cost $121 billion by 2018-19.

Negative gearing amounts to an average saving of $2,900 per year for the 1.2 million who claim. However, its impact on the budget means it costs the remaining Australians $310 per year each in tax that they would not otherwise need to pay.

Across these subsidies alone, a modest redirection would provide for a significant start-up fund for affordable housing, to be leveraged with private investment funds.

A national bipartisan approach would allow an independent review of all subsidies and recommend rebalancing options. It could also ease financial stress in the private rental sector by examining the current caps and levels of Commonwealth Rent Assistance to improve prospects for the many families where renting is a lifetime housing solution.

Without a national, integrated approach to housing, Australia will by default continue the mistakes associated with seeing the four sectors of the housing continuum as discrete and conditioned by different factors.

Authors: Ralph Horn, Deputy Pro Vice Chancellor, Research & Innovation; Director of UNGC Cities Programme; Professor, RMIT University;  David Adamson, Emeritus Professor: Social and Community Policy, The University of South Wales


More Mining Jobs To Go In The West

Research by National Australia Bank indicates that Australia is about half way though the fall in mining investment. They estimate that 46,000 mining related jobs have already been lost since 2012 and another 50,000 will go as mining-related activity rotates from construction to operations, where a smaller work force is needed.

The note says that the bulk of the fall will likely occur in WA, because of the state’s lack of employment diversity, though some will also be cut in QLD. Jobs in other industries will take up some of the slack, but the net reduction in employment is expected to be quite stark.

We expect some households to come under more intense financial pressure as a result, with an impact of home values and higher mortgage default rates, especially in some regional centres in WA and QLD.

Sydney’s wild weather shows home-owners are increasingly at risk

Last week we highlighted the timely new report from the Climate Institute, which warned of the consequences of more violent weather on property for owners and their bankers. Just five days before the super storm hit!

From The Conversation.

Eastern Australia’s wild weather has left coastal homes teetering on the brink of collapse, and has eroded beaches by up to 50m in parts of Sydney.

Now the attention turns to the clean-up. There are several legal issues for owners of damaged properties, particularly the question of if and how they can be compensated.

While the recent events cannot be attributed directly to climate change, they are certainly consistent with a warming world. Our institutions are ill-prepared for a potential increase in the frequency and severity of such events.

Insurance

Unfortunately, the success of insurance claims for damaged homes in Sydney will depend entirely on the terms of their policies. Some policies don’t cover erosion at all. Some policies only cover it if it occurs within a certain proximity of another insured event (for example, within 48 hours of a named storm event). Some policies also comprehensively exclude coverage for damage caused by actions of the sea.

What’s more, while insurance will cover damage to buildings, policies do not extend to cover damage to or loss of land. This is especially problematic in the case of damage caused by waves and storms, because erosion will often result in loss of land.

Under the traditional law doctrine, where land is lost to erosion, the Crown automatically gains title to the inundated land, without any obligation to pay compensation. So even if a home-owner is insured, they may find themselves with no land to rebuild on.

Legal proceedings

Another potential avenue for home-owners to pursue is proceedings against the relevant local government for negligent approval of development. The success of this type of proceeding is highly speculative – much will hinge upon when the development was approved and how much information on the coastal hazards was available at that time.

Where development was approved decades ago, it may be difficult to prove that a local government was negligent, because of the limited state of knowledge at the time. In the case of more recent development approvals, there may be an argument that a local government had a high level of knowledge of the risk and control of risk information. These are the type of factors a court will look at in assessing negligence.

On the flip side, a court may also find that a landholder knew of and accepted the risk. Negligence proceedings are by no means a guaranteed avenue for landholders to recoup their loss, but are an avenue that Collaroy landholders may be able to explore.

Disaster assistance

Where insurance is not available, and there are no strict legal rights against government, landholders may request disaster relief or assistance from government.

Despite the lack of any legal compulsion to do so, Australian governments have a long history of providing disaster relief to citizens when an extreme weather event causes property damage.

A recent Productivity Commission report estimated that, over the past decade, the federal government spent A$8 billion on post-disaster relief and recovery. State governments spent a further A$5.6 billion.

However, the availability and amount of a payment are not guaranteed. This may depend upon the number of other claims for assistance, and any other demands on government resources. A claim for disaster relief from government may be an option for Collaroy landholders, but many other home-owners are also affected by flooding due to the recent extreme weather – and so potentially there are many other requests for relief.

What should we learn from this event for the future?

While the pictures of houses being lost to the sea in Collaroy are confronting, these images may become more commonplace. The most recent scientific report from the Intergovernmental Panel on Climate Change suggests that, under a business-as-usual scenario, a global sea-level rise in the range of 0.53-0.97m by 2100 is likely.

Even if emissions are immediately reduced, a global sea-level rise of 0.28-0.60m by 2100 is still possible. This will be especially problematic in Australia, with an estimated 711,000 residential addresses located within 3km of the shore and less than 6m above sea level – not to mention the billions of dollars’ worth of government infrastructure also located in these regions.

As sea levels rise, some properties may be permanently inundated. Others may be hit by storm surge impacts or erosion, which may be exacerbated by sea-level rise.

If these events continue to attract disaster relief, the financial burden will become too great for governments to bear. Furthermore, government disaster assistance does not solve the more intractable problem of land being lost to the sea.

The pictures from Collaroy should therefore prompt a discussion about how we, as a society, can deal with the potential impacts of coastal hazards on existing developments.

This is a challenging question to answer, but there is an opportunity to address it in a planned and co-ordinated fashion.

Author: Justine Bell-James, Lecturer in Law, The University of Queensland