The final Senate report into Affordable Housing was released today. The report is more than 450 pages long (including appendices), and the 40 recommendations cover a wide range of issues, including coordination and management across states and territories; developing a long term national plan; phasing out stamp duty; new funding options; urban planning; land supply; use of pre-fabs; tax reform of negative gearing; first buyer grants and saving schemes; shared equity programmes; downsizing; tenancy laws; social housing; housing for victims of domestic violence; reinvigorating the National Affordability Housing Agreement; and housing supply. The report recognises housing affordability is a many-faceted issue, and the recommendations are comprehensive and sensible. Is there the political will to embrace such complex transformation?
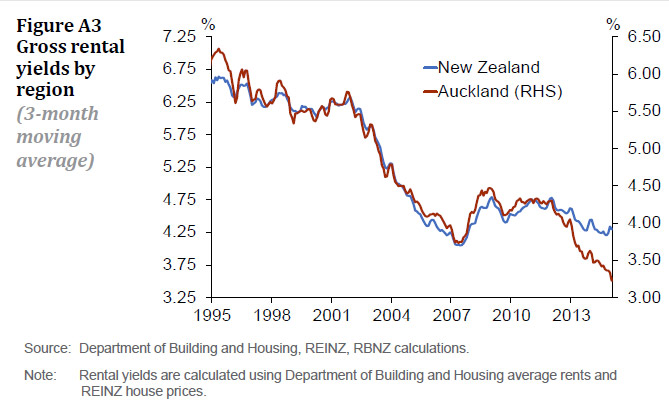
We note the committees comments on macroprudential: “the committee would have serious reservations about the use of any overly blunt macroprudential regulations, including the use of LTV ratios such as these recently deployed in New Zealand. Throughout the inquiry, witnesses emphasised that there is not one Australian housing market, but rather many Australian housing markets, and indeed markets within markets. As such, the committee welcomes advice from the RBA that it is unlikely anything other than carefully targeted macroprudential tools would be deployed in Australia, and APRA would be quite unlikely to consider broad New Zealand-style LVR limits”. What about the recommended and preferred tools – debt servicing ratios?
More details of the report are outlined below.
By way of background, on 12 December 2013, the Senate referred an inquiry into affordable housing to the Senate Economics References Committee for inquiry and report by 26 June 2014. On 17 June 2014, the Senate granted an extension to the committee to report by 27 November 2014. On 2 October 2014, the committee was granted a further extension to report by the first sitting day in March 2015. Following a further extension granted on 2 March 2015, the committee is now due to report by 14 April 2015. On 13 April 2015, the committee presented an interim report with the intention of tabling its final report before 8 May 2015.
In the summary the committee underscores the importance of affordable, secure and suitable housing as a vital determinant of wellbeing. But, based on the evidence, the committee finds that a significant number of Australians are not enjoying the security and comfort of affordable and appropriate housing—that currently Australia’s housing market is not meeting the needs of all Australians.
Sustained growth in median housing costs above the rate of median household income growth in recent decades has made it increasingly difficult for a growing proportion of Australians to afford housing that is safe, secure and appropriate to their needs. Added to the general decline in housing affordability, and indeed compounding the trend, the stock of affordable housing—that is, housing appropriate to the needs of low- to moderate-income households—has failed to keep pace with demand in recent decades. The committee does not believe the issue of housing affordability in Australia is rightly categorised as either a ‘supply-side problem’ or a ‘demand-side problem’. With this in mind, it is clearly evident that supply is currently not keeping pace with demand in the housing market. In this context, policy interventions that add to demand without addressing or at least accounting for supply-side constraints risk inflating house prices and exacerbating affordability problems.
Worsening housing affordability is reflected in declining home ownership rates. This decline is troubling for a number of reasons, not least because home ownership can be an important means for people to achieve financial and social wellbeing. Moreover, high rates of home ownership also provide broader economic and social benefits to the community. As such, while the committee believes governments should work to improve affordability outcomes for all types of housing tenure, it considers it appropriate for governments to promote home ownership.
The committee makes a range of recommendations directed primarily toward improving home purchase affordability. They include state governments phasing out conveyancing stamp duties, to be achieved through a transition to more efficient taxes, potentially including land taxation levied on a broader base than is currently the case. Other recommendations are directed at improving the efficiency, effectiveness and equity of infrastructure funding arrangements, which can have a strong influence on the cost of new housing. Similarly, a number of recommendations are made with the intention of ensuring land supply, urban planning and zoning processes have a positive effect on housing affordability.
Evidence indicated that direct grants to home owners, including First Home Owner Grants, need to be targeted carefully in order to be effective. While the committee suggests that First Home Owner Grants might need to be more tightly targeted, it also believes that shared equity programs are a promising means of helping more Australians become home owners, and consideration should be given to expanding such programs. Equally important, the committee recommends that programs designed to help older Australians ‘age in place’ when they want to, or downsize (or ‘rightsize’) to meet their needs, should be explored.
A large amount of the evidence received during this inquiry concerned the possible effect on home purchase affordability of existing taxation arrangements for investor housing, in particular negative gearing and the capital gains tax discount. The committee recommends that the Australian Government investigate the effect of the current taxation treatment of investment housing on home purchase affordability (among other things), and consider if alternative approaches would help improve affordability.
The problems engendered by poor housing affordability are also clearly evident in the private rental market. Here low- to medium-income earners encounter significant problems accessing affordable and appropriate housing, with significant numbers experiencing rental stress or even severe rental stress. Indeed, one witness described the private rental market as a brutal place for people on welfare payments.
Evidence indicated strongly that renting must be recognised as a mainstream, and for some, a permanent form of tenure in Australia’s housing system and must be placed on Australia’s national policy agenda as a key issue to address poverty. Undeniably, the increasingly tight and expensive private rental sector is locking some low- to moderate-income earners out of affordable and appropriate housing. This situation indicates market failure and suggests that market solutions to low cost housing will simply not emerge naturally: that there is a clear need to find ways to attract private investment into low cost and social housing. But currently, without government incentives, affordable housing does not tend to appeal to private investors.
Many pensioners and people dependent on welfare or disability payments, who find themselves priced out of the private rental market, seek relief by accessing social housing, which provides a much needed safety net. But here they also face fierce competition.
An adequate supply of social housing would mean that older Australians are better able to age in place and not have to forgo daily essentials simply to pay their rent, and people with disability are not left to fend for themselves in substandard dwellings that make no allowance for their particular needs. Also, an adequate supply of social housing would mean that women escaping domestic violence would not be forced to stay in motels or, worse still, remain in abusive relationships. Unfortunately, social housing is in short supply and waiting lists are long. It has become ‘housing of last resort’ and many people desperate for safe, secure and affordable housing are left to ask ‘Where do I go?’
The committee makes recommendations that address identified deficiencies in Australia’s rental market, including a concerted effort by governments at all levels to commit to increasing the overall proportion of social housing as a percentage of Australia’s housing stock. Another cluster of recommendations call for the review and reform of tenancy laws (security of tenure, stability and fairness of rent rises, energy, comfort and safety standards, evictions and dispute resolution mechanisms). In addition, they also deal with the responsibilities and obligations of landlords when it comes to energy efficiency and home modifications for tenants with particular needs.
The committee also targets its recommendations at reinvigorating and improving current Commonwealth and state and territories agreements—National Affordable Housing Agreement (NAHA) and partnership arrangements including National Partnership Agreement on Remote Indigenous Housing (NPARIH) and National Partnership Agreement on Homelessness (NPAH). Furthermore, recognising that the National Rental Affordability Scheme has started the much needed process of attracting private investors into Australia’s affordable rental market, the committee recommends building on its success. The committee also looks at ways to make Commonwealth rental assistance more effective. In addition, the committee recommends establishing a Housing Supply Financing Task Force to investigate and advise government on mechanisms, including housing supply bonds, for engaging private investment in the affordable housing market.
Undoubtedly, Australia has a housing affordability problem—the challenges are complex, diverse and interact differently in different parts of Australia. Considering the vital importance of housing to a person’s overall wellbeing and the current problems gaining access to affordable and appropriate housing, the committee is convinced that access to affordable housing is a matter of national importance. Furthermore, affordable housing should be a national economic issue that needs to be a central and cross-cutting theme of government.
The committee believes governments, including the Australian Government, have a legitimate role, and indeed a responsibility, to use policy interventions to improve the efficiency, efficacy and, critically, the affordability of the housing market. Evidence indicated, however, that Australia’s housing policy and effort is fragmented, which has led to a good deal of confusion and discord in attempts to address housing issues. The various levels of government, and indeed different areas within the same government, often have contradictory objectives that pull in different directions. Clearly, one of the dominant messages coming out of this inquiry is the need for the Australian Government to give coherence to the numerous local, state and national incentives and schemes intended to contribute to the provision of affordable housing. A long-term, integrated and coherent plan with consistent policy governing a national approach to affordable housing is needed.
In the committee’s view, the Australian Government should be the driving force behind the development and implementation of this plan. As such, the current lack of a dedicated Commonwealth housing minister is of concern. Housing-specific policies, and policies that shape the housing market more broadly, have direct and in some cases profound effects on the lives of Australians across the socio-economic spectrum and in all tenure types. In this context, the committee contends there is a compelling argument for a dedicated Commonwealth housing minister able to provide crossportfolio and national leadership on this important policy issue.
Many of the key policy levers that shape the Australian housing market and housing affordability rest with the Commonwealth. In particular, demand-side levers such as taxation policy generally reside with the Commonwealth. Although many supply-side policy levers fall within the remit of the states and territories, the committee is firm in its view that the Commonwealth is best placed to provide the leadership to coordinate and guide the cross-jurisdictional reform necessary to improve the efficiency of housing supply across Australia.
An institutional mechanism is required to bring all levels of government together in order to deliver the overarching strategic approach to affordable housing in Australia. The committee believes that the Council of Australian Governments (COAG) provides the ideal structure within which the Commonwealth and states and territories can develop the strategy and devise the best way to implement it. A Ministerial Council on housing and homelessness within the COAG system, as the committee, recommends, would allow representatives from key government agencies, the not-forprofit organisations, industry bodies and associations, academics and other housing experts to participate in, or contribute to, the formulation of policy.
In this report, the committee recommends that the Australian Government direct its attention and efforts to a number of areas, and makes recommendations accordingly, including developing a long-term national affordable housing plan that:
- recognises affordable housing, including affordable rental housing, as a mainstream and national policy objective and places affordable housing at the forefront of government policy across Australia;
- is spearheaded by a dedicated minister for housing and homelessness and supported by an institutional infrastructure that would provide the continuity, expertise, experience and established networks with all levels of government;
- fosters intergovernmental cooperation in solving housing issues within a ‘whole-of-system housing policy framework’;
- places a high priority on improving the supply-side efficiency of the Australian housing market;
- reinvigorates NAHA placing particular emphasis on improving transparency and accountability, and introducing a robust evaluation and reporting framework;
- contains clear, consistent and longer-term funding commitments adequate to meet the growing demand for social housing;
- recommits to halving homelessness by 2025;
- takes account of the findings outlined in this report including facts such as the age pension assumes home ownership and the projected decline in home ownership especially among older Australians;
- builds trust and confidence that Australian governments at all levels, led by the Commonwealth, are committed to increasing the supply of affordable housing;
- provides consistency, coherence and policy certainty for the affordable housing sector that would enable housing providers to forge stronger partnerships with the private sector;
- recognises that significant volumes of public and private finance would be required to meet the projected need for additional rental housing and the importance of attracting institutional investors into the affordable housing market;
- understands that efforts to attract a significant level of institutional investment into affordable housing have to date been largely unsuccessful; and
- makes institutional investment a core policy objective in affordable housing.
Overall, and as highlighted in the strong and resounding messages drawn from the bulk of evidence, the committee is firmly of the view that:
- the Australian Government cannot vacate the affordable housing space or step back from its responsibilities to ensure that every Australian has access to affordable, safe and sustainable housing; and
- in the long run, investment in affordable housing returns dividends not only to the individual struggling to access safe, secure and affordable housing but to the budgets of the Australian, state and territory governments and ultimately the Australian taxpayer (by having a more productive community with reduced costs for social, health and unemployment services and for justice and policing.)
The Forty Recommendations are summarised below:
- The committee recommends that the Australian Government appoint a Minister for Housing and Homelessness, with the portfolio to be located in a central agency such as the Department of the Prime Minister and Cabinet or the Treasury, or in the Department of Infrastructure with formal links to the central agencies.
- The committee recommends that, as a matter of priority, the Commonwealth and states and territories agree to establish a ministerial council on housing and homelessness within the Council of Australian Governments ministerial council system.
- The committee recommends the establishment of a new body, ideally a statutory body, similar in function to the former National Housing Supply Council, but also with responsibility for monitoring performance against a new affordable housing plan (see recommendation 4) and measuring housing need according to key demographic trends, socio-economic and cultural factors.
- The committee recommends that the Commonwealth and states and territories collaborate in the development of a long term, national affordable housing plan, ideally to be developed through a new ministerial council on housing and homelessness within the Council of Australian Governments ministerial council system (see recommendation 2). While the shape of the plan and its relationship to the National Affordable Housing Agreement would be determined through the development process, the committee recommends that the plan:
(a) include performance indicators, which should be monitored and reported on by the body recommended at recommendation 3; and
(b) include base funding, possibly drawn from the National Affordable Housing Agreement funding envelope, with consideration also given to including Commonwealth reward payments linked to achievement by individual jurisdictions against the performance indicators.
- The committee recommends that state and territory governments phase out conveyancing stamp duties, and that as per the recommendations of the Henry Review, this be achieved through a transition to more efficient taxes, potentially including land taxation levied on a broader base than is currently the case.
- The committee recommends that all states and territories report to the Council of Australian Governments (COAG), preferably through a new ministerial council on housing and homelessness (see recommendation 2), on what policy changes, if any, have been made to ensure infrastructure charges are consistent with the four principles agreed through COAG in July 2012.
- The committee recommends that state and local governments investigate the possibility of using Tax Increment Financing and other innovative finance mechanisms to fund infrastructure for new housing developments.
- The committee recommends that the proposed new Council of Australian Governments ministerial council on housing and homelessness (see recommendation 2) investigate ways to improve the consistency, timeliness and utility of government-collected and published information about land supply across jurisdictions.
- The committee recommends that the Australian Government:
(a) show leadership in regard to national urban planning policy and urban regeneration, given the role both can play in improving and driving housing affordability outcomes across Australia’s major urban centres;
(b) reinstate the National Urban Policy and Major Cities Unit given the former role both played in driving housing affordability policy and outcomes at the national level; and
(c) show leadership in its policy capability and engagement with the states and territories with regard to urban planning policy.
- The committee recommends that the Australian Government consider developing a long-term strategy for regenerating Australia’s urban centres and transport corridors. This strategy might be incorporated into a revised national urban policy, and would provide for an intergovernmental and coordinated approach to infrastructure delivery, including upgrades to social infrastructure, and the identification of redevelopment opportunities for government-owned land (as outlined in recommendation 11).
The committee further recommends that the Australian Government consider reestablishing the Urban Policy Forum, reconnecting with key stakeholders from the public and private sectors, academia and the community, and including responsibility for reviewing jurisdictional performance against targets relating to urban regeneration.
- Government-owned land, whether state or Commonwealth-owned, represents a potential land supply for affordable housing. Current governance, transparency and divestment arrangements could be improved so that this potential might be realised. The committee recommends:
(a) the creation of a transparent, public, up-to-date register of government land and buildings that are considered ‘surplus’ or on the divestment program, including the location and size of this land, and any development restrictions attached to it;
(b) the direct involvement of the Commonwealth agency with housing policy responsibility in any asset divestment programs, and the possible application of affordable housing targets in divestment programs;
(c) the development of innovative partnerships involving public, not-forprofit, community and private consortiums that develop affordable and diverse housing on government land and buildings; and (d) the exploration of innovative models, such as community land trusts, on government-owned land where the government retains the land or a share in the development, but a community or not-for-profit housing provider develop affordable housing.
- The committee recommends a separate parliamentary inquiry into the Australian prefabricated housing industry, and its potential role in improving housing affordability and stimulating new activity in the manufacturing sector. This inquiry should consider, among other things:
(a) the development of a comprehensive approach to creating a sustainable prefabricated building and insulated panel production industry;
(b) the possibility of Commonwealth prefabricated housing targets in a national affordable housing plan (see recommendation 4);
(c) the possibility of a Commonwealth prefabricated modular housing industry package to provide support for research and development, skills and training, assistance to establish new production and manufacturing facilities, and world class demonstration projects.
- The committee recommends that, to the extent such matters are not addressed by the White Paper on the Reform of Australia’s Tax System, the Treasury should prepare and publish a study of the influence of negative gearing and the capital gains tax discount on home purchase affordability and on the rental market (including the effect on security of tenure for renters), the effect of these arrangements on revenue, and their effect (if any) on economic productivity. This study should examine the likely effects of alternative taxation treatments of investor housing. Alternative approaches considered in this study (including, where appropriate, in combination) should include:
(a) a housing-specific ‘quarantine’ approach, wherein losses for investment properties can only be deducted against rental income, with provision for losses in excess of rental income to be carried forward and deducted against future rental income and capital gains;
(b) a broader ‘quarantine’ approach, wherein interest expenses on all investments, including but not limited to housing assets, are only deductible in any given year up to the amount of investment income earned in that year, with provision for losses in excess of this amount to be carried forward and deducted against future investment income and capital gains;
(c) limiting the application of negative gearing arrangements to new housing stock, or designated new affordable housing stock;
(d) limiting the application of negative gearing to a certain number of properties (assessing options for various limits in this regard);
(e) options for phasing out negative gearing on investment housing;
(f) applying the savings income discount recommended in the Henry Review to investment housing, with consideration given to the impact of this approach both with and without the implementation of the Henry Review’s recommendations in relation to housing supply and housing assistance; and
(g) reducing or removing the capital gains tax discount for investment properties, or reverting to the pre-1999 system of taxing real rather than nominal capital gains on investment assets.
- The committee recommends that, to the extent state and territory governments maintain first home buyer grants, they apply appropriate value caps and limit their availability to new housing stock (with appropriate exceptions for certain groups of buyers), and consider introducing means testing to ensure that the grants are appropriately targeted.
- The committee recommends that the Australian Government consider introducing a scheme designed to assist first home buyers save for a home deposit, drawing as appropriate on the experiences of the First Home Saver Account scheme.
- The committee recommends that all governments, through the proposed ministerial council on housing and homelessness (see recommendation 2) or another appropriate intergovernmental forum, investigate ways to expand shared equity programs, including both government-backed and private-sector backed programs. The committee further recommends that, as part of this process, consideration be given to other mechanisms to facilitate affordable home ownership, such as community land trusts, rent to buy schemes, and the like, and consider the inclusion of such mechanisms within the national affordable housing plan proposed at recommendation 4, or the National Affordable Housing Agreement.
- The committee recommends that the government investigate new policy settings that will address barriers to downsizing (or ‘rightsizing’) by retirees, including schemes along the lines of the Housing Help for Seniors pilot.
- As a national policy issue, affordable home ownership tends to overshadow affordable renting even though many Australians struggle to access affordable and appropriate housing in the rental market. With this in mind, the committee recommends that the Australian Government recognise affordable renting as a mainstream form of tenure in Australia and place it prominently on the national policy agenda. Given that renting will be the only form of housing for many Australians, one of the key challenges for government is to change the traditional view of renting as a shortterm transitional phase. The committee recommends that the Australian Government in collaboration with the states and territories, through the recommended ministerial council on housing and homelessness within COAG, start the urgent process of turning around this acceptance of short-term insecure tenure as normal. As a first step, the committee recommends that the proposed ministerial council consider tenancy regulations in the various jurisdictions with a view to delivering greater security for long-term renters.
- Considering the evidence presented to this inquiry, the committee recommends that the states and territories review their tenancy laws to ensure that all rental properties are required to meet minimum standards.
- The committee also recommends the Australian Government:
• together with the states and territories, investigate national minimum standards that would set specific minimum standards including security of tenure, stability and fairness of rent prices, a new efficiency and comfort standard, safety and security of the home, and better protection for groups in marginal housing;
• review (and increase) funding levels and access to tenancy advice services;
• in recognition of the value of tenancy advice services, make funding through the National Affordable Housing Agreement (NAHA) conditional on the states and territories ensuring that they have in place adequate tenancy advisory services; and
• include as a priority for the re-established Housing Supply Council (see recommendation 2) to review and publish detail on the current national rental affordability gap.
- Recognising the reluctance of tenants to exercise their rights under the respective residential tenancies legislation in each state, the committee recommends that the states review their existing system for settling tenancy disputes. The committee recommends further that the states consider establishing an independent body such as an ombudsman or giving specific powers to their consumer affairs agencies to act for tenants. Again, the committee recommends that the Australian Government act as a catalyst through the COAG process to encourage the states and territories to establish dispute resolution bodies that provide easier and less expensive access to a mechanism for the resolution of tenancy matters.
- The committee recognises that public housing has now become the housing of last resort for many Australians with supply unable to meet the demand and waiting lists far too long. With this situation in mind, the committee recommends that the Australian Government, together with the states and territories, commit to retaining an adequate supply of public housing with the goal of increasing the overall proportion of public housing as a percentage of housing stock. Targets should be established for both the proportion of social housing and the reduction in existing waiting lists as part of the national housing plan, working through COAG and the re-established National Housing Supply Council. The initial goal would be for the Australian Government together with the states and territories to fund public housing in order to lift the percentage of public housing from its current low base and to reach agreement on a plan to achieve this objective. The committee recommends further that an underlying principle shaping the development or redevelopment of public housing must be to prevent the concentration of people with complex problems in the same locality and in locations removed from important services—transport, education, health, welfare and employment.
- The committee recommends that the Australian Government request the Productivity Commission undertake an inquiry into the merits of transferring public housing to the community housing sector with particular emphasis on the advantages and disadvantages of transferring property title.
- Consistent with the recommendation for the Australian Government to increase the overall proportion of public housing as a percentage of housing stock, the committee recommends that the Australian Government together with the states and territories commit to achieving a higher proportion of overall social housing as a percentage of Australia’s housing stock. This recommendation recognises that currently social housing in Australia forms only a small proportion of Australia’s housing stock and is falling far short of meeting demand.
- The committee recommends that the Australian Government in collaboration with the states and territories monitor carefully the transfer of public housing stock to the community sector to ensure that this transfer does not adversely affect tenants of public housing or cause them unnecessary anxiety if required to vacate their dwelling. The recommendation is intended to ensure that tenants are consulted about the changes and that their rights as tenants, including security of tenure, of rent levels, and of access to dispute resolution mechanisms is preserved.
- In light of the anticipated rise in the number of older Australians in the private rental market, and the insecure tenancy confronting many older renters, the committee recommends that the Australian Government look closely at its aged care policy so that it takes account of the particular difficulties confronting older Australians in the rental market. The aim would be to determine how policies designed to assist older Australians remain in their home could take better account of, and accommodate, the added difficulties for older people accessing safe and secure housing and in conducting modifications to rental dwellings, and more broadly renting in the private rental market.
- The committee recommends that the Australian Government together with the states and territories commit to ensuring that adequate funding be made available so that women and children escaping domestic violence are housed in secure and appropriate housing with the necessary support network that would allow them to remain in a safe environment. This approach would mean that women and their children would experience as little social and educational disruption as possible and that the pathway to more permanent housing would be easier. A priority would be to consider the introduction of programs throughout Australia such as New South Wales’ Staying Home Leaving Violence initiative, which is designed to protect women who want to live separately from a violent husband or partner, but remain in their home. The committee also recommends the Australian Government reverse the cuts to the capital program in National Partnership Agreement on Homelessness (NPAH) and apply needs-based supply and services program as part of the national affordable housing platform in recommendation 30 (the cuts are discussed in chapter 18).
- The committee recommends that, in its consideration of current tenancy law, the proposed ministerial council also place a high priority on the obligations and responsibility of landlords when it comes to house modifications for those with particular housing needs. The committee recommends that the council look at measures, such as tax incentives, to encourage landlords to improve the energy efficiency of their properties and to make required modifications for tenants with disability.
- The committee recommends that housing should be included in the Prime Minister’s Closing the Gap report: that access to affordable and appropriate housing must be regarded in the same context as Indigenous education, health and employment.
- The committee recommends that the Australian Government:
• take a definite and high profile role in placing affordable housing at the forefront of government policy across Australia;
• make a strong and certain recommitment to NPAH (including considering reintroducing ongoing capital component) and its continuation for at least ten years;
• task Homelessness Australia with investigating and quantifying the service delivery gap to people experiencing homelessness, and commit to funding NPAH to meet that gap;
• recommit to the target to at least halve homelessness by 2025 (originally set at 2020 in the 2008 White Paper) with set milestone at two yearly intervals to track and report on progress and to offer supported accommodation to all rough sleepers who want it;
• work to achieve multi-party support for this long-term goal and, noting that this problem cannot be solved at any one level of government, encourage states and territories to commit to this target and to coordinate their response;
• take a longer-term approach when funding programs or agreements that would provide certainty of funding so that organisations and people engaged in delivering programs can, with confidence, plan ahead and seek to achieve continuity in the services they provide to homeless people; and
• introduce an urgent capital program with the Australian Government and the states sharing responsibility for funding through NPAH to provide fast build, sustainable and appropriate emergency housing and affordable rental housing to meet the needs of Australians rough sleeping and seeking appropriate housing, with the target of housing by 2020 all rough sleepers who seek to be housed.
- Noting that much of the evidence presented before this committee was consistent with the Australian National Audit Office’s (ANAO) findings on the implementation of NPAH, the committee recommends that COAG establish a working group to review the ANAO’s findings and reassess the implementation of NPAH to ensure that NPAH has:
• clear performance measures that can be tracked and verified;
• a requirement for states and territories to report to government on their expenditure on housing under NPAH complemented by a reporting framework that measures the implementation of reforms against set benchmarks and the extent to which they are being delivered on the ground;
• Commonwealth funding linked to the achievement of agreed milestones; and • investigate Centrelink as a one stop shop to assist people experiencing or at risk of homelessness with referral and in-house expertise to link clients with services and housing.
- The committee recommends that the Australian and state and territory governments recognise the important work of advocacy and peak organisations in housing and homelessness and provide adequate support to enable them to continue to deliver their much needed services.
The committee recommends further that the Australian Government reinstate funding for the peak bodies that represent and provide advice on homelessness, community housing and housing and tenancy policy.
- The committee notes that the advice provided to the committee on the Williams decision and the consequences for Commonwealth funding for housing and homelessness simply adds to the uncertainty around the future of Commonwealth funding in this area. The committee recommends that the Australian Government clarify what the consequences are for Commonwealth funding grants for housing and homelessness that flow from the Williams decision and how it intends to respond to them.
- The committee recommends that through COAG, the National Affordable Housing Agreement (NAHA) be reinvigorated with particular emphasis on improving accountability and transparency. The committee recommends that the following particular reforms of NAHA should be considered and acted upon:
• expand the agreement to include all forms of housing assistance—funding for social housing, affordable rental housing, rent assistance and the various programs to support people to remain housed;
• develop measurable benchmarks and ensure these benchmarks are used to evaluate the effectiveness of government expenditure on affordable housing;
• improve the collection and publication of data, especially on the number of new homes added to the pool of social housing; and
• ensure that funding is tied directly to concrete outcomes, for example, by tightening conditions on Commonwealth funding to the states that would realise growth in the stock of social housing.
- The committee recommends that the Federation White Paper process consider carefully NAHA in this critical area of transparency and accountability. Importantly, that the committee’s findings feed into the White Paper process with the aim to improve NAHA so that a robust evaluation and reporting framework is established ensuring that the funds allocated to improving affordable housing can be tracked and the intended outcomes measured and evaluated.
- The committee recommends that:
• in the absence of any credible alternative scheme designed to increase the supply of new affordable housing and considering steps have already been taken to improve the administration and implementation of the National Rental Affordability Scheme (NRAS), that the Australian Government continue with NRAS round 5;
• the Federation White Paper process look at the Queensland NRAS model, which appeared to have much tighter controls over eligibility, as a means of determining where further improvements or fine-tuning could make the system more robust and effective;
• the Federation White Paper process look at how NRAS or a replacement scheme could be reframed to take account of the particular housing circumstances of regional Australia and ensure that NRAS housing was better targeted to areas in most need; and
• as part of the Federation White Paper process, a thorough cost benefit analysis of NRAS be undertaken, and that any such analysis include comparison of forgone revenue from demand subsidies such as the first home owners grant, and negative gearing and capital gains tax.
- The committee recommends that when considering NRAS, the Federation White Paper process:
• take note of the concerns raised by many submitters and witnesses about the need for continuity and certainty in order to attract and to gain the confidence of private investors; and
• ensure that any proposed refinement or a replacement of the scheme: • places the highest priority on restoring and building on the initial success that NRAS had in attracting private investors;
• provides investors with certainty regarding the scheme by committing to a consistent flow of incentives extending over a period of at least five years; and
• takes note of lessons to be learnt from NRAS such as the need for clear and tight eligibility criteria and better targeting to areas of need (the ANAO audit should provide a sound starting point).
- The committee recommends that the Australian Government, through legislative recognition of charitable status, resolve any uncertainty over the effect that participation in NRAS or any similar scheme would have on the tax status of entities operating as charities, or public benevolent institutions (PBIs).
- The committee recommends that the Australian Government:
• review the eligibility criteria for Commonwealth Rental Assistance (CRA) to ensure that it is targeted at those most in need;
• review the method of indexing CRA with a view to retaining its adequacy; and
• review the adequacy of CRA.
- The committee recommends that the Federation White Paper process give due consideration to the proposal for the introduction of housing supply bonds using the Australian Housing and Urban Research Institute’s (AHURI) research as a starting point for its consideration.
The committee also recommends that the Australian Government establish a crosssectoral high level industry and government Housing Supply Financing Task Force, as proposed in the AHURI report. It would provide advice to governments on the potential for a Housing Supply Bond in Australia and investigate other mechanisms for private investment.

 Across most cities house rental yields are lower now than they were at the same time last year, the exceptions are Brisbane, Adelaide and Hobart where they are unchanged. At 3.4%, rental yields in Sydney are the lowest they’ve been since May 2005 and at 3.2 per cent Melbourne yields are at their lowest level since November 2010. The unit market shows different trends to the detached housing market with yields higher or unchanged over the year across most cities. Unit yields are lowest in Melbourne (4.2%) and Sydney (4.3%) and highest in Darwin (5.9%) and Brisbane (5.4%). Unit yields in Sydney are at their lowest level since August 2005 while yields in Melbourne have edged higher over the past month.
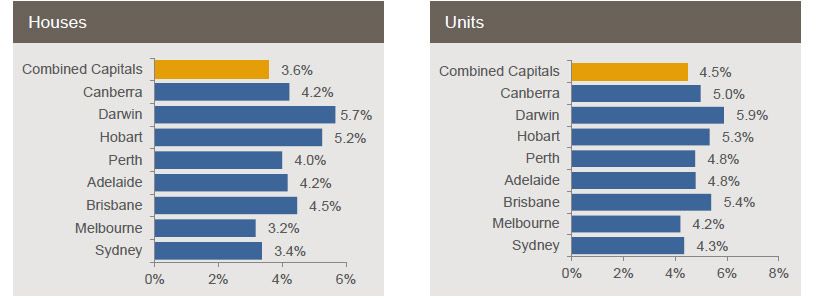 Across the combined capital cities, rental rates are recorded at $487 per week and they have risen by 0.1% over the month, 0.7% over the past three months and by 1.7% over the past 12 months. Although rental rates are still increasing, they are doing so at a moderate rate. In fact, the annual rate of growth has been recorded at 1.7% for four consecutive months and hasn’t previously been this low since June 2003. The slow pace of rental appreciation can likely be attributed to the booming level of dwelling construction coupled with high levels of buying activity from the investment segment which is adding additional rental stock to the market and curtailing rental increases. Looking across the capital cities, over the past year Sydney and Hobart have recorded the greatest increases in weekly rents. Rents have fallen over the past three months in Perth and Darwin; along with Canberra these cities have recorded rental falls over the year, down -4.2%, -4.7% and -2.6% respectively.