
Its the last day of January, so the RBA has released their credit aggregates to the end of December 2019 and APRA released their latest modified Monthly Authorised Deposit-taking Institution Statistics.
Looking at the RBA data first, over the past month housing credit stock (the net of new loans, repaid loans and existing loans) rose by 0.3%, driven by owner occupied housing up 0.5%, while investment loans slide just a little, but rounded to zero. Personal credit slid another 0.5% while business credit rose 0.2% compared with the previous month. These monthly series are always noisy, and they are also seasonally adjusted by the RBA, so there is plenty of latitude when interpreting them.
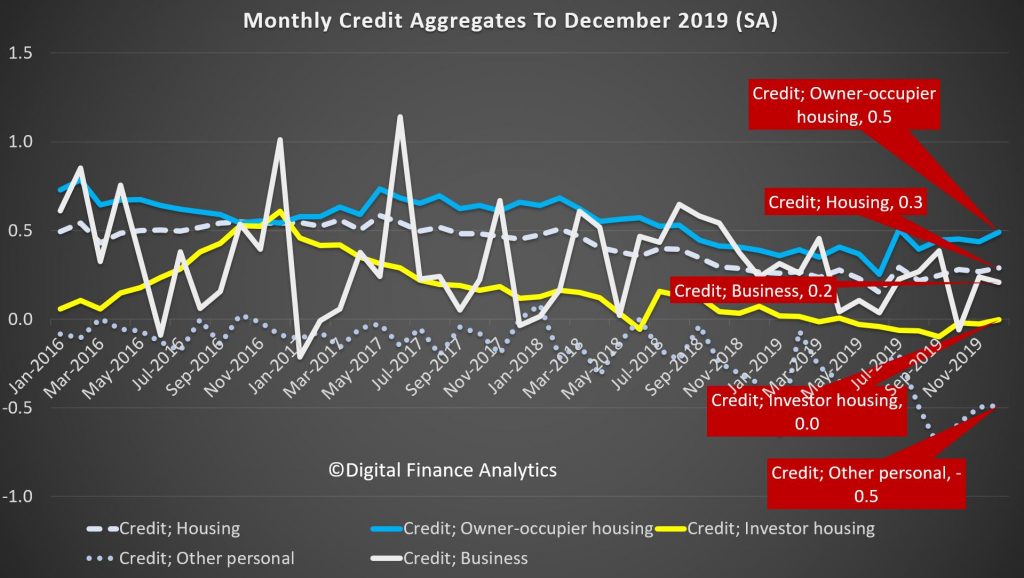
But overall, total credit grew by 0.2% over the month, while the broad measure of money rose just 0.1%.

The three month derived series helps to spotlight the key movements over the past few years. Credit growth for owner occupation rose 1.4%, and it has been rising a little since the May election, and the loosening of lending standards by APRA, and lower rates later. Its low point was a quarterly rise of 1% a few months ago. Investment lending continues to shrink, at 0.1%, but the rate of decline has eased from September, again thanks to loser lending standards. However this also reflects a net loan repayment scheme that many households, in the current tricky environment are on. Personal lending is still shrinking, falling at 1.6%, though the rate of slowing is reversing from a low of minus 1.8%. Business credit is o.4%, but has been falling since October where it stood at 1.8%, reflecting a serious downturn in business confidence and demand for credit. For businesses, the economic backdrop has been a challenging one. The global economy is sluggish and household spending is soft. In this environment business investment in the real economy has lost momentum across the non-mining sectors – weighing on credit demand. Rolling total credit for 3 months is 0.6%, up from a low of 0.5% a couple of months back.

Turning to the annualised data series, housing credit is at 3.1% up from 3.03% last month. Annual owner occupied housing is up 5% from a low of 4.7% in August, while investor loans are down 0.3%, which is the largest fall we have ever seen. Personal credit is 5.1% lower, and that is another record low, while business credit grew by 2.5% on an annual basis, which is the lowest its been for years.
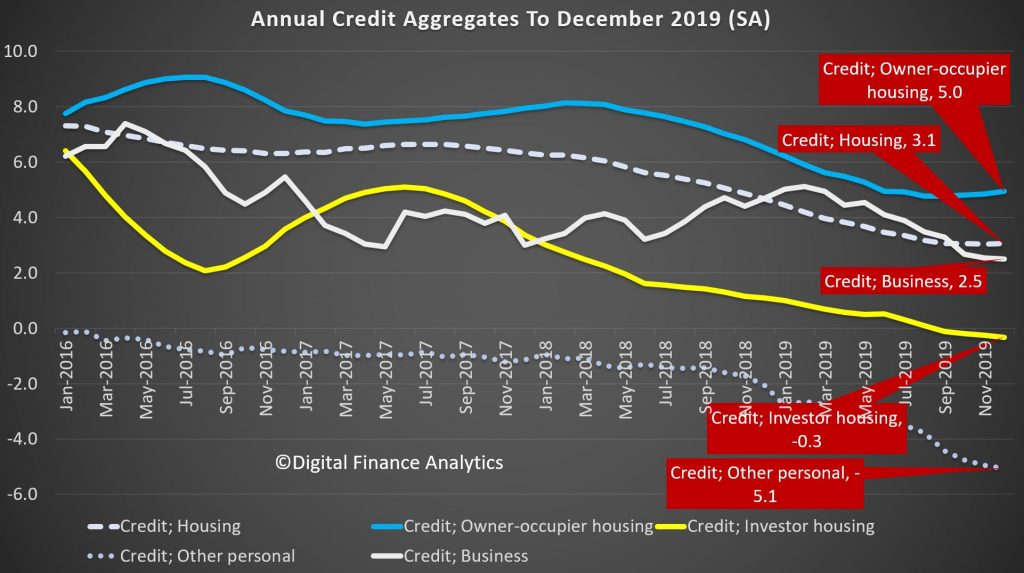
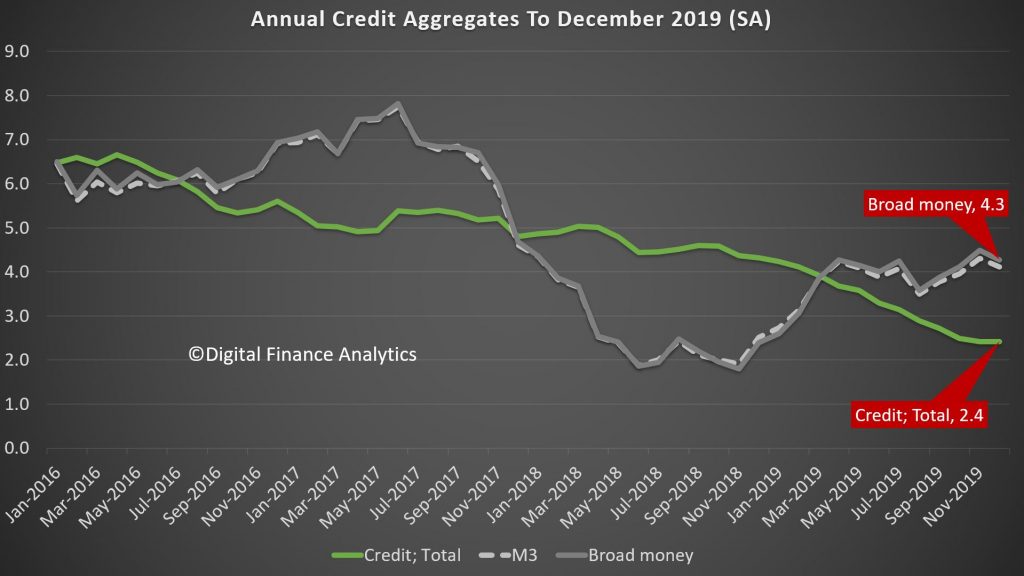
As a result, total credit grew 2.4%, which is the lowest level of growth since 2010, following the global financial crisis. Credit growth has progressively eased after peaking at 6.7% during the 2015/16 financial year. Key to the slowdown was the housing downturn as the cycle matured and lending conditions tightened. On the other hand, broad money is growing at 4.3%, and is significantly higher than last year, which we attribute to the positive terms of trade (thanks to iron ore prices and commodity volumes and RBA open market operations).
So while sentiment bounced after the May Federal election, which removed uncertainty around tax policy for the sector, as the RBA has lowered rates since June by a total of 75bps, with further cuts likely and APRA easing mortgage serviceability assessments; growth is anemaic, and of course sentiment is now in the gutter, thanks to the bushfires, coronavirus, and lack of income growth. While many analysts are predicting a bounce in credit in 2020, and a sentiment turnaround, pressure on global commodity prices and weak international tourism, as well as the drought are likely to take their toll.
We are also seeing more applications for mortgages being received, but also higher rejection rates, so we will see if this will really lead to stronger credit. And given such weak credit, we still question the veracity of the CoreLogic price series, which seems to exist in a different world. Our data supports much weaker average home price growth.
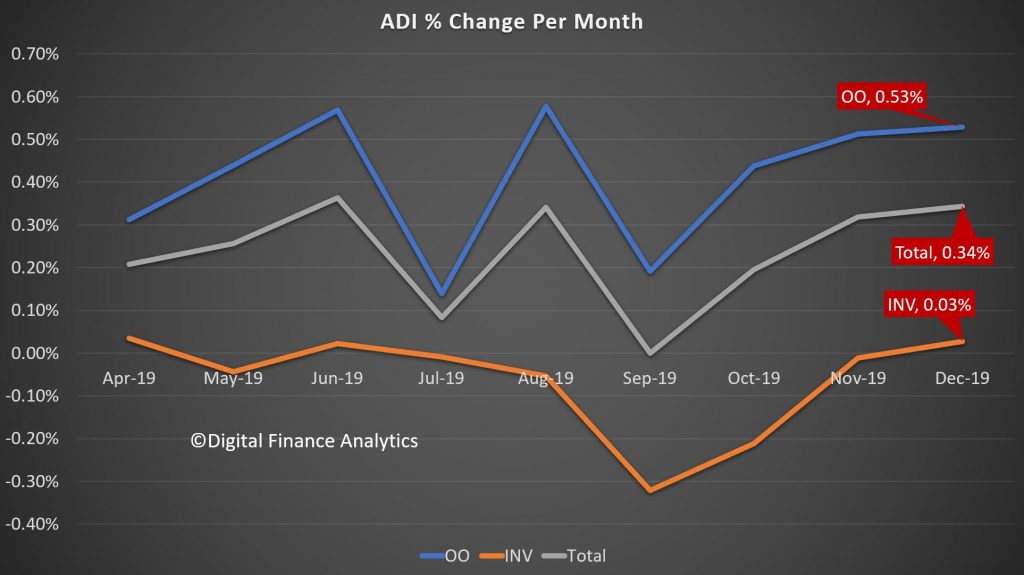
Turning to the APRA Bank series, the total value of mortgages lent (in original terms) grew by 0.34%, which is stronger than the market (0.3%), suggesting that the banks may be clawing back some business from the non-bank lenders, who have been quite active over the past couple of years. Within that owner occupied loans rose by 0.53% in the month, while investment loans grew 0.3%. The rate of growth remains slow.
The total stock of loans did rise, up around $5 billion dollars to $1.09 trillion for owner occupied loans, and up only slightly to $644 billion, giving total exposures of $1.74 trillion, a record. The mix of investment loans fell to a low of 36.9%.
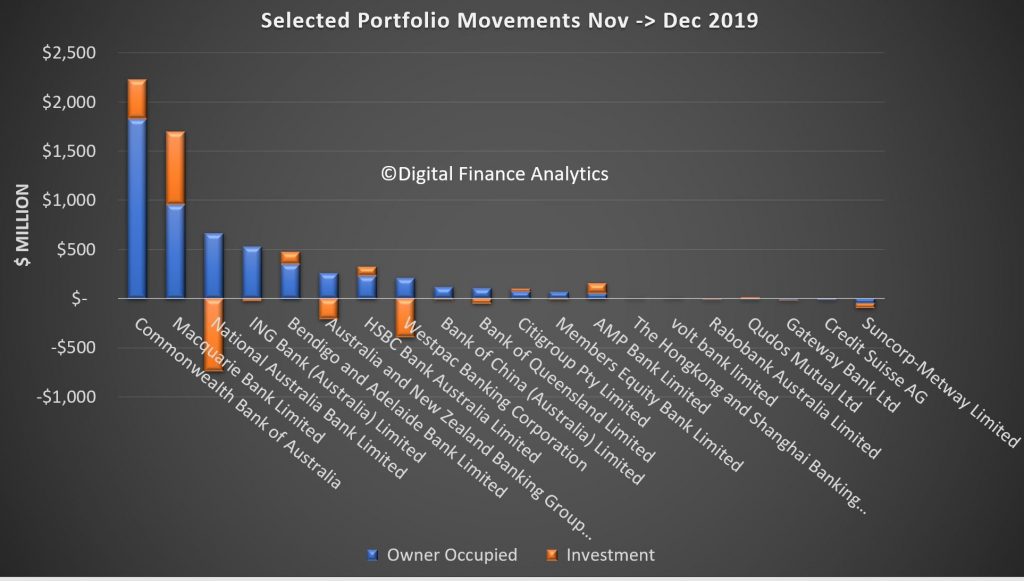
Finally we can examine the portfolio movements by individual lender, which reveals that, according to the data submitted by lenders (which may include some adjustments) CBA grew their portfolio the strongest, up more than $2.2 billion, including both owner occupied and investor loans, followed by Macquarie which continues to drive investor lending very hard, while NAB, Westpac and ANZ grew their owner occupied loans, while dropping their investor lending balances. Bendigo Bank, AMP and HSBC were also active in growing their investor loans. Neo-lender Volt Bank made an appearance in our selected list, while Suncorp dropped the value of both their owner occupied and investor loans. This highlights that lenders are steering quite different paths in their underwriting and marketing strategies. Time will tell whether the new loans being written are more risky.
And in closing, its interesting to note APRA’s release today saying that
The Australian Prudential Regulation Authority (APRA) will expand its quarterly property data publication to include new and more detailed statistics on residential mortgage lending.
In a letter to authorised deposit-taking institutions (ADIs) today, APRA confirmed the next edition of its Quarterly Authorised Deposit-taking Institution Property Exposures (QPEX) publication would include additional aggregate data on residential property exposures and new housing loan approvals.
The decision is part of APRA’s to move towards greater transparency, and will enable more in-depth market analysis by industry analysts, media and other interested parties.
The updated QPEX publication will also feature:
• reporting of additional sector-level statistics for the ‘Mutual ADI’ category; and
• clarified definitions for reported items, specifically for unreported loan-to-value ratios.
APRA Executive Director of Cross-Industry Insights and Data Division, Sean Carmody said: “APRA’s updated Corporate Plan commits us to increasing transparency of both our own operations and the industries we regulate. One of the key ways we can do that is by releasing more of the data we collect.
“With the ADI sector heavily reliant on commercial and residential property lending, enhancing QPEX will translate to greater transparency and sharper insights into one of the most crucial contributors to the economy.”
Consultation is continuing separately on a proposal for quarterly publication data sources to become non-confidential. This would mean that more of the underlying data may be disclosed to the public on a dis-aggregated basis. While this consultation remains open, APRA will continue to publish industry and peer group aggregate data, and mask data in QPEX where an individual entity’s confidential information could be revealed.
The next QPEX will be published on 10 March 2020 for the December 2019 reference period.
The letter to industry and non-confidential submissions can be found at: https://www.apra.gov.au/authorised-deposit-taking-institution-publications-refresh
We believe that the dis-aggregated data should indeed be released – because sunlight remains the best disinfectant to quote Supreme Court Justice Louis Brandeis. Compared with the disclosures in other markets, Australia is so behind the times, on the pretext of confidentially. So we endorse the need for more granular data to help separate the lending sheep from the lending goats.