
Moody’s says that markets are now relatively sanguine about default risk, effectively concurring with the baseline forecast of Moody’s Default Study. However, compared to baseline default forecast, more can go wrong than right.
After rising from September 2014’s current cycle low of 1.6% to July 2016’s 5.5%, the baseline forecast sees the US high-yield default rate peaking in early 2017 at roughly 6.5%. Thereafter, the baseline prediction has the default rate receding to 4.9% by July 2017.
The baseline forecast is bordered by considerable downside risk. In addition to the baseline view, Moody’s Investors Service supplies optimistic and pessimistic projections for the default rate. The optimistic scenario projects a 5.3% average default rate for January-July 2017 that hardly differs from the 5.6% projected average of the baseline view. In stark contrast, January-July 2017’s 13.7% average expected default rate of the pessimistic scenario towers over the baseline forecast.
On balance, the default forecast suggests that the best days of the current credit cycle have passed. Even if the optimistic backdrop holds true, the default rate is likely to remain above-trend given the presence of an economic recovery. That is: The optimistic scenario predicts a range of default rates that exceeds both the average and median default rates of economic recoveries. Even if the optimistic view is correct, the default rate may still exceed its average, or trend, of an economic upturn.
Since the 1981-1982 recession, whenever the US lagging 12-month high-yield default rate either mostly or entirely overlapped an economic recovery, the default rate revealed a median of 3.4% and an average of 4.1%. By contrast, the default rate generated a median of 10.7% and an average of 9.6% whenever the yearlong observation period either mostly or entirely overlapped a recession.
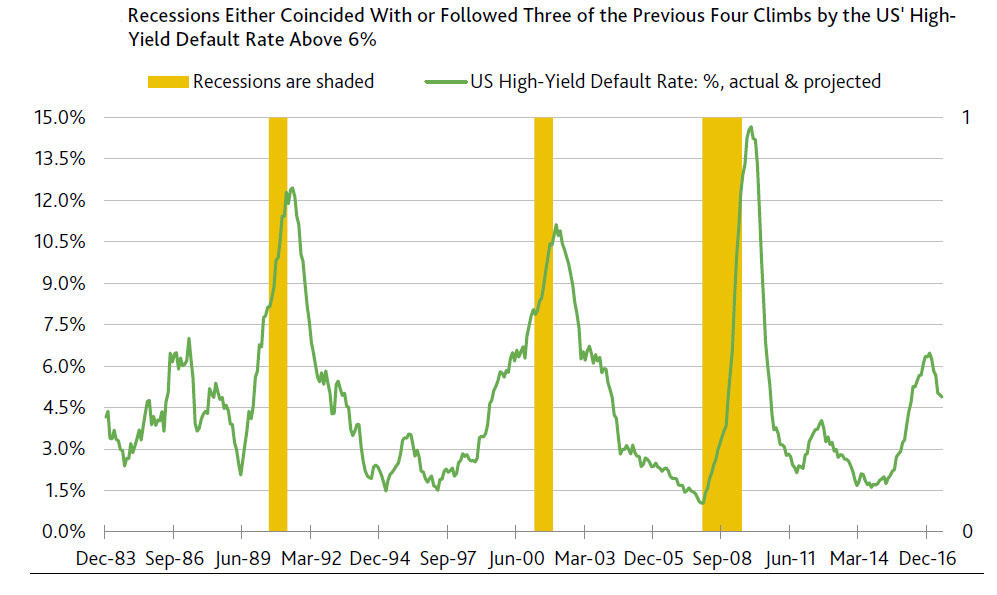
Recessions joined three of the four prior climbs by the default rate to 6.5%. Following each of the three previous episodes showing a climb by the default rate up to 6.5%, the default rate continued its ascent. After first reaching 6.5% in February 2009, April 2000, and February 1990, the default rate eventually crested at 14.7% in November 2009, 11.1% in January 2002, and 12.4% in June 1991. Coincidentally, a recession overlapped each of the default rate’s last three peaks. In addition, the equity market suffered deep setbacks at some point during the 12 months prior to the peaking of the default rate.
Only once has an ascent by the default rate to 6.5% not been followed by a recession within 12 months. The lone exception occurred during the mid-1980s, or when the default rate first approached 6.5% in July 1986. Thereafter, the default rate formed a localized peak at the 7.0% of April 1987.
The 1986-1987 climb by the default rate was linked to a profound deceleration by the annual increase of corporate gross-value-added — a proxy for corporate net revenues — from 1984’s patently unsustainable 12.1% surge to the 3.8% of the year-ended March 1987. Partly because of a less pronounced slowing of employment costs to the 6.4% annual increase of the year-ended March 1987, operating profits went from soaring higher by 20.8% annually in 1984 to contracting by -9.1% annually for the 12-months-ended March 1987.
However, during the ensuing two years, corporate credit quality benefited from an 8.2% average annual advance by corporate gross-value-added that stoked an accompanying 14.9% average annual increase by operating profits.
Thus, the market’s current expectation of a limited rise and subsequent fall by the high-yield default rate implicitly assumes a major rejuvenation of net revenues. As derived from the US National Income Product Accounts (NIPA), corporate gross-value-added slowed from the 5.4% annual increase of the year-ended June 2015 to the 2.1% of the year-ended June 2016. Partly because the deceleration by net revenues was more pronounced than the comparably measured ebbing of employment cost growth from 5.4% to 4.7%, the annual percent change of operating profits switched direction from the 4.7% increase of the year-ended June 2015 to the -6.8% contraction of the year-ended June 2016.