
The end of the working month heralds another set of credit stats from both the RBA and APRA. The RBA reports via their Credit Aggregates, which is all credit stock in the system, while APRA reports on the banks (ADI’s) and also provides some individual lender loan stock data. And which ever way you look at it, credit growth is still anaemic, as the “great deleveraging” continues. And given the weak credit impulse, home prices may also be growing more slowly than many are claiming, though that is another story, for another day.
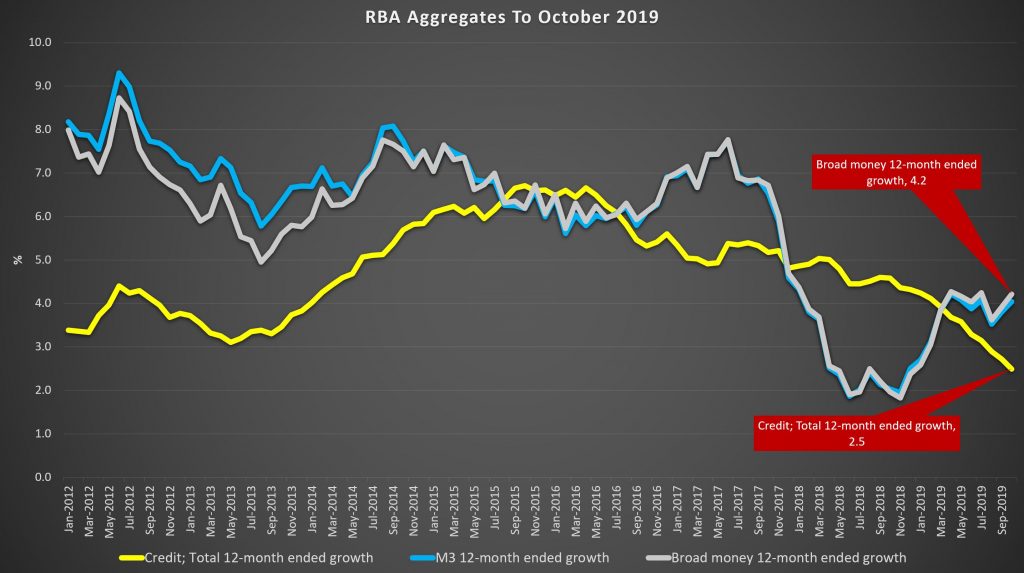
The RBA said that housing credit growth overall was 0.3% higher in October, compared with 0.2% in September. This translates to an annual rate of 3% to October (3.1% last month), compared with 5% just a year back.
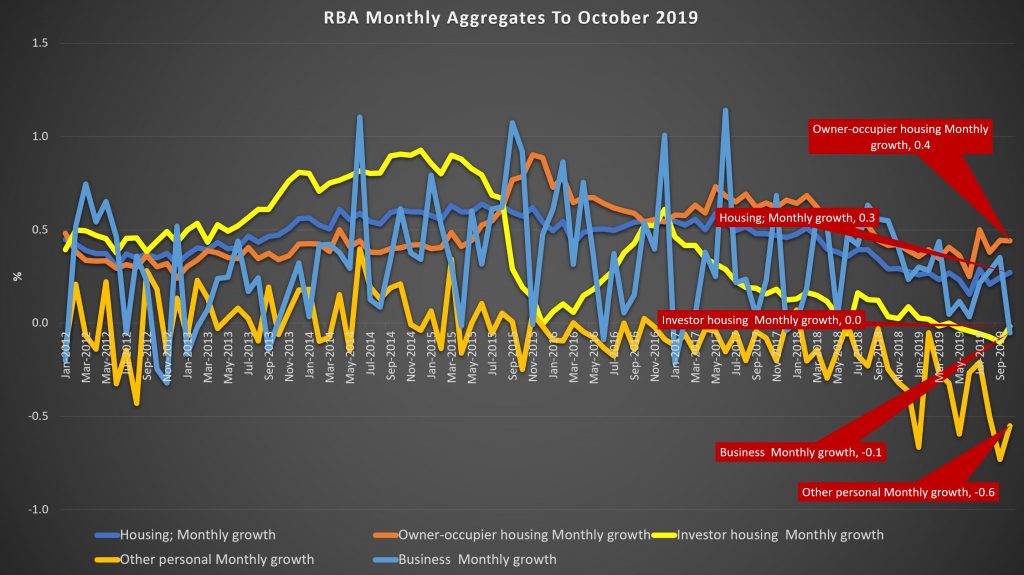
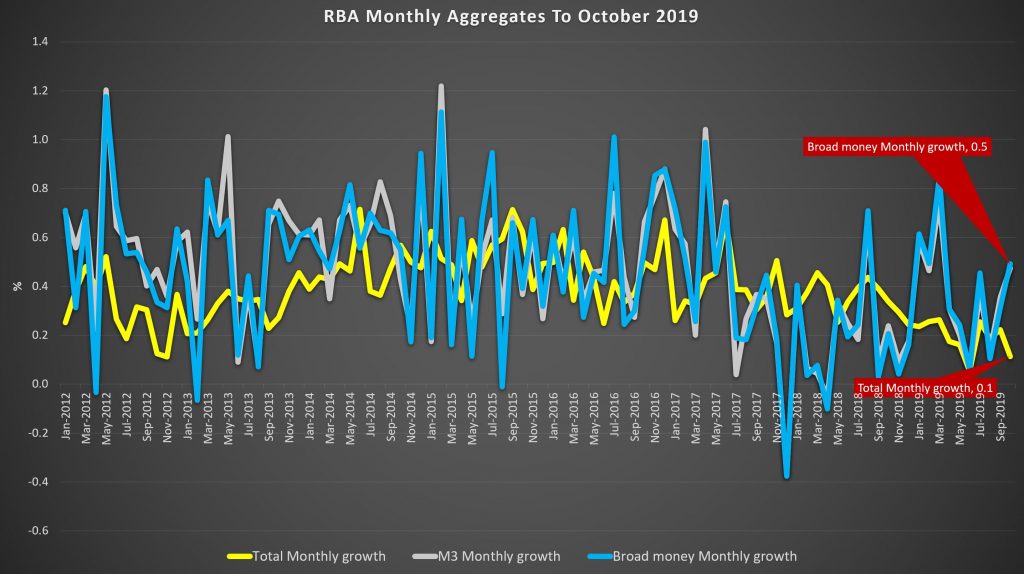
Monthly owner occupied lending rose 0.4% while investor housing lending was flat. Personal credit fell another 0.6% in the month, and business lending was down 0.1%. As a result total credit rose just 0.1%, down from 0.2% last month. Broad money was higher though.
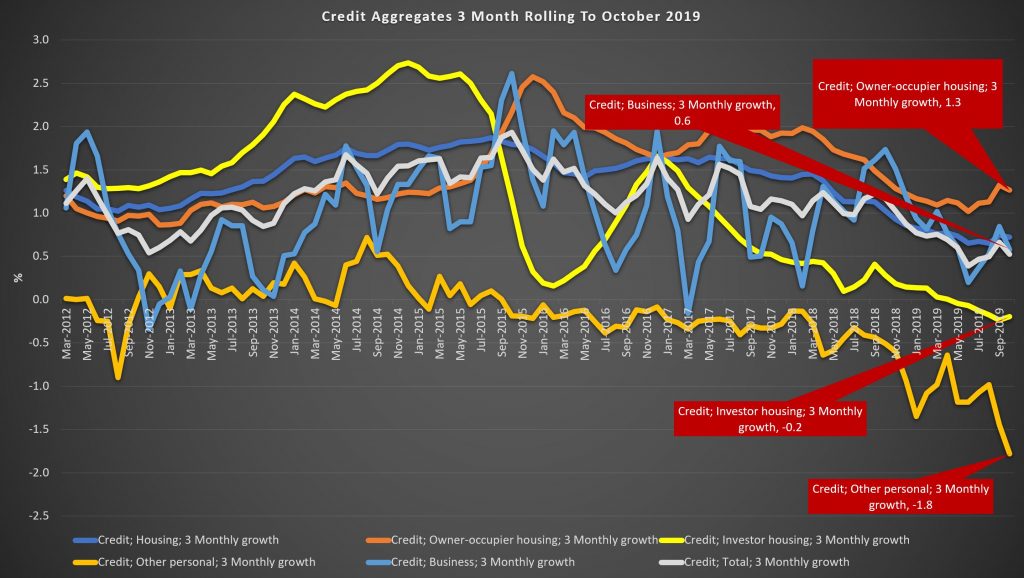
Over a rolling 3 months view, owner occupied credit grew 1.3% while investor credit was down 0.2%, other personal credit was down 1.8% and business credit was up 0.6%.
Looking across the rolling 12 month view, housing credit growth dropped from 3.1% to 3%, with owner occupied lending at 4.8% and investor lending down 0.2%. Business credit was 2.7% higher, and personal credit dropped by 4.7%.
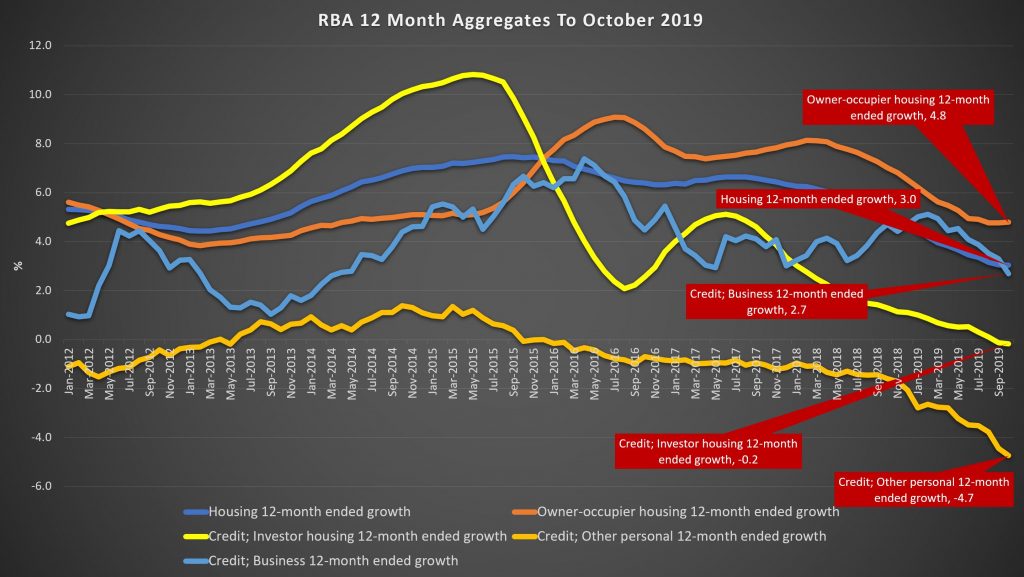
As a result, total credit was just 2.5%, as lower as its been for many years, although broad money rose 4.2%.
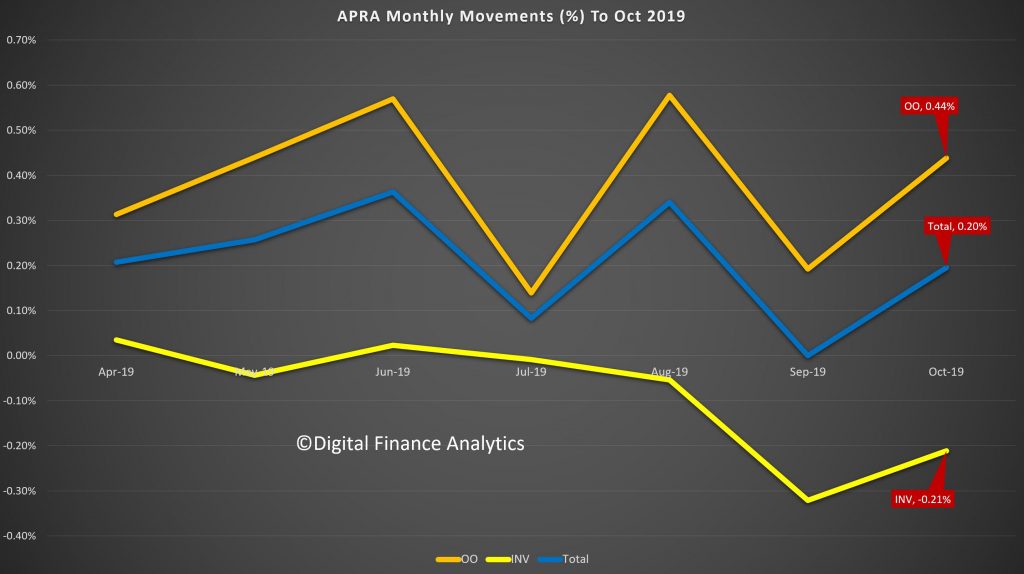
APRA’s new data series continues to contain some surprises. Total lending stock by the banks rose to $1.73 trillion, up 0.2% in the month.
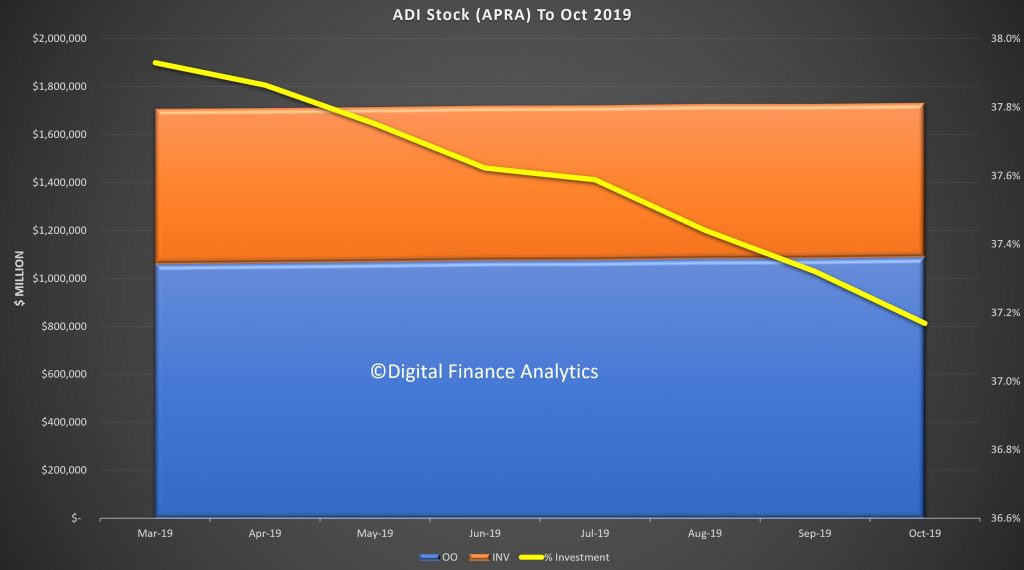
The share of investor loans continues to fall, to around 37.2%, and this is explained by investor loan stock falling by 0.21% in the month, compared with a rise of 0.44% for owner occupied loans. The series still looks a bit weird, so we wonder if there are still reporting issues.
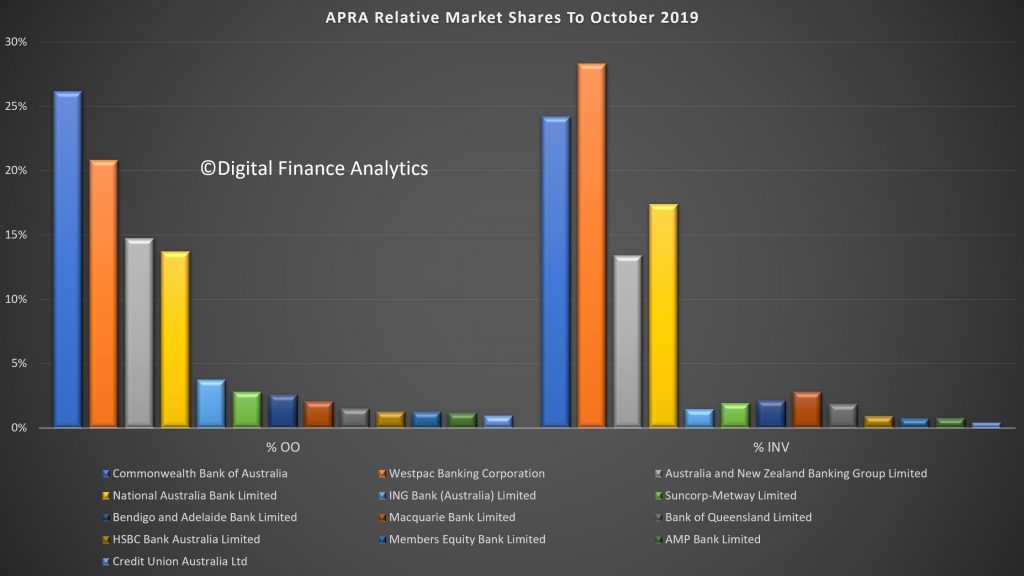
The individual banks stocks of loans varied, with CBA extending their book (consistent with our industry research, as one of the easier lenders at the moment), along with Macquarie – both of which grew both investor and owner occupied pools. NAB and ANZ dropped investor loans, but extended owner occupied loans. But Suncorp and Westpac dropped BOTH investor and owner occupied loan balances (assuming the reporting is correct – lets see if we get a reversal next month).
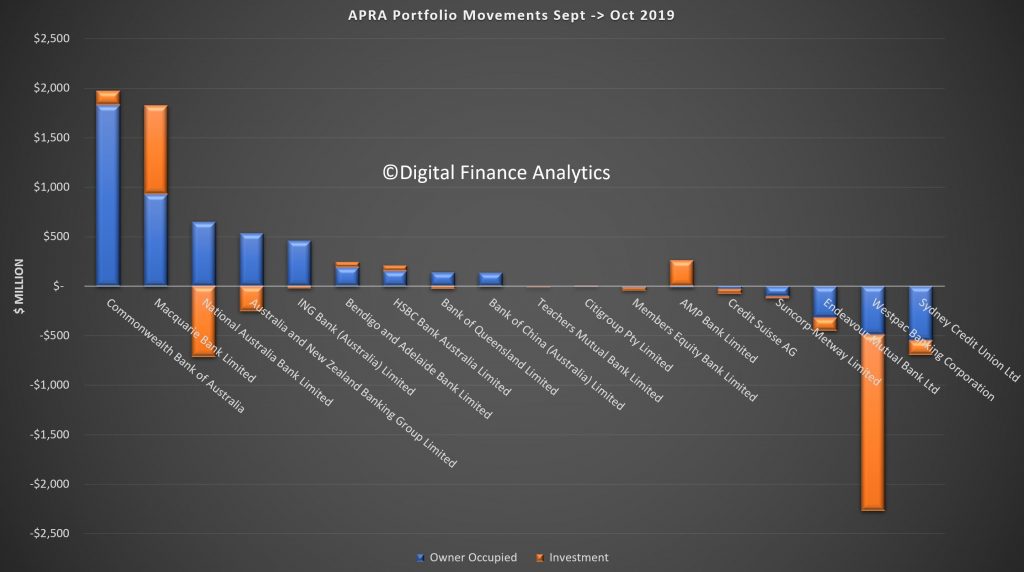
Finally, market shares hardly changed, with CBA the largest owner occupied lender and Westpac the largest investor loan provider.
Given the weak credit growth, this puts into sharp contrast the reported rises in home prices. We know transaction volumes remain low, but our industry contacts indicate a stronger pipeline of applications. Despite this the run-off of existing loans is translating to low net growth.
Even then, loan growth is still strong relative to income growth. But actually the most significant element is the fall in business credit, as more sectors come under pressure.
These results appear to be at odds with the RBA’s glass half full view of the economy, and may indicate more weakness in the GDP out-turn next week.