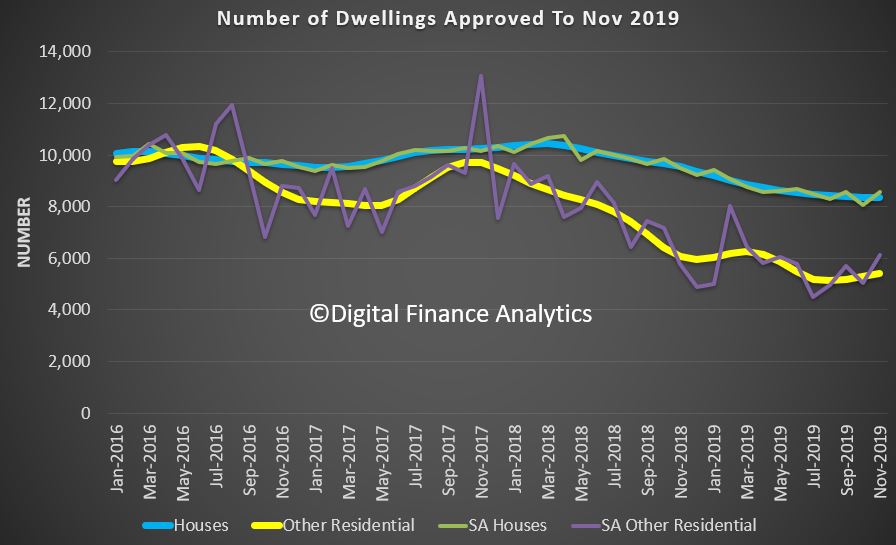
The dwelling approvals data is quite noisy, but the release from the ABS today reported a stronger rise in approvals than might have been expected in November 2019. We continue to report the trend series, as the seasonally adjusted is more volatile.
The trend estimate for total dwellings approved rose 0.8% in November. Within that, the trend estimate for private sector houses approved fell 0.3% while private sector dwellings excluding houses rose 2.9%.

However, the trend estimate of the value of total building approved fell 2.6% in November and has fallen for five months. The value of residential building fell 0.7% and has fallen for nine months. The value of non-residential building fell 5.0% and has fallen for four months.
The trend estimate for the value of non-residential building approved fell 5.0% in November and has fallen for four months.
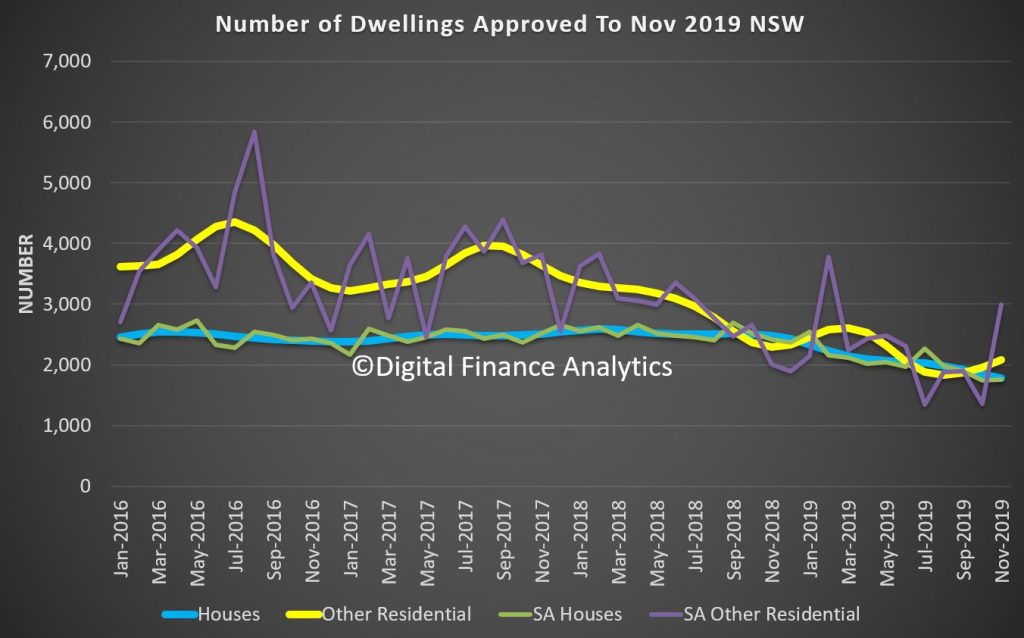
Across the states, trend estimate for total number of dwelling units approved in New South Wales rose 1.6% in November. The trend estimate for the number of private sector houses fell 3.4% in November. In Victoria, the trend estimate for total number of dwelling units approved rose 0.7% in November. The trend estimate for the number of private sector houses rose 0.2% in November. The trend estimate for total number of dwelling units approved in Queensland fell 0.4% in November. The trend estimate for the number of private sector houses rose 1.1% in November. The trend estimate for total number of dwelling units approved in South Australia rose 4.2% in November. The trend estimate for the number of private sector houses rose 0.9% in November. The trend estimate for total number of dwelling units approved in Western Australia fell 1.9% in November. The trend estimate for the number of private sector houses rose 1.5% in November.
So much of the change can be traced to a rise in unit development in NSW.

