
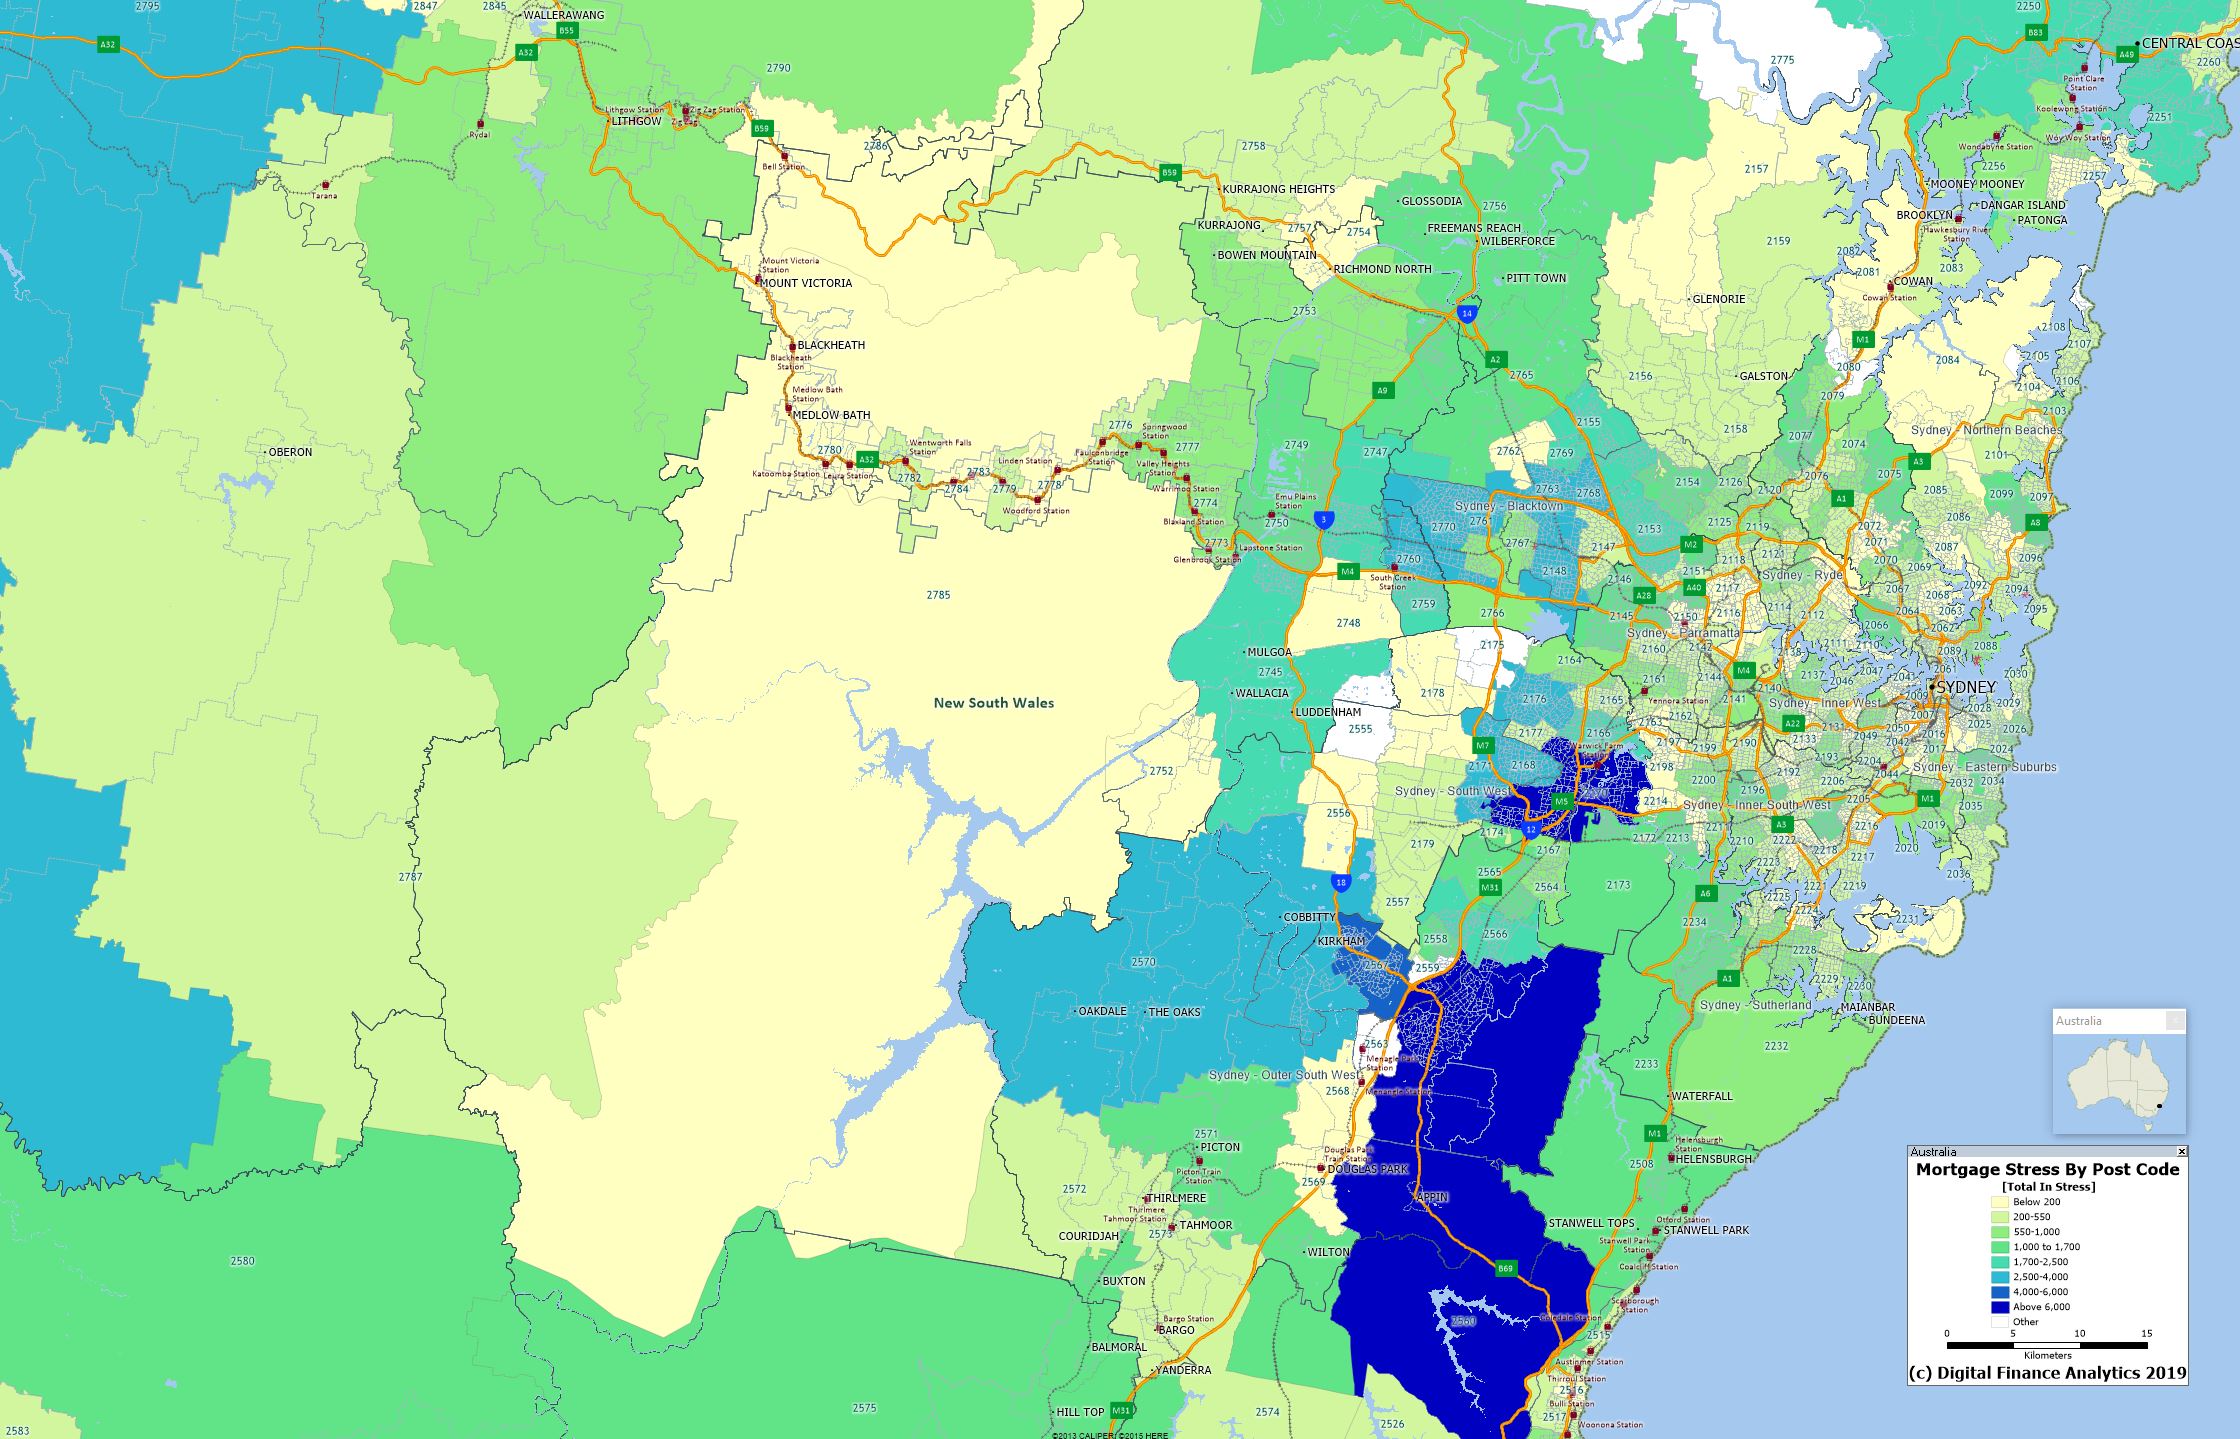
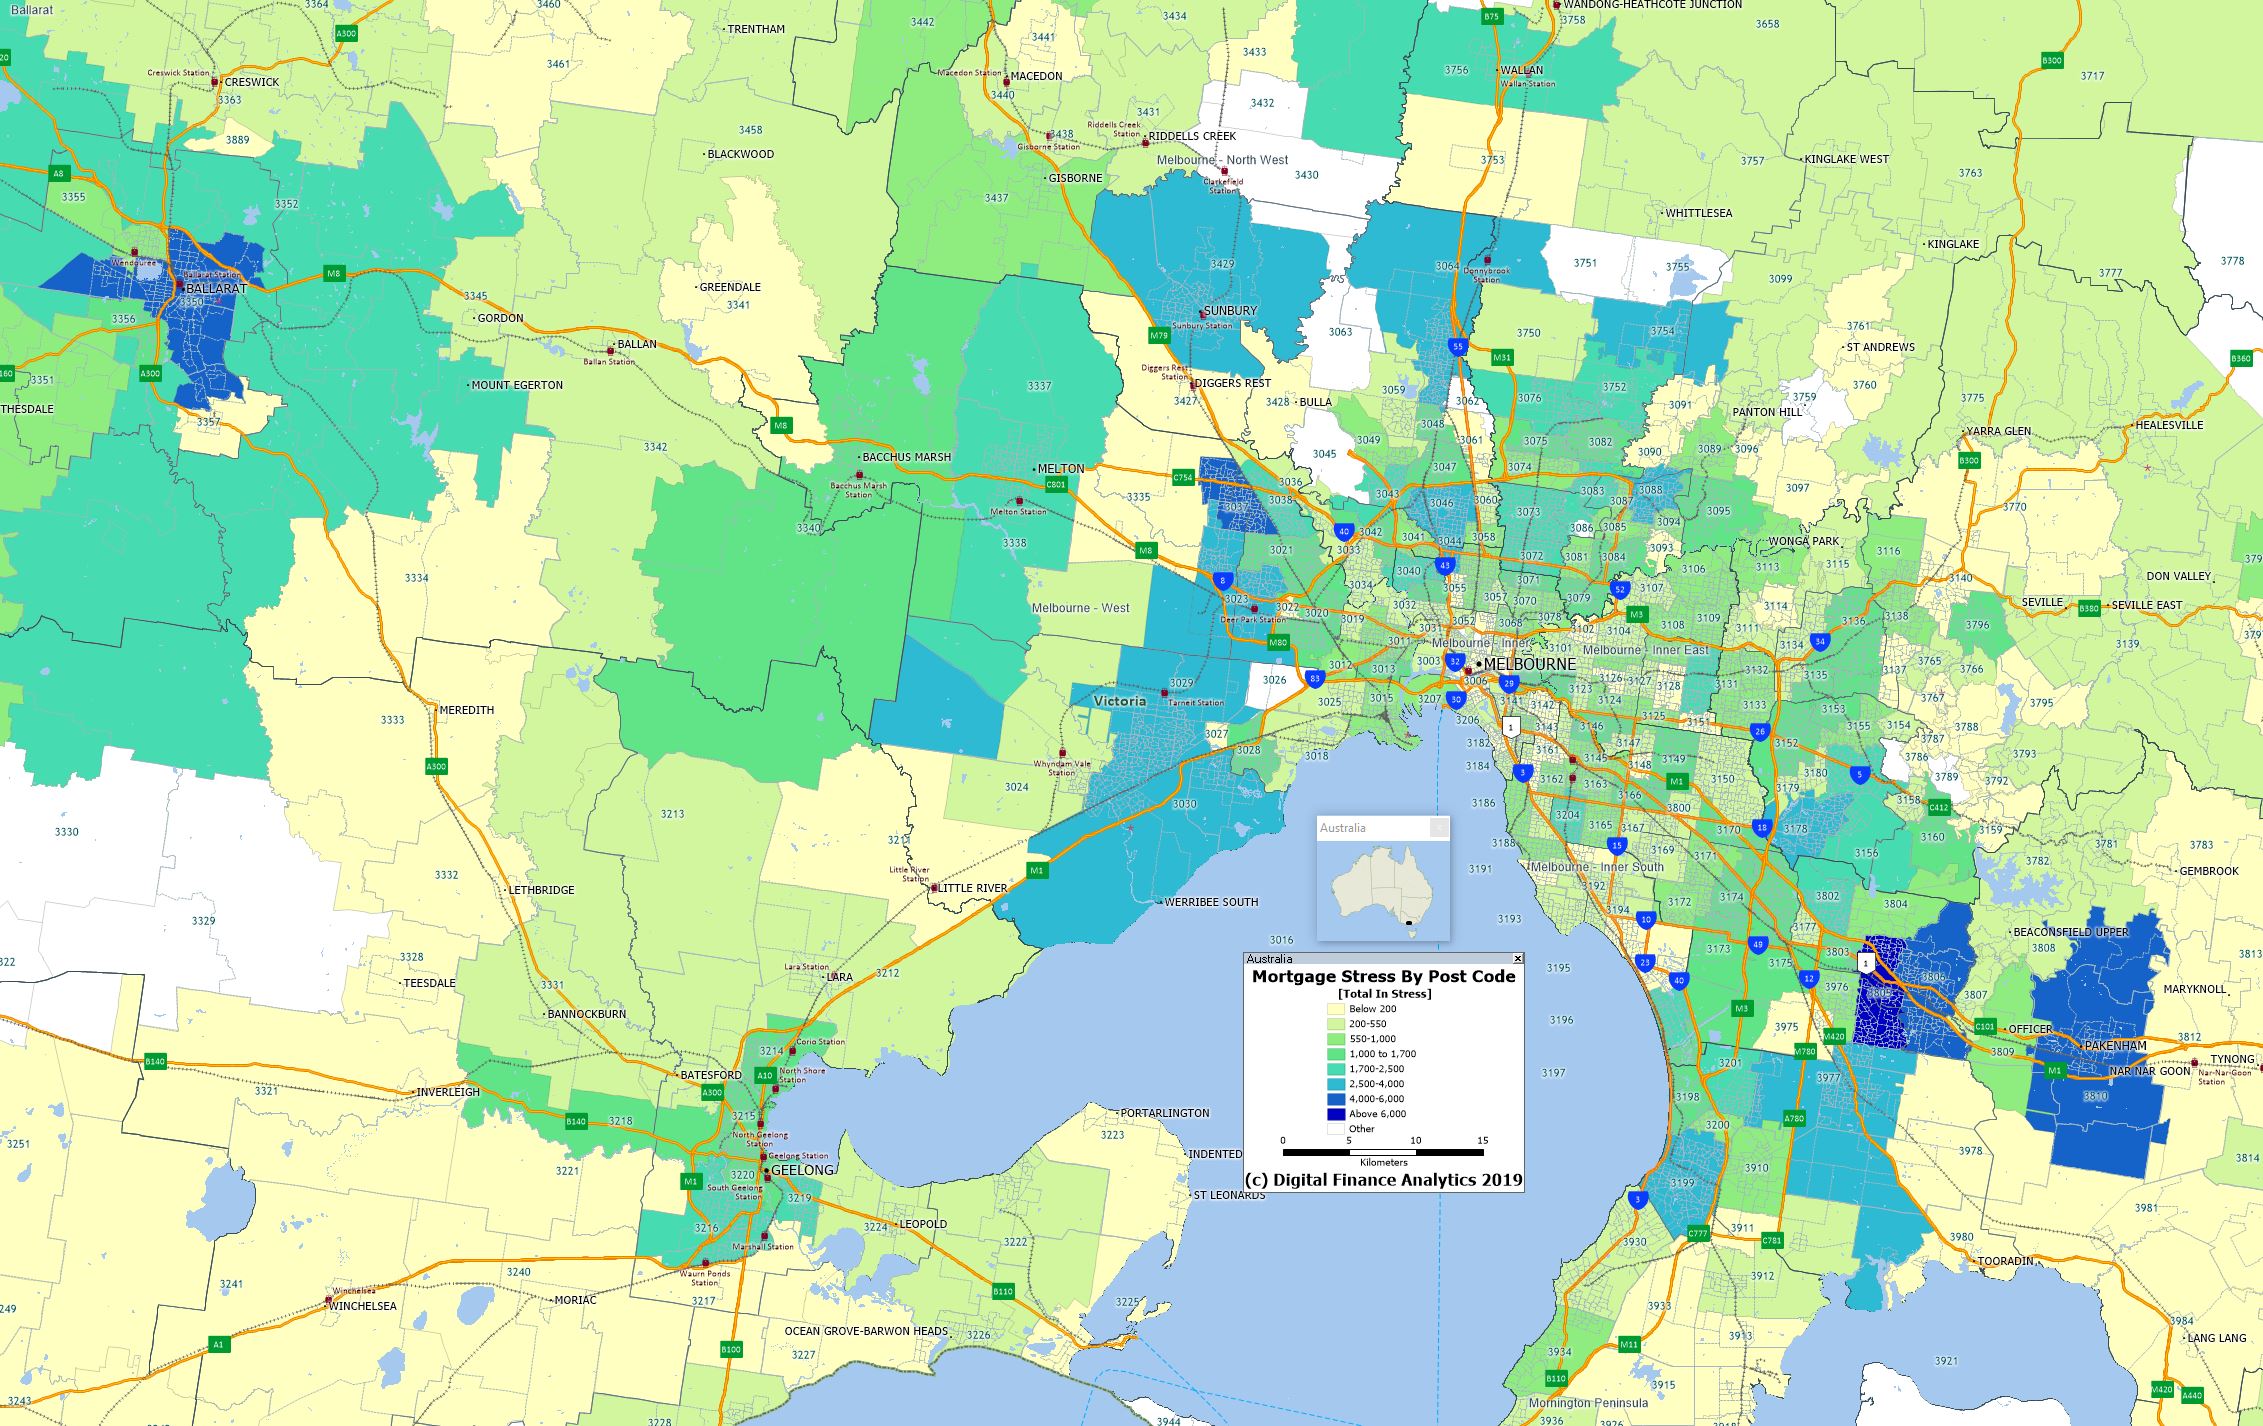
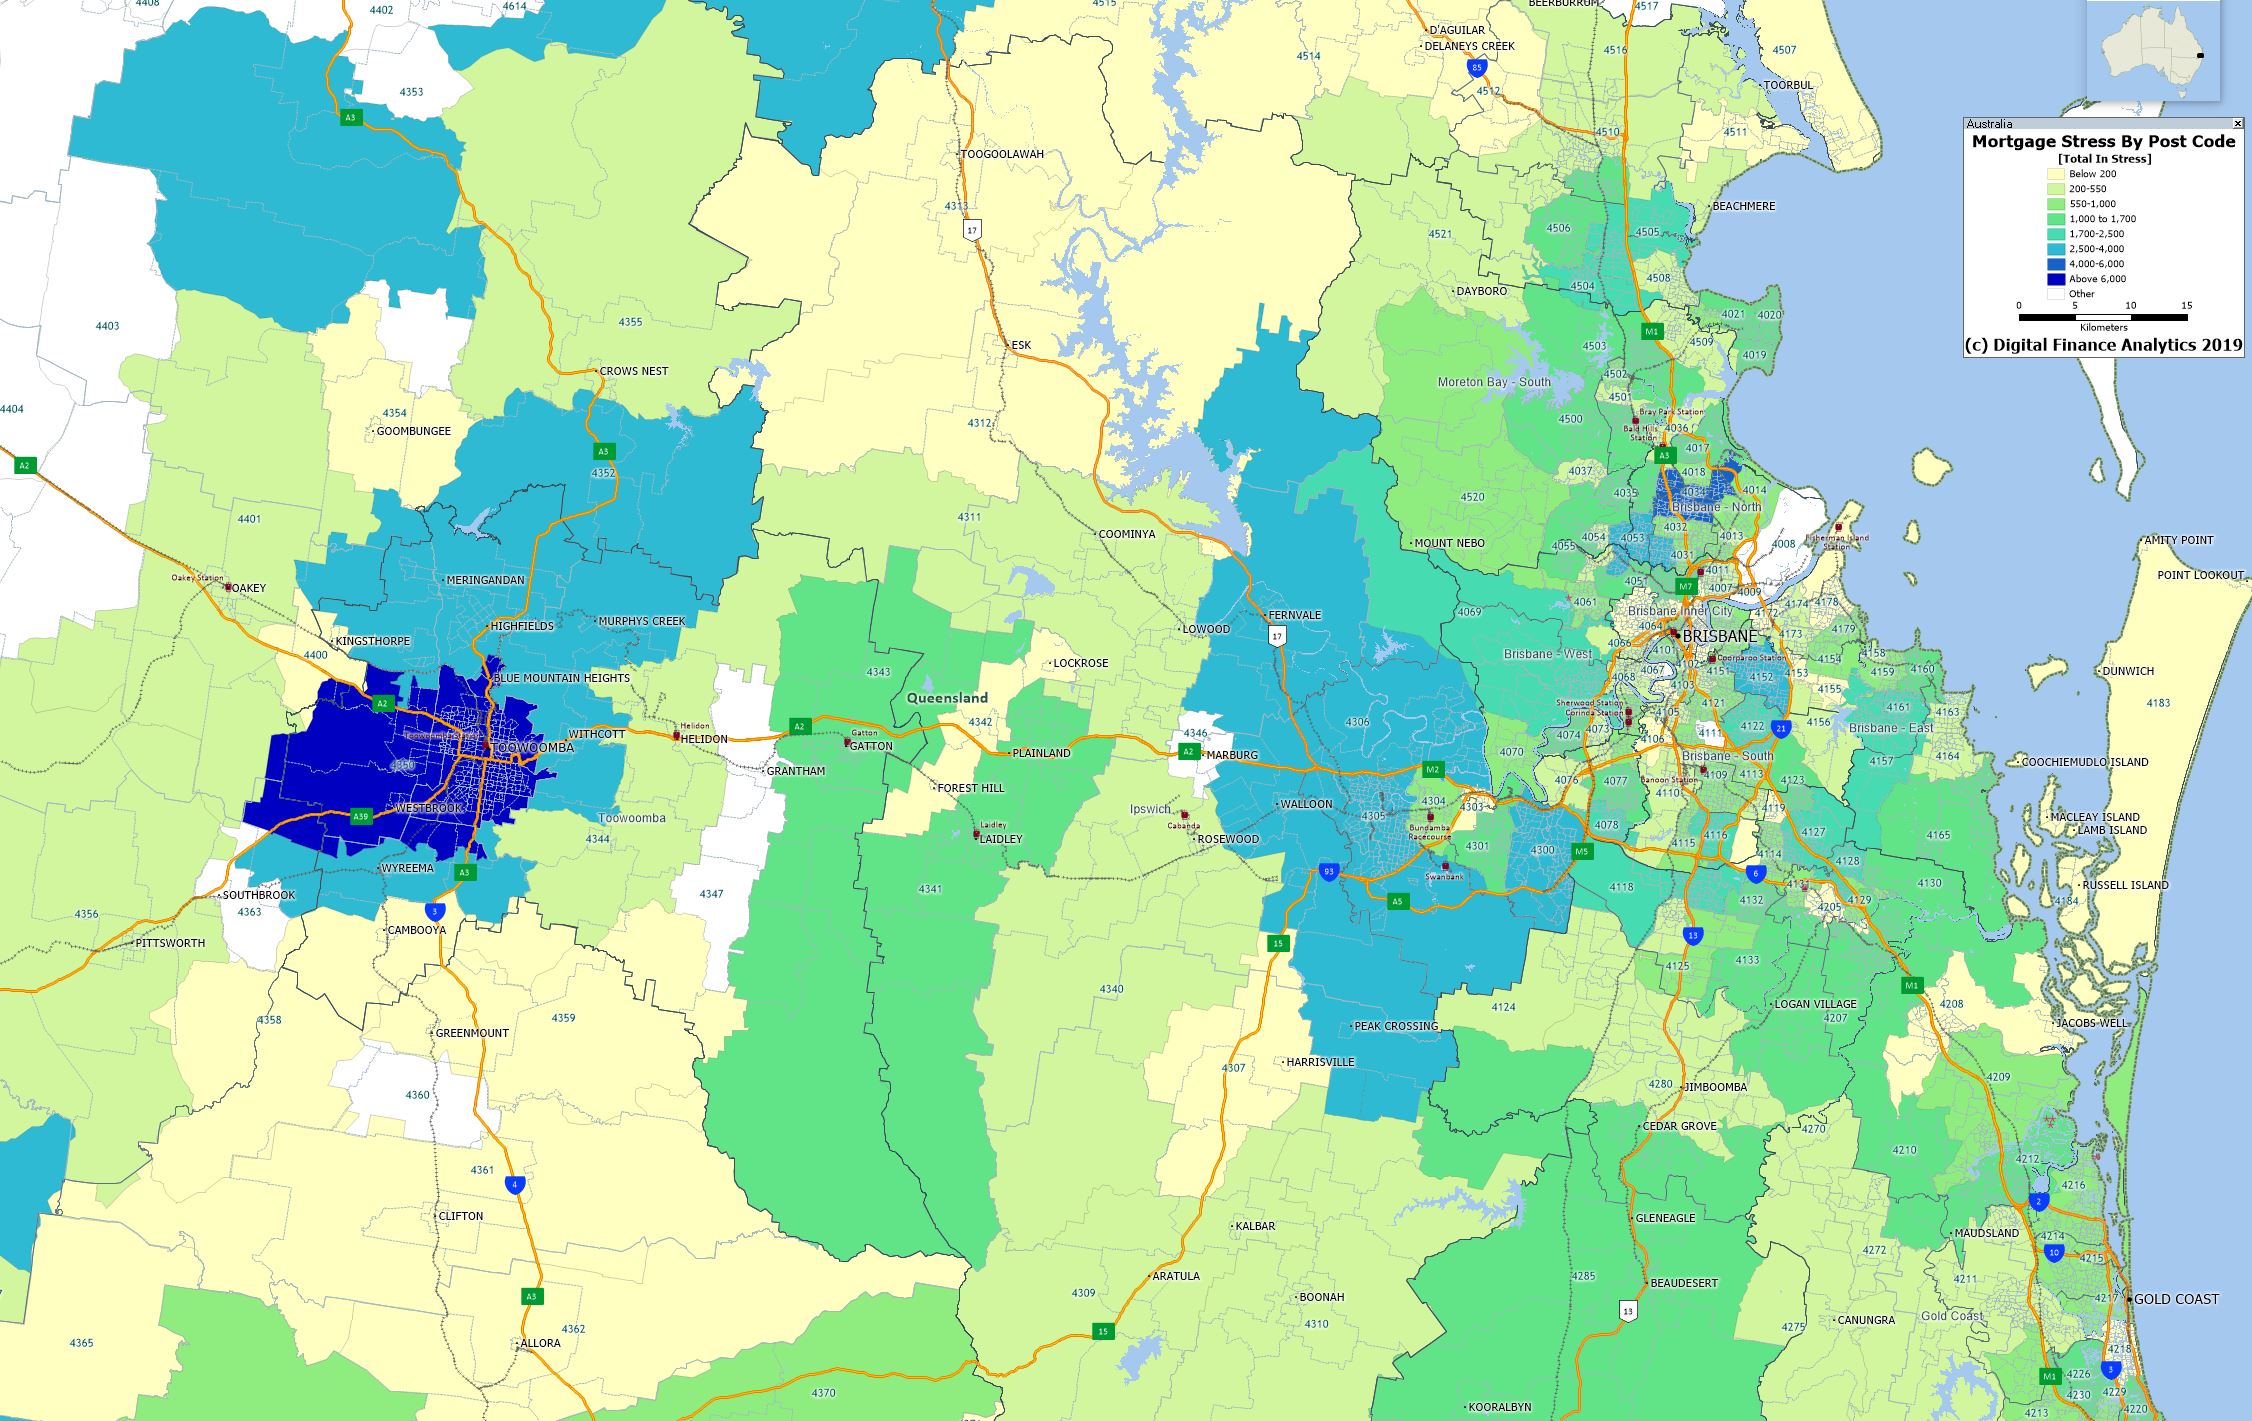
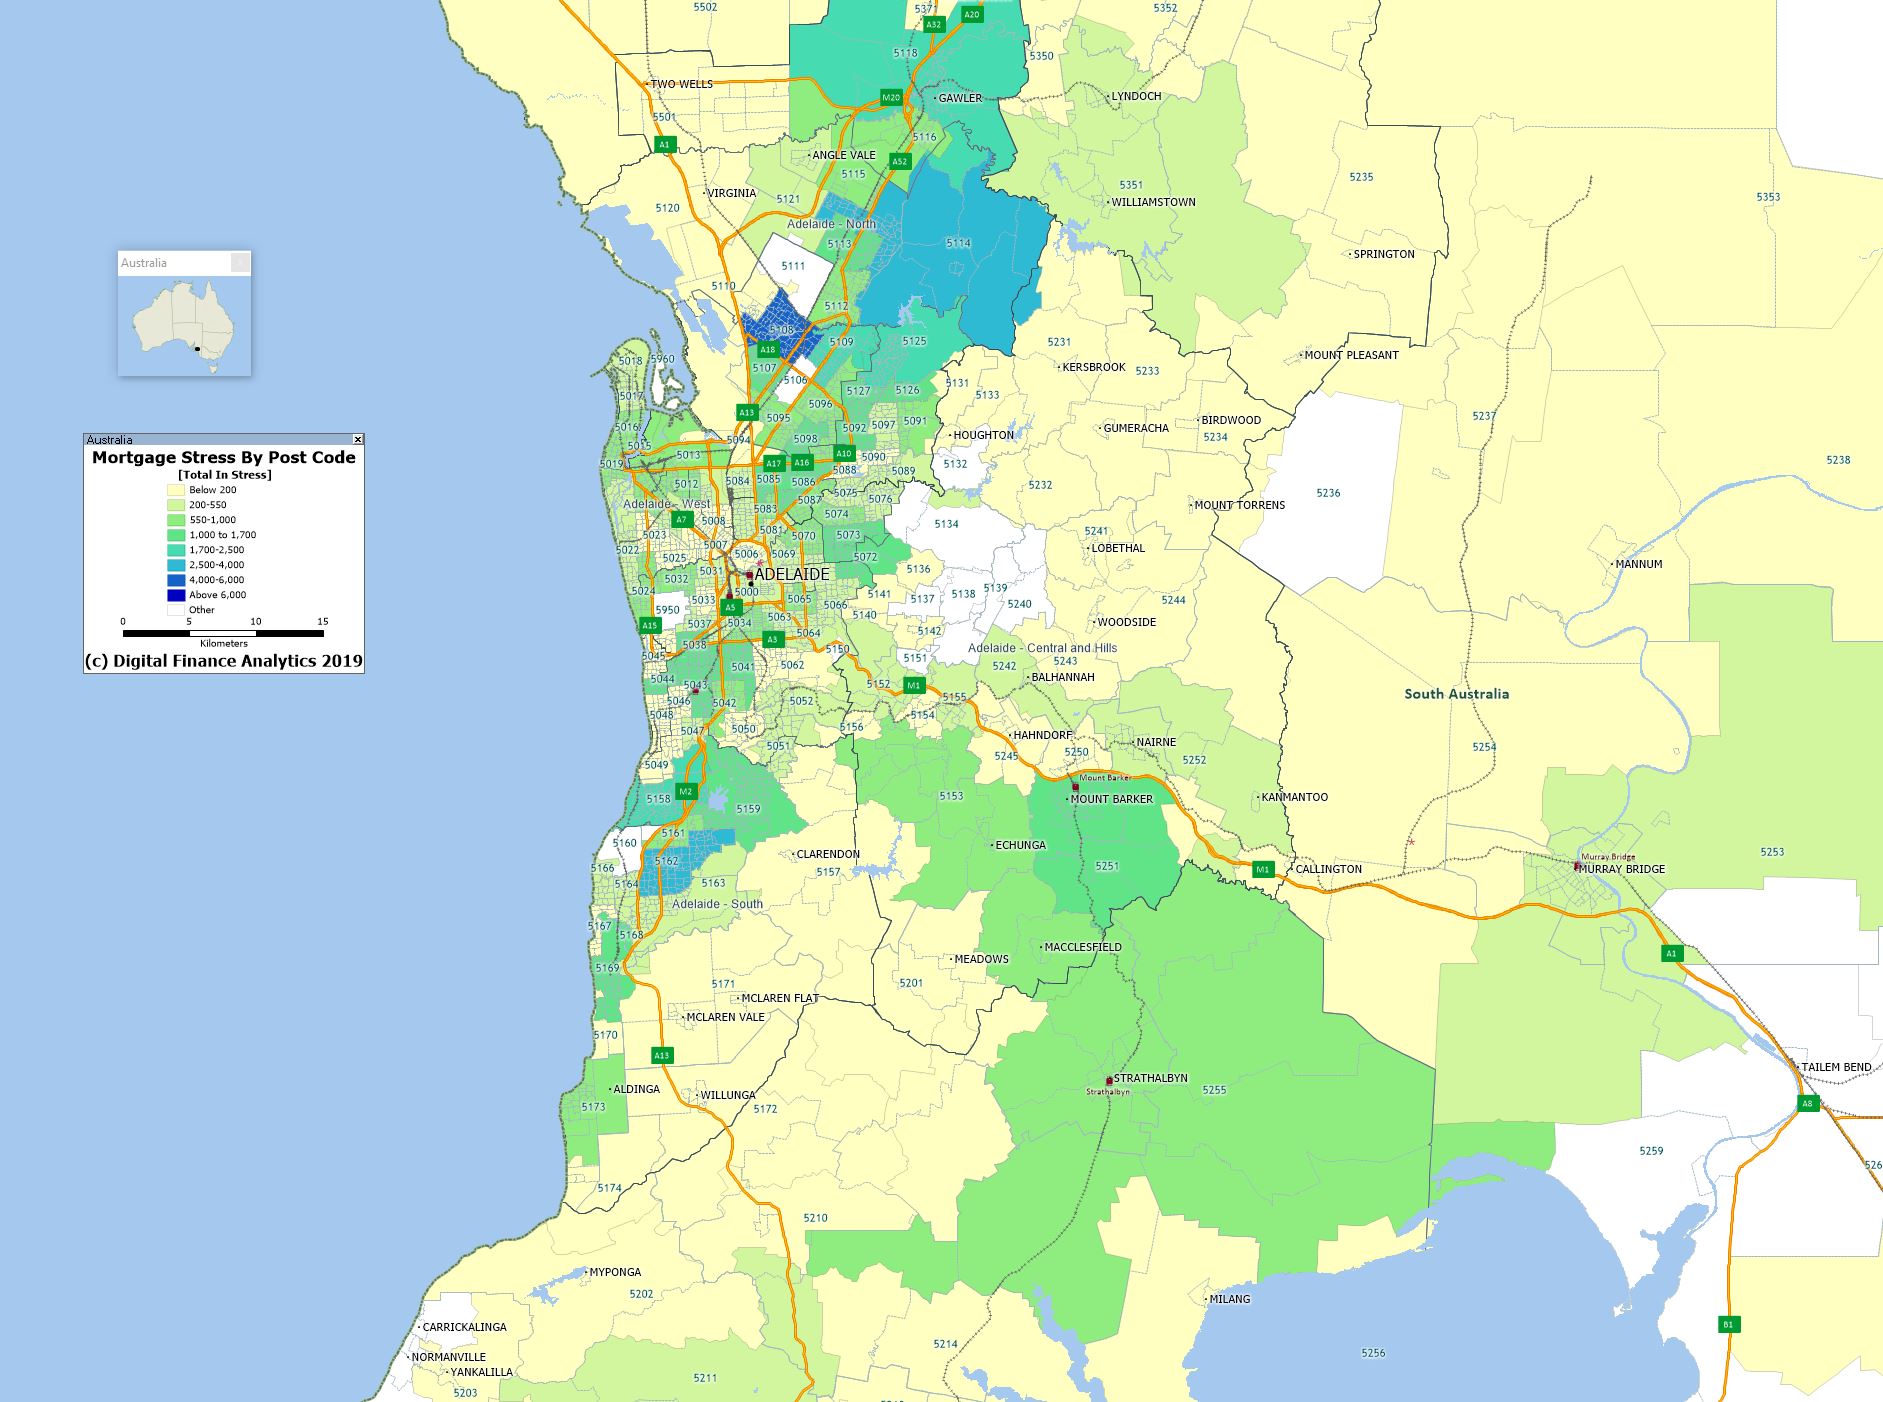
We released a series of updated mortgage stress maps this week. However we received a number of requests for higher resolution versions, which although uploaded were not displayed on some platforms.
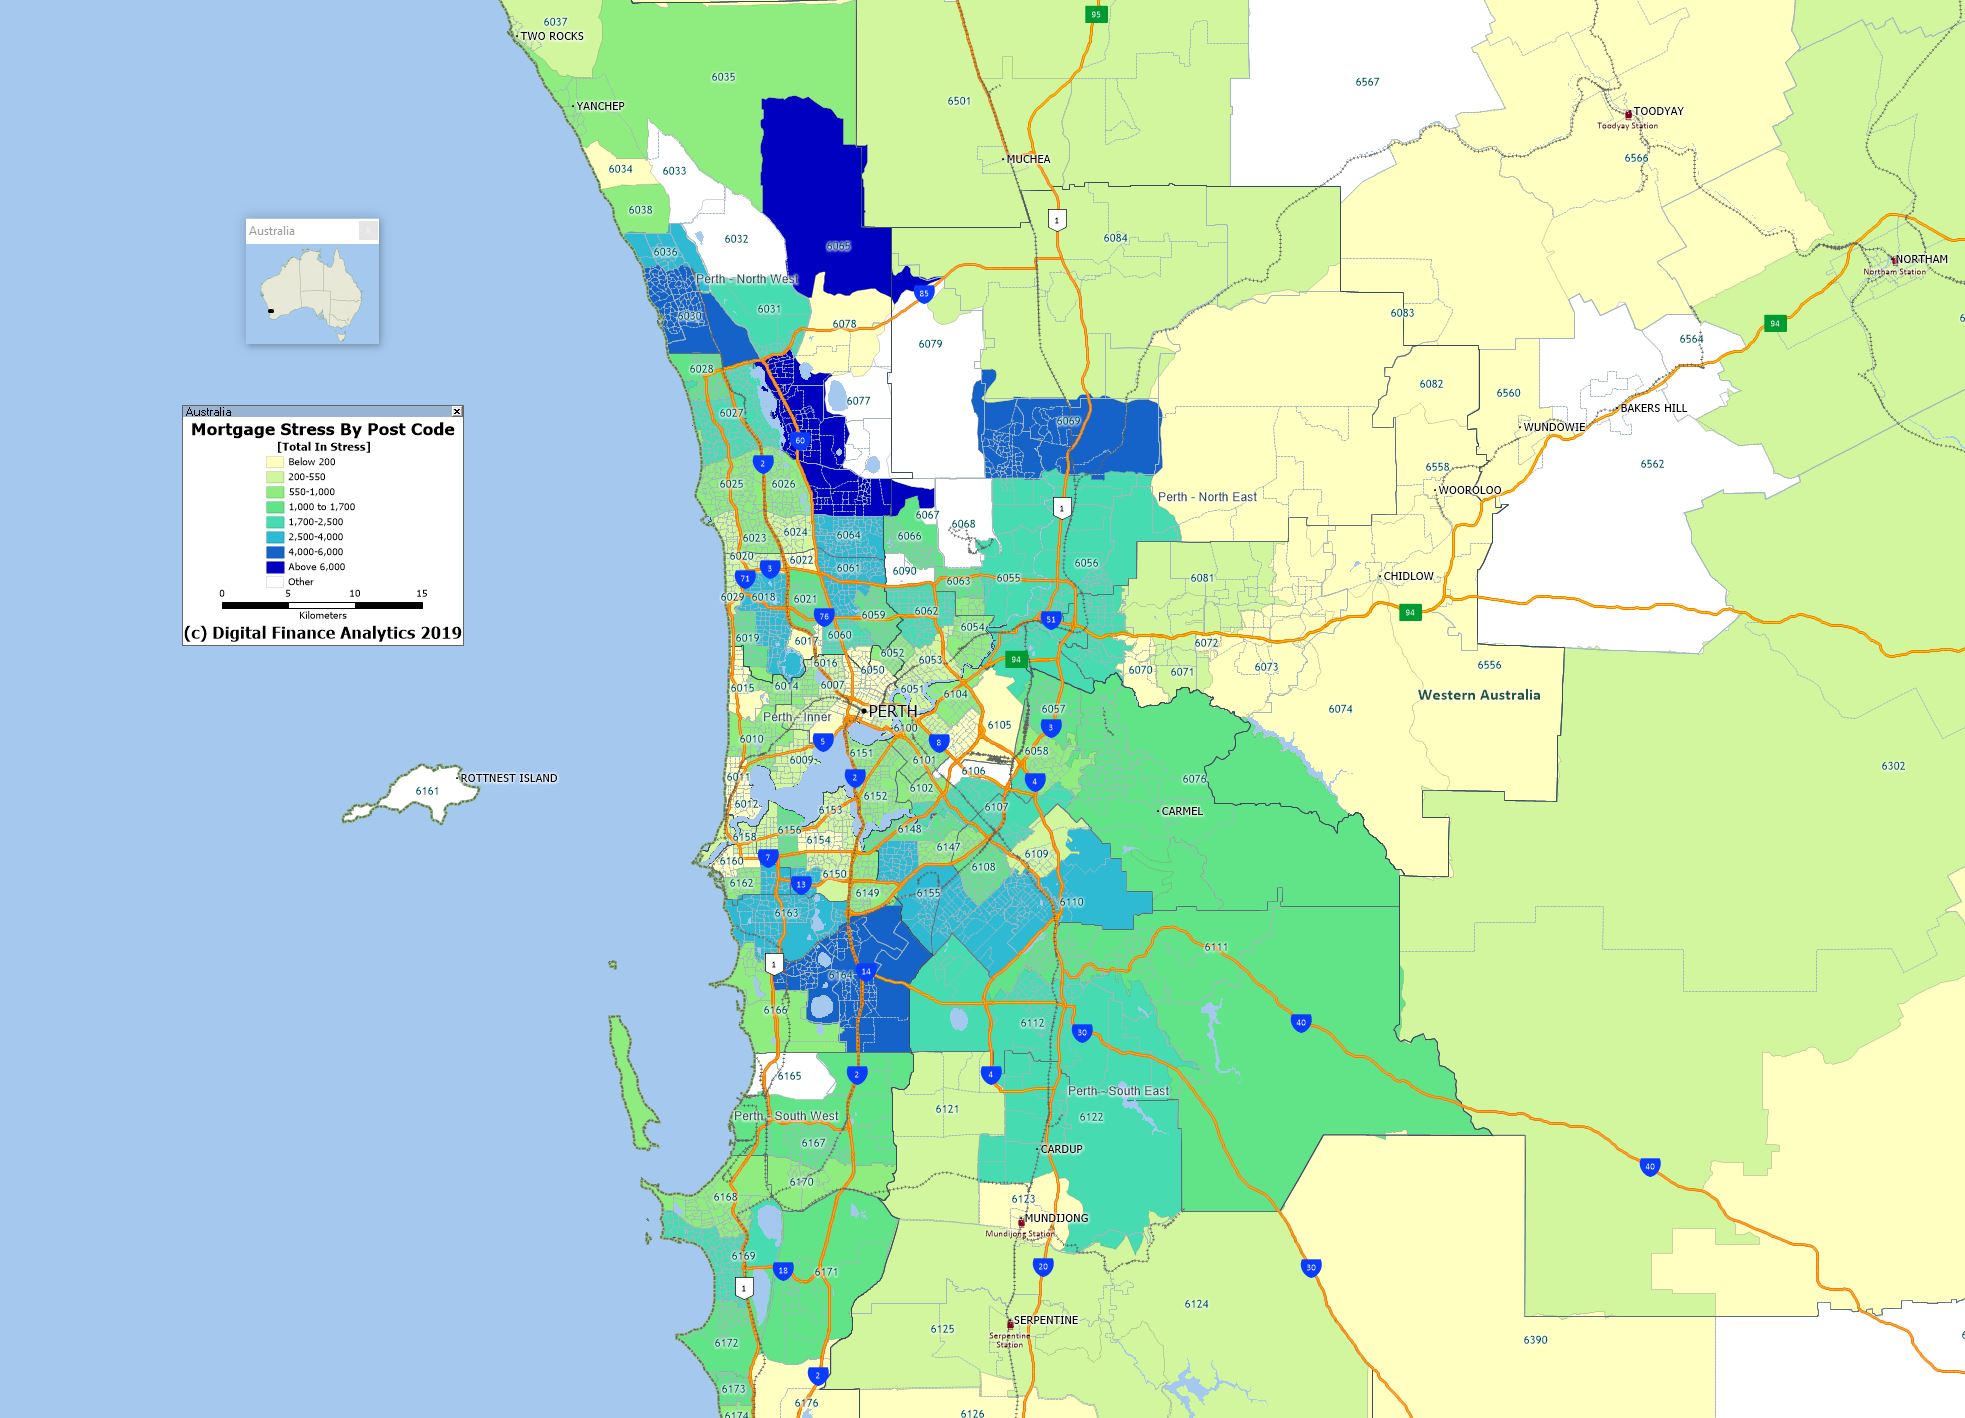
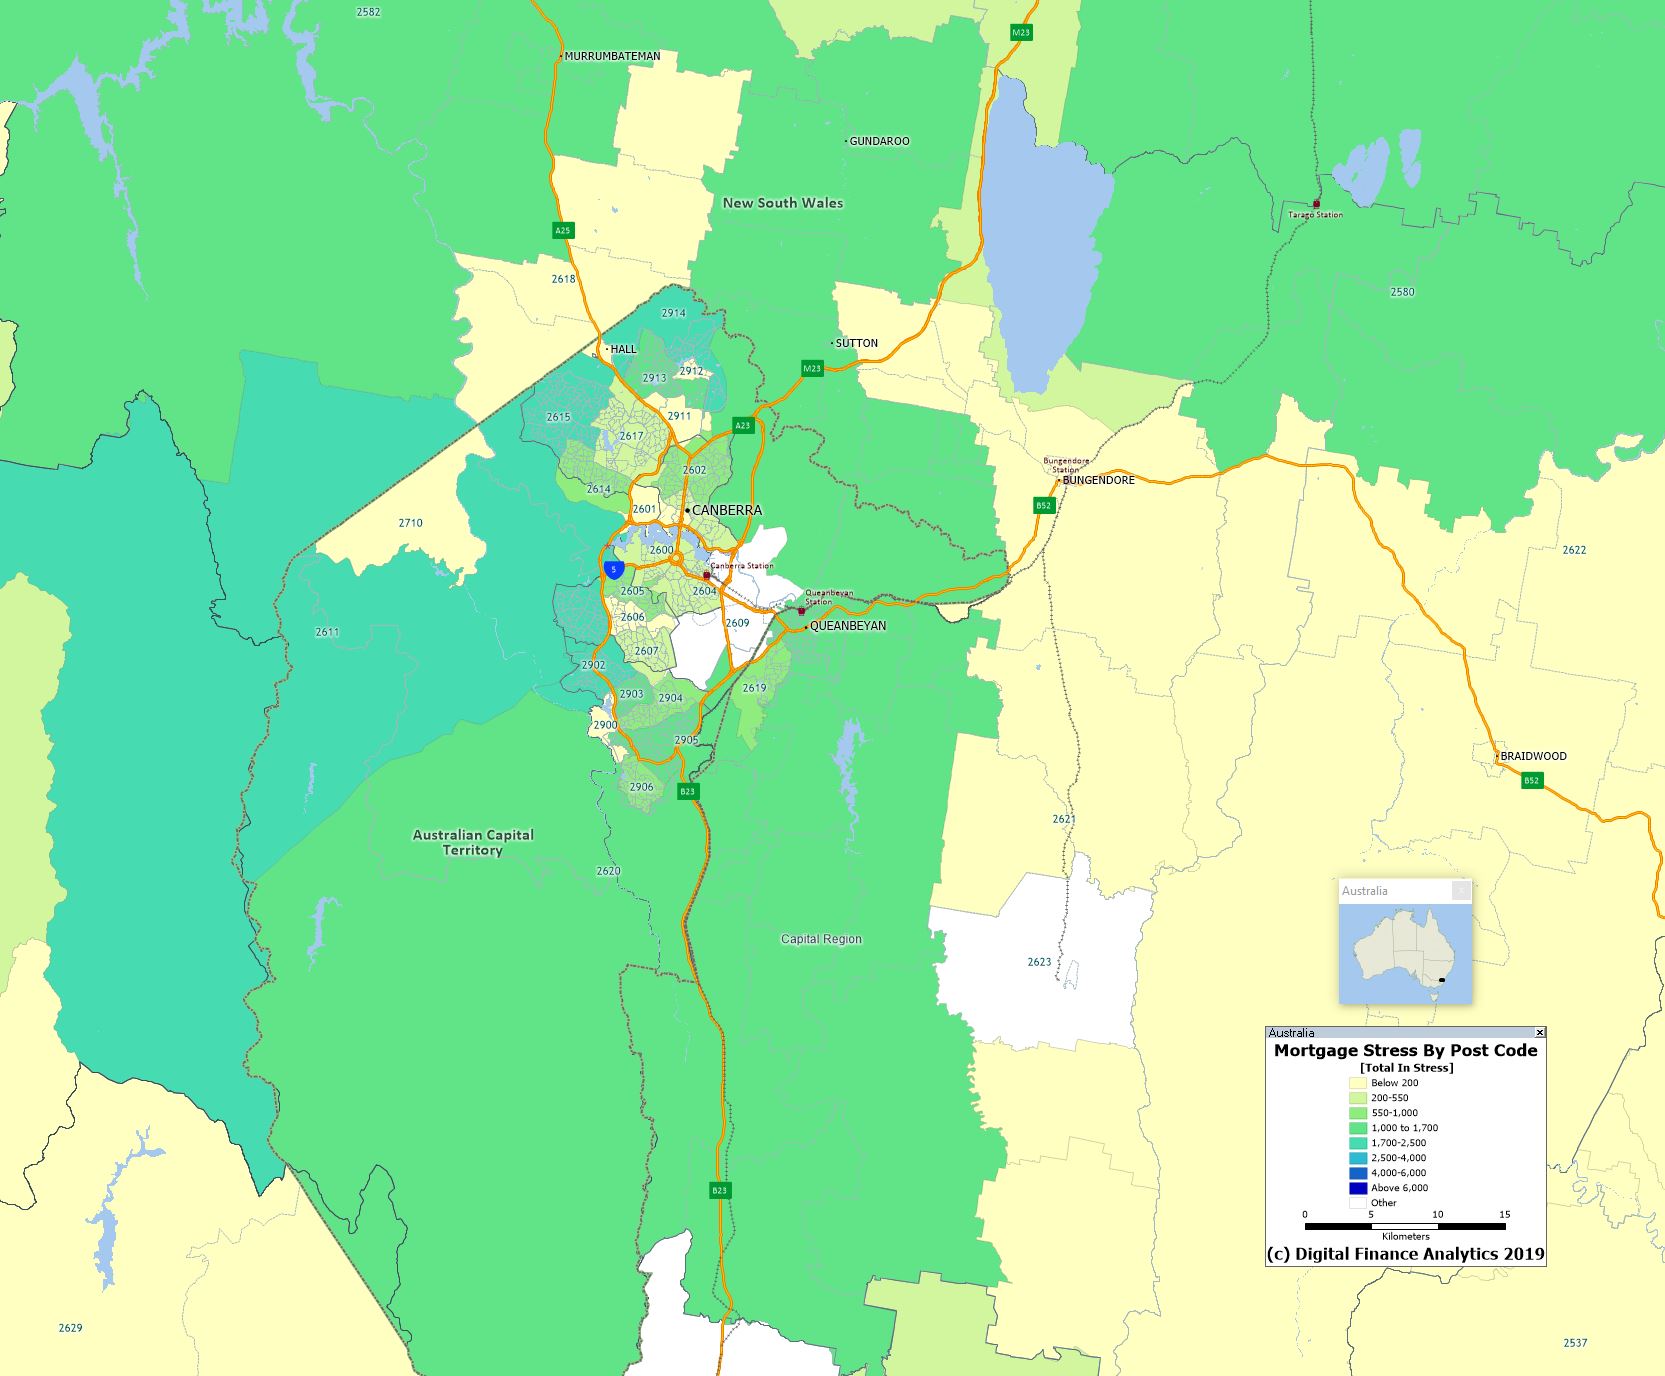
So here are the direct links to the source JPG files. You should be able to view them direct in your browser, or even download them. They show the heat maps in each region.
It transpires that the latest version of our blogging platform will, in some circumstances, serve the lower resolution alternatives.
Mr. North,
– Thanks for posting these high resolution maps.
– Can you also post the lists (plural) with the postcodes in mortgage stress in high resolution ? The lists you posted earlier were a bit difficult to read.
Yes, will do later…