
As we continue our journey into the depths of home loan segmentation analysis, using LTV, DSR and LTI ratios, we begin to see some insightful patterns emerging. Today we delve into our deep segmentation models.
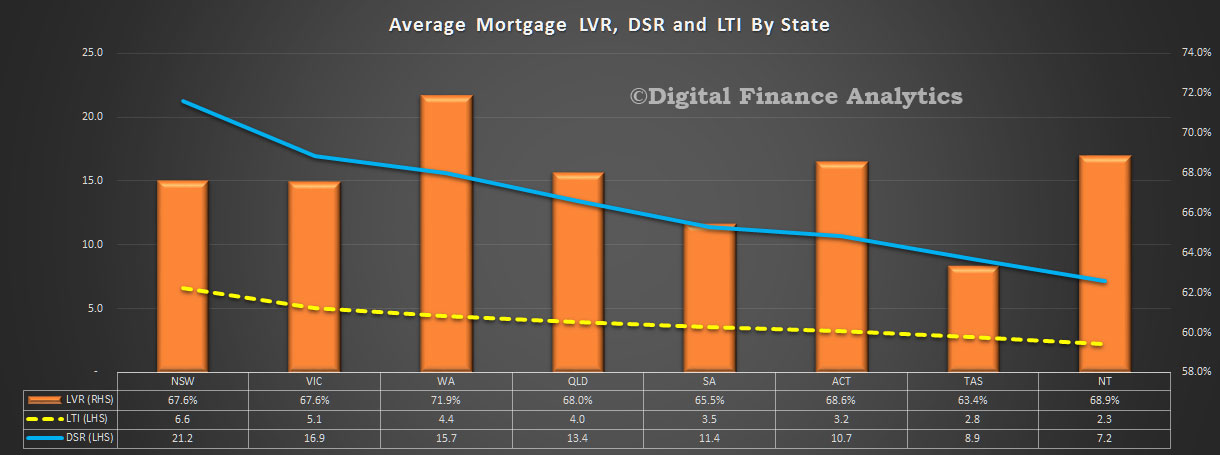
We start by looking across the states and have sorted the results by DSR (Debt Servicing Ratio), as this is the most insightful lens, in our view. Households in NSW have the highest DSR, no surprise perhaps because home prices have risen strongly – so mortgages have grown – at a time when incomes have not. Remember DSR is based on current low interest rates, should they rise, the DSR will also raise. NSW also holds the prize for the highest average Loan to Income ratio, again because of the rise in market values, and mortgages. However, the average Loan to Value ratio is sitting at around 68%, compared with 72% in WA. DSR and LTI are the better indicators of potential risk, compared with LVR which only really comes into play as a factor if trying to sell into a downturn.
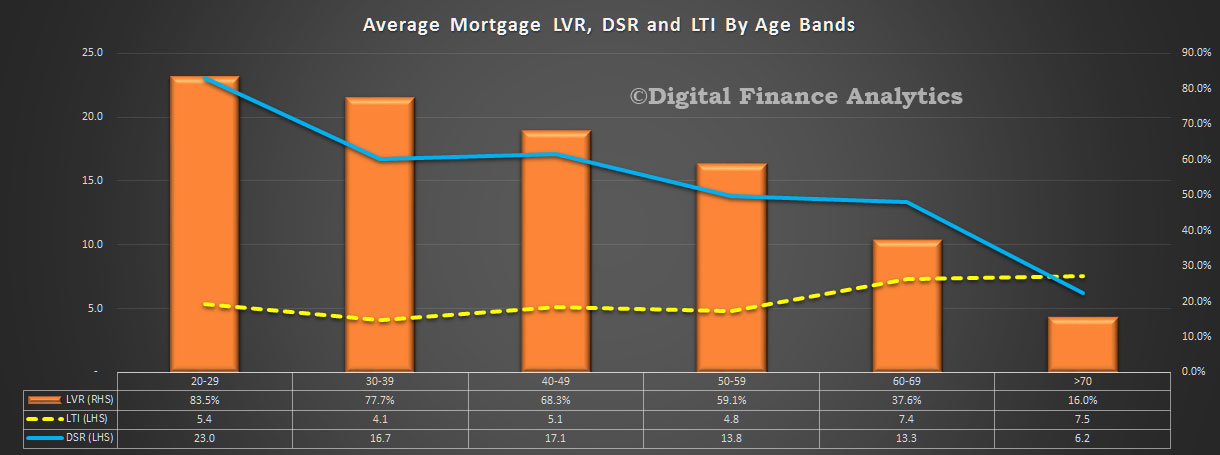
 Next we look at age bands. Younger households have on average higher DSR’s, and LVR’s. But it is worth highlighting that the highest LTI’s are residing in older households, because here whilst LVR’s are lower, limited incomes mean they are more exposed. We are seeing a significant rise in the number of households who still have a mortgage to pay off as they enter retirement.
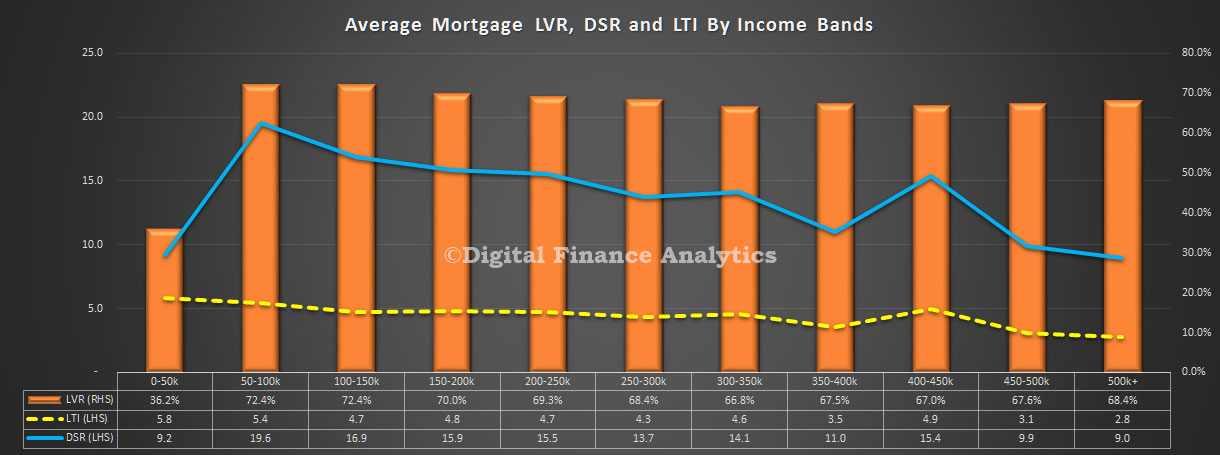
 If we look at the picture by $50k income bands we see that the highest LVR’s, LTI’s and DSR’s rest with households whose income is in the range $50-100k. Interestingly, LVR’s do not vary that much by income band, but both LTI’s and DSR’s improve with income. This is because more wealthy households are able to buy more expensive property, and service larger loans. Remember these cuts tell us nothing about the relative number of households or loans in each income band.
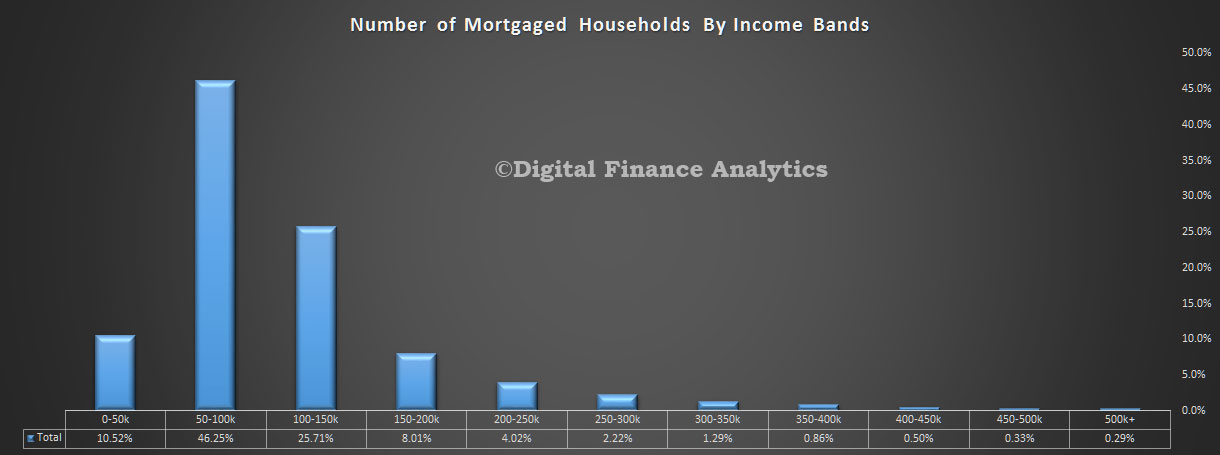
 That analysis shows more than 46% of households with a mortgage have an income of $50-100k, and 26% have an income of $100-150k, whereas only 0.29% have an income of over $500k.
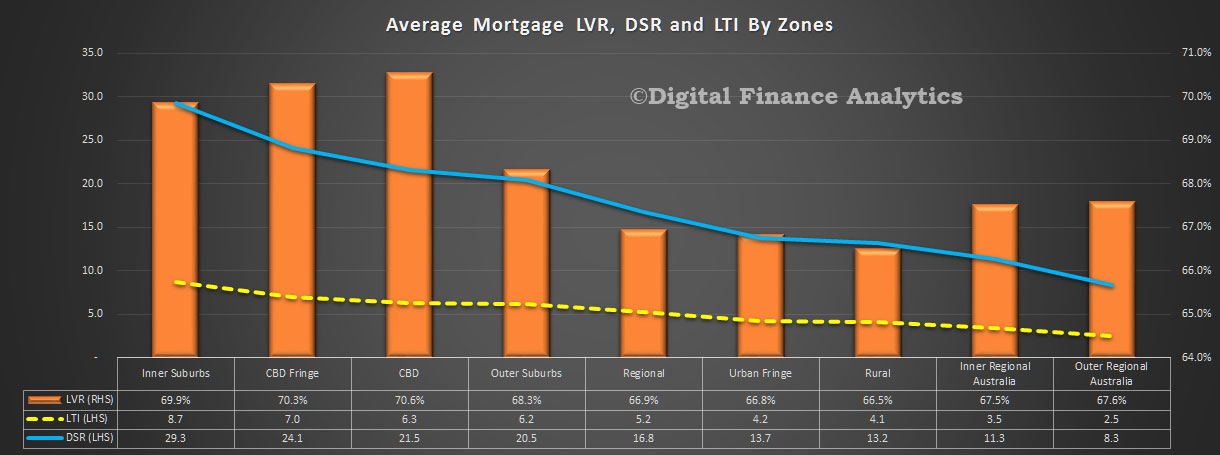
 Turning on our zonal segmentation, we see that households living in the inner suburbs have the highest DSR. This is because home prices are higher here, compared with outlying areas. Households in the regional and rural areas tend to have, on average, lower DSR, LTI and LVRs.
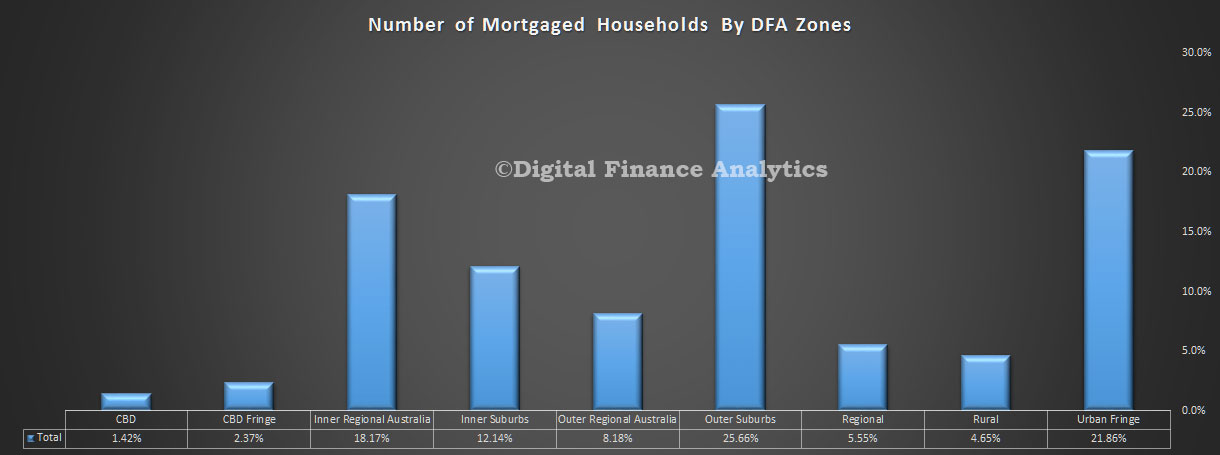
 More than 12% of households live in the inner suburbs, compared with 26% in the outer suburbs and 22% in the urban fringe.
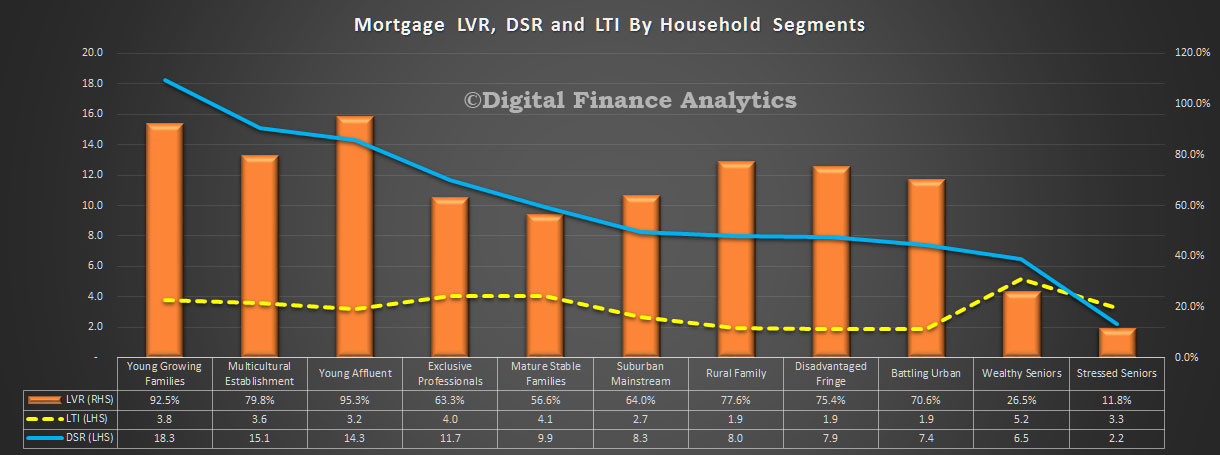
 So to our master household segmentation. We use this to separate households based on a range of demographic indicators – which have proved reliable over many years. Young Growing families have the highest DSR (18.3) and the highest LVR (92.5%). Many have bought quite recently and are leveraged to the max. It is worth looking at the various measures across these segments as there are some fundamentally different things in play with different risk outcomes and sensitivities.
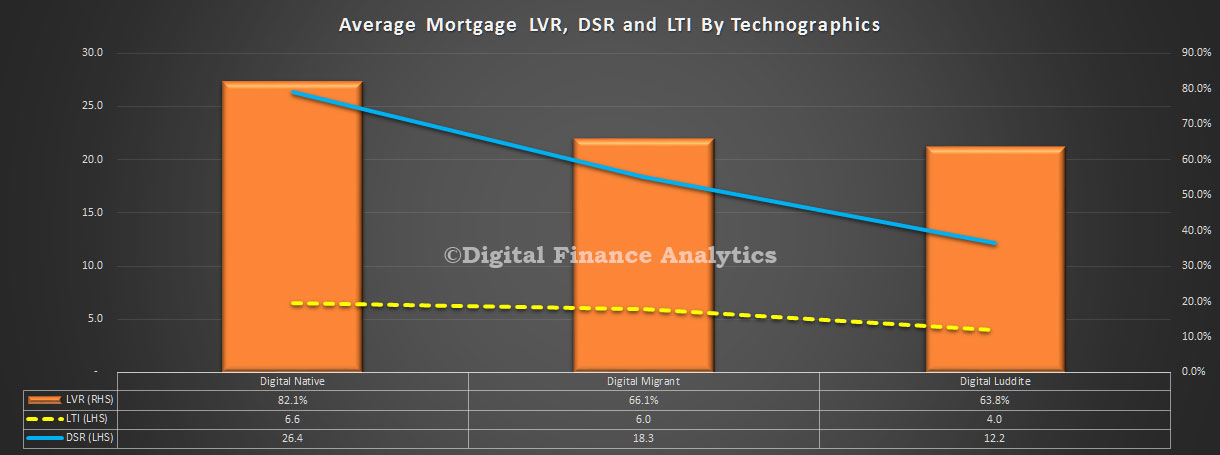
 Finally, for today we look at the data through the lens of our technographic segmentation. We classify households into digital natives, migrants and luddites. The descriptions are self-explanatory, in that natives have always been digitally aligned, whereas migrants have adopted digital channels and luddites are resisting. Interestingly, natives have a higher DSR, LVR and LTI, compared with the other segments. This is because on average they are younger, and more likely to be in the main urban areas.
Such segmentation is important because Fintech’s need to understand where their potential markets are. We featured uno yesterday, a relatively new digital alternative to brokers. Digital natives would be directly in their sights.
 Next time we will look at DSR, LVR and LTI by individual lenders – there are some interesting variations.
One thought on “Home Loan Insights From Deep Segmentation”