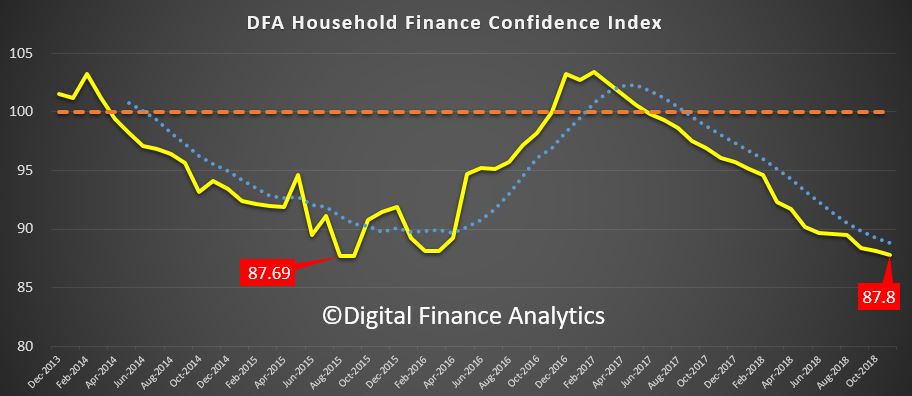
DFA has released the final dimension from our household surveys to end November 2018, zeroing in on financial confidence. As is perhaps predicable, the overall index fell again, down to 87.8, well below the neutral setting, and close to the record low we measured in 2015.
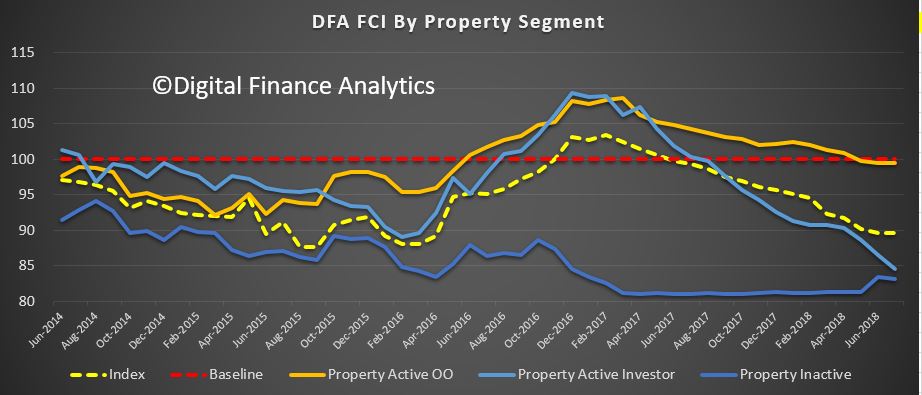
Property owning household segments continue to react to the changed environment, as prices weaken, and mortgage availability tightens. Around half of all mortgage applications are being rejected due to the tighter conditions. Property investors are now very concerned about their financial status, and owner occupied households confidence continues to drift lower. That said, those not owning property – who are renting or living with family or fields are still even less confident so it is still true that property ownership bolsters financial confidence.
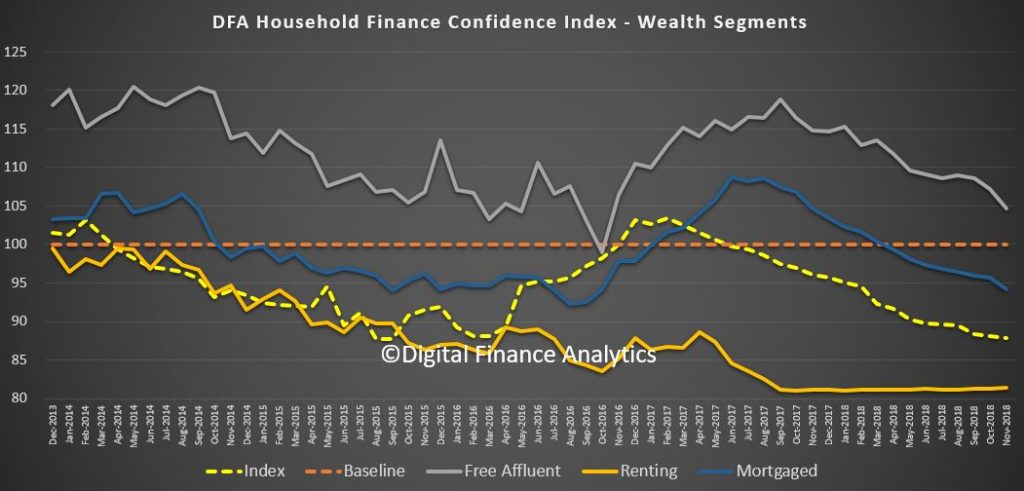
One way to understand the confidence dynamic is to look at households in terms of their mortgage commitments. Property owing households without a mortgage – about one third of all households – remain more positive than those with a mortgage and those renting. These more confident households are more affluent, often with market investments, and multiple income sources. Nevertheless, even these households are becoming more disenchanted with the state of things.
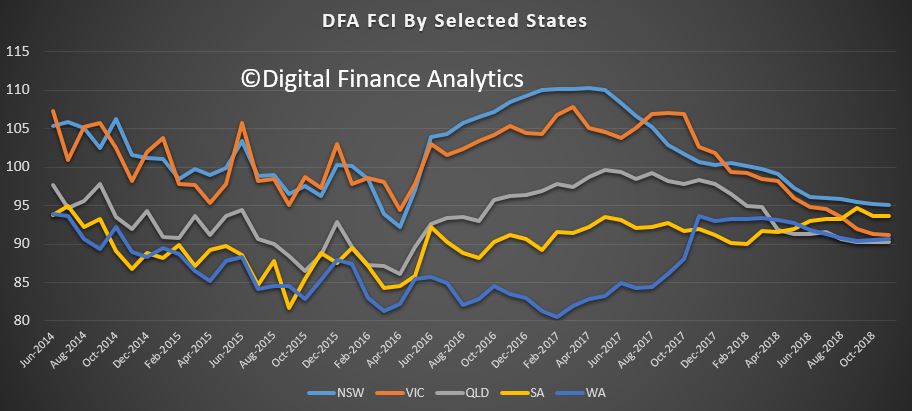
Across the states (we select the most populated in this analysis), we see a bunching of confidence scores with Victoria slipping towards Western Australia and Queensland, although New South Wales continues to slide a little too. South Australian households are sitting between New South Wales and Victorian households in terms of average confidence.
The age bands continue to show significant separation, with younger households more concerned (thanks to costs of living and large mortgages) relative to older households, many of who have smaller mortgages or no mortgages and larger asset bases. That said, those moving into retirement are less confident compared with those who are still working.
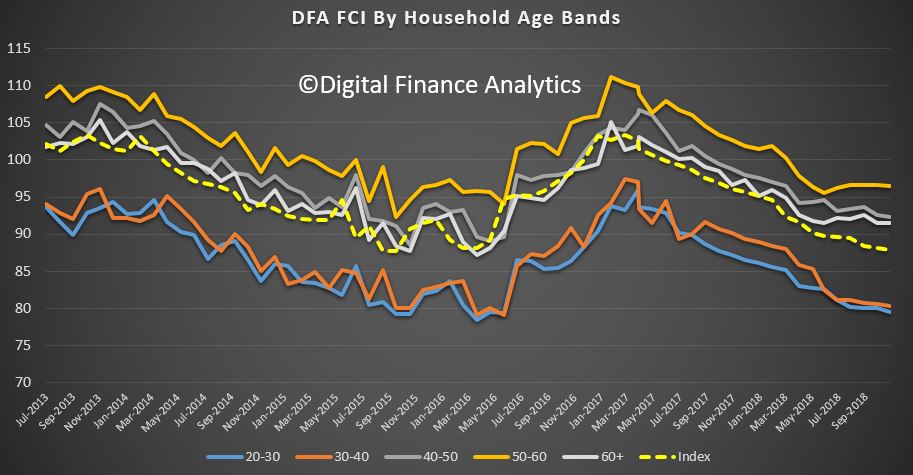
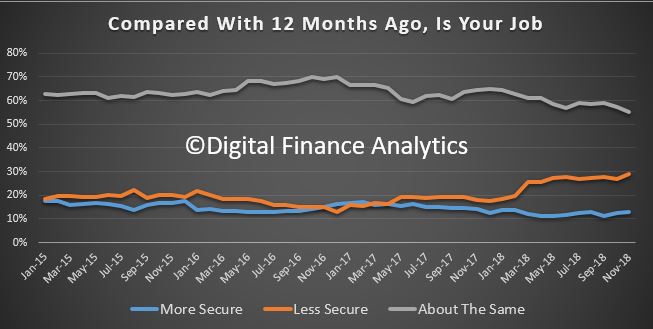
We can then dive into the elements which drive the survey. Looking at job security first, there was a 2% rise in those feeling less secure about their employment prospects, to 29%, and an offsetting fall of 2% in those who are felling about the same as a year ago at 55%. We continue to see many households employed in multiple part-time jobs to maintain income, and many are still seeing more employable hours, suggesting that underemployment remains a considerable issue. We also noted that significant numbers of workers were being “encouraged” to extend their leave over the upcoming holiday period.
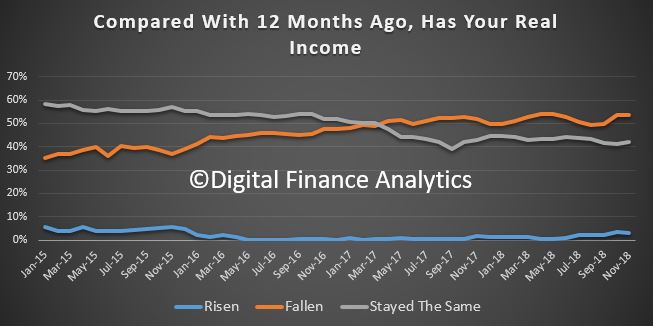
Turning to income, 2.87% reported a rise in real incomes in the past year (allowing for inflation) a fall of 0.81% on last month. There was a small rise in those saying their incomes had not changed in real terms at 42% but 53% said their incomes have fallen in the past year.
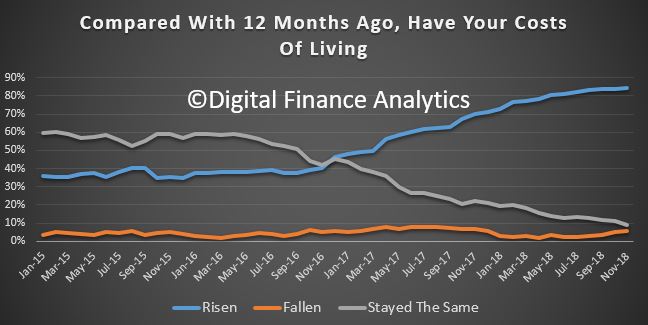
Living costs are still rising for many. Once again electricity costs, health care costs, child care costs and food costs all registered. 85% of households say their costs have rise, 9% said there has been no change and and 5% said their costs have fallen. There was small relief from lower petrol prices.
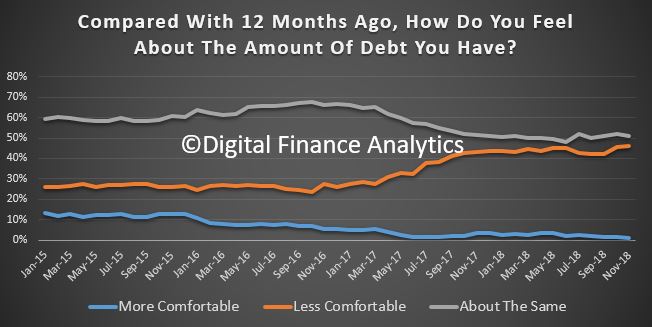
Given the high debt levels which exist in Australia (thanks to poor policy settings and lax lending standards), many households are concerned about their current debt levels. Just 1% were more comfortable than a year ago, and this was often associated with those who sold property and paid down their mortgages. 51% were as comfortable as a year ago, and 46% were more concerned, up 0.76% in the month. We continue to see debt levels rising among those with mortgages as they try to balance their finances, and turn to short term solutions, such as credit cards, personal loans, or installment payment options. Whilst overall levels of personal debt other than mortgages are falling, there is a concentration among those with property loans.
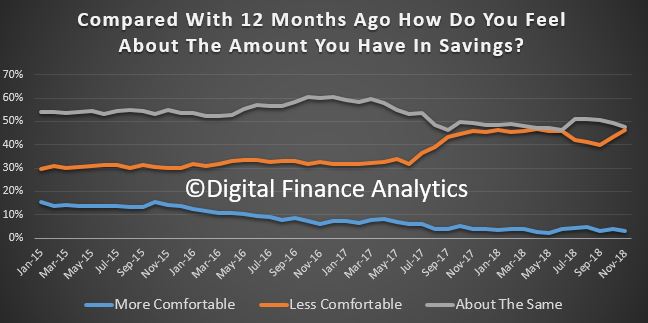
Savings are taking a beating at the moment, firstly because many are raiding savings to maintain lifestyle (which explains the falling savings ratio) and they are also receiving significantly less on deposits at the bank as financial institutions seek to recover margin in the higher cost environment. The fact is, it is the soft underbelly of savers who are taking the brunt of the pain, yet many are very reliant on bank deposits for income, and the media hardly ever focuses on this significant group. All the attention is on the mortgage rate. Banks are in my view taking advantage of this, and it is the easy way out to protect their margins. 46% of households are less comfortable than a year ago, up 3%, and just 3% are more comfortable, down 0.8% on last month.
So putting all this together, net worth is under pressure for many households. 34% of households said their net worth had improved in the past 12 months down 4% on last month, while 33% said their net worth had fallen, up 3% on the previous month. Falls in home prices, share prices and other investments all hit home. This underscore the fading “wealth effect” we are seeing as more react to this new environment.
We also observed one other significant fact. Despite the tighter conditions, and falling confidence, most households say they will still spend over the Christmas season, and will simply pick up the bill in the new year. This may be good news for retailers, but bad news for households down the track.
Slow wages growth, falling home prices and rising costs are combining to drag wealth and household confidence lower, and there is no end in sight. Another reason why we think the RBA will not be lifting the cash rate any time soon.

By way of background, these results are derived from our household surveys, averaged across Australia. We have 52,000 households in our sample at any one time. We include detailed questions covering various aspects of a household’s financial footprint. The index measures how households are feeling about their financial health. To calculate the index we ask questions which cover a number of different dimensions. We start by asking households how confident they are feeling about their job security, whether their real income has risen or fallen in the past year, their view on their costs of living over the same period, whether they have increased their loans and other outstanding debts including credit cards and whether they are saving more than last year. Finally we ask about their overall change in net worth over the past 12 months – by net worth we mean net assets less outstanding debts.
We will update the index next month.

Hello Martin,
Nice work, there is plenty of downside looking over your graph’s, as noted by you. Couldn’t agree more, draws a pretty clear picture, if people are not taking defensive action today, they better do so urgently, as JPMorgan & Goldman’s claimed 80% of the Comex gold delivery book yesterday.