
The BIS have released their latest comparative stats for household debt to GDP and household debt servicing ratios. And congratulations Australia, we headed the list with the highest debt servicing ratios in their series, and the second highest debt to GDP. Both alarming.
Looking at the household debt to GDP ratios first, to June 2019, the average across advanced economies is 72.8. This gives a proxy for how easily households will be able to service and repay their loans, the lower the less risk there is.
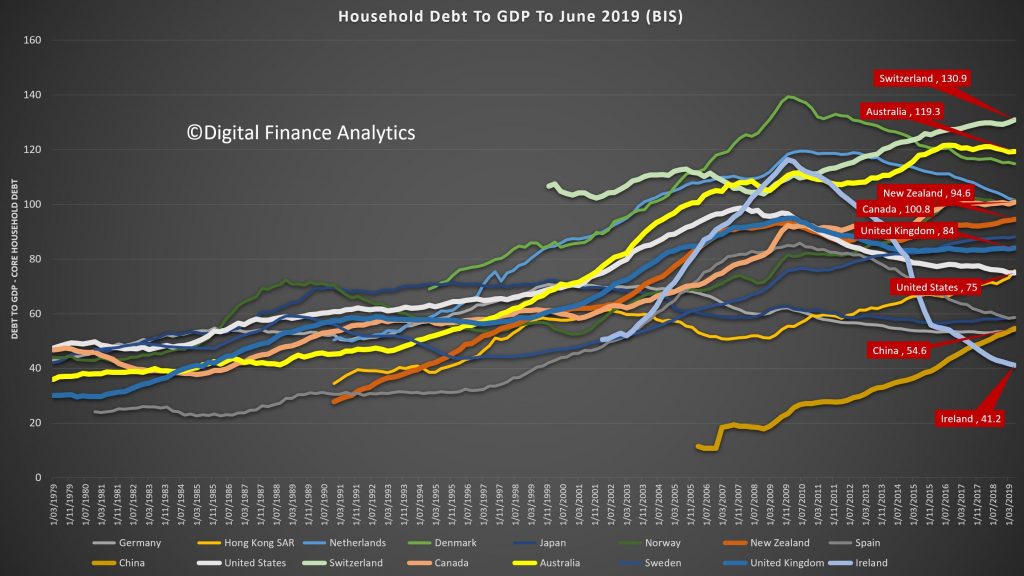
The United States is a little above the average at 75, the UK, at 84, Near Zealand stands at 94.6, similar to Canada, while Australia comes in at 119.3 and Switzerland leads the pack at 130.9.
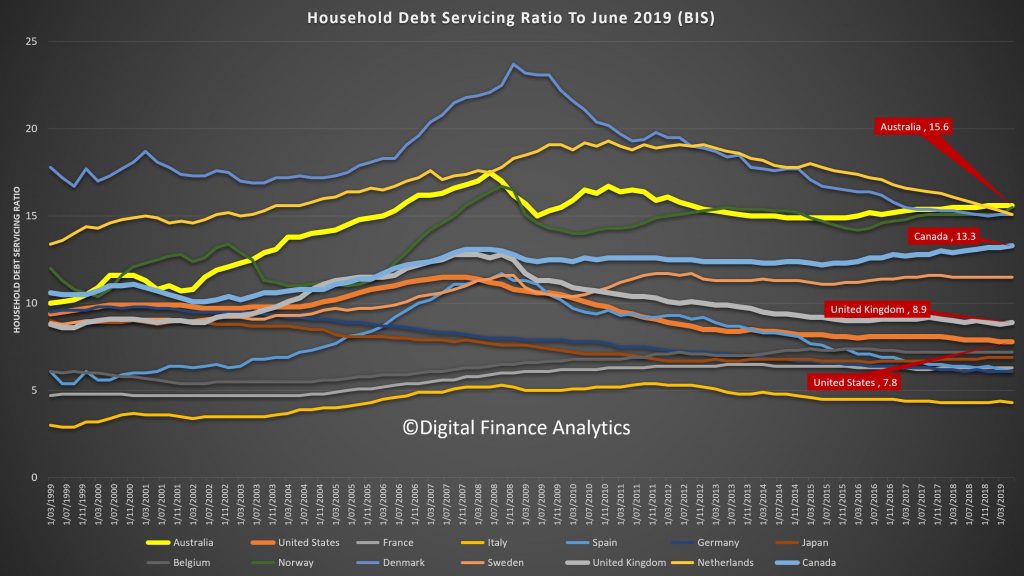
On the debt servicing ratios, we have taken first spot, at 15.6, with Canada at 13.3, the UK 8.9 and the US 7.8. The DSR is the average of income required to service a loan. So, the lower the better. Note this is across ALL households whether they borrow or not, so it takes account of the amount being repaid and the proportion borrowing. Note also the the Australian data has risen from 2014, despite rate cuts.
Conclusion, Australians is over leveraged, and mainly into property.
Hello Martin,
Wishing you a grand old end of year break, I call it a Chrissy break.
Btw, some of the terminology needs explaining as your excellent work extends out further into households across Australia.
DSR debt servicing ration expressed as a percent?
DIR debt to income ratio, just how is it arrived at please? Surely a 200 DIR doesn’t mean the repayments are twice the income?
The wider the audience the more explication of economic and accounting nomenclature Hey!
Many thanks and all the very best,