The ABS published their preliminary construction work done data to September 2014. Overall the seasonally adjusted value of construction work done dropped 2.2 % to $51,146.4m in the September quarter and makes a 5.1% fall this year. Within the data, NT construction rose, helping to trim the damage, but the result was below market expectations. Within the data. new private residential construction fell by 2.0 per cent in the September quarter but is still 9.7 per cent higher for the year. But the big question is, has construction begun to falter, or will growth continue – building approvals data could suggests it has some way to run, but it looks a little more shaky now. The RBA is banking on construction powering on of course to reach escape velocity as the mining investment boom fades.
The seasonally adjusted estimate of total building work done fell 1.0% to $22,435.8m in the September quarter. The trend estimate for engineering work done fell 3.0% in the September quarter.The seasonally adjusted estimate for engineering work done fell 3.2% to $28,710.6m in the September quarter.
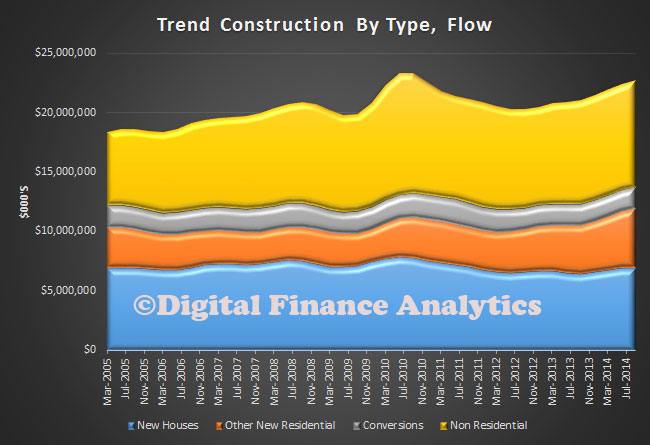
The trend estimate for total construction work done fell 1.2% in the September quarter 2014 but the trend estimate for total building work done rose 1.5% in the September quarter. The trend estimate for non-residential building work done rose 0.9%, while residential building work rose 1.8%. The trend estimates are derived by applying a 7-term Henderson moving average to the seasonally adjusted series. The 7-term Henderson average (like all Henderson averages) is symmetric but, as the end of a time series is approached, asymmetric forms of the average are applied. Unlike weights of the standard 7-term Henderson moving average, the weights employed have been tailored to suit the particular characteristics of individual series. So looking at trend data we see new houses more static than other residential development, (units).
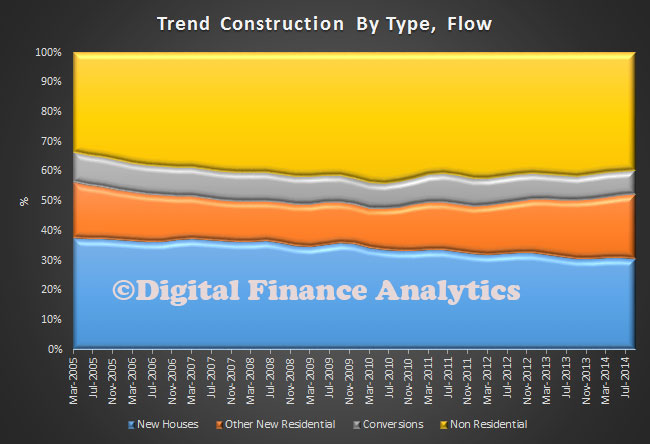
 This is shown more starkly if we look at percentage distribution. Whilst conversions are relatively static, units and other non-house residential building is showing more momentum.
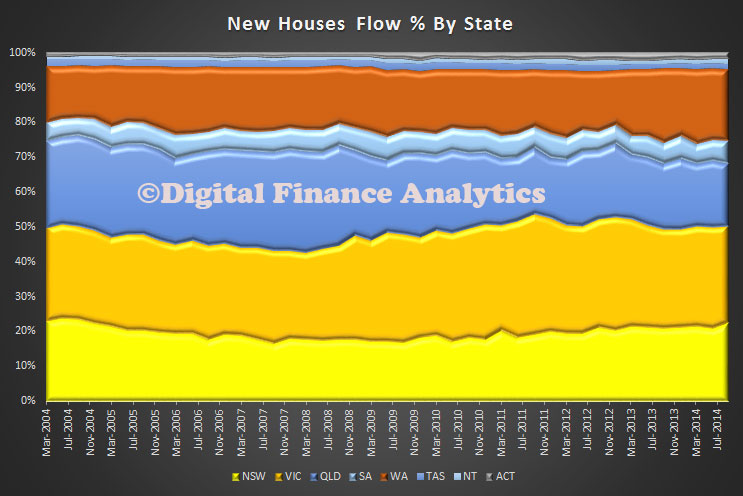
 The original state data shows that more new houses were built in VIC than NSW, with WA and QLD close together.
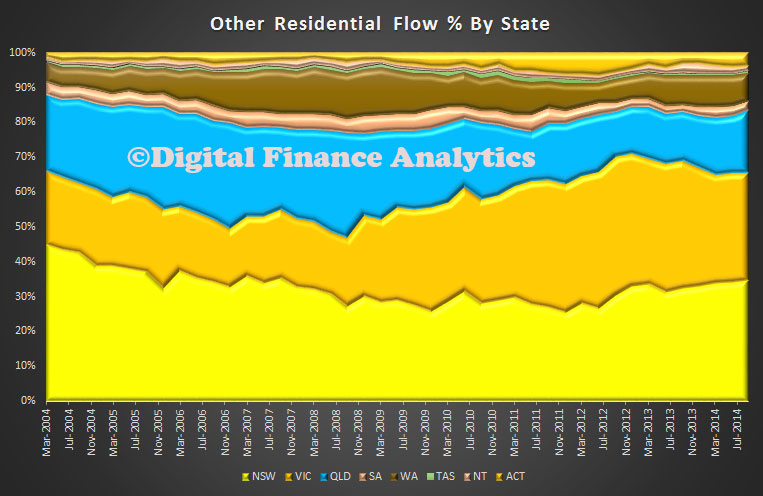
 Turning to other types of residential building, we see that around 70% are locate across NSW and VIC. We see a spike in ACT units in 2011, but this seems to be slowing now. In WA more houses than units are being built.