
The RBA and APRA released their monthly stats to end June on Friday.
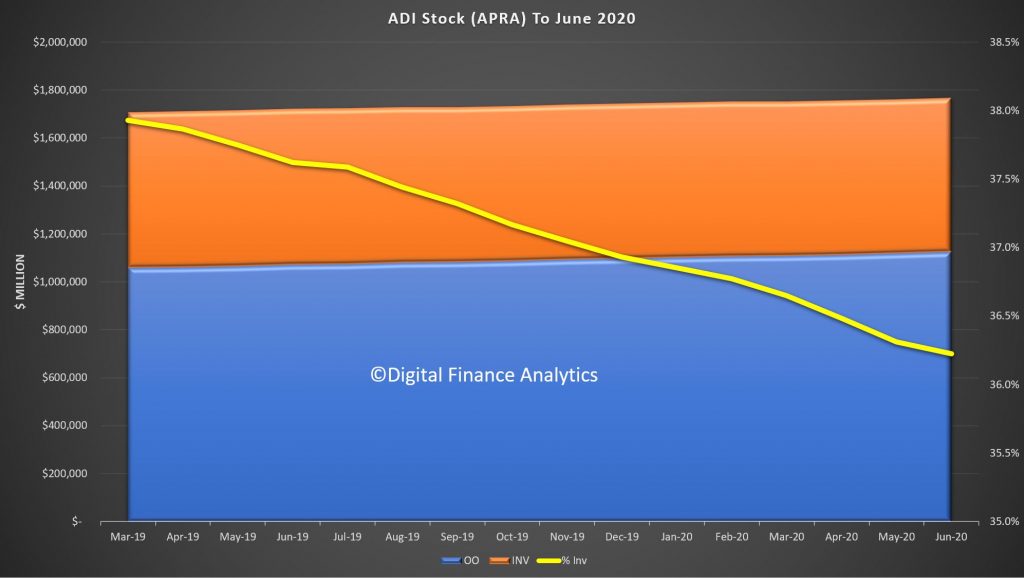
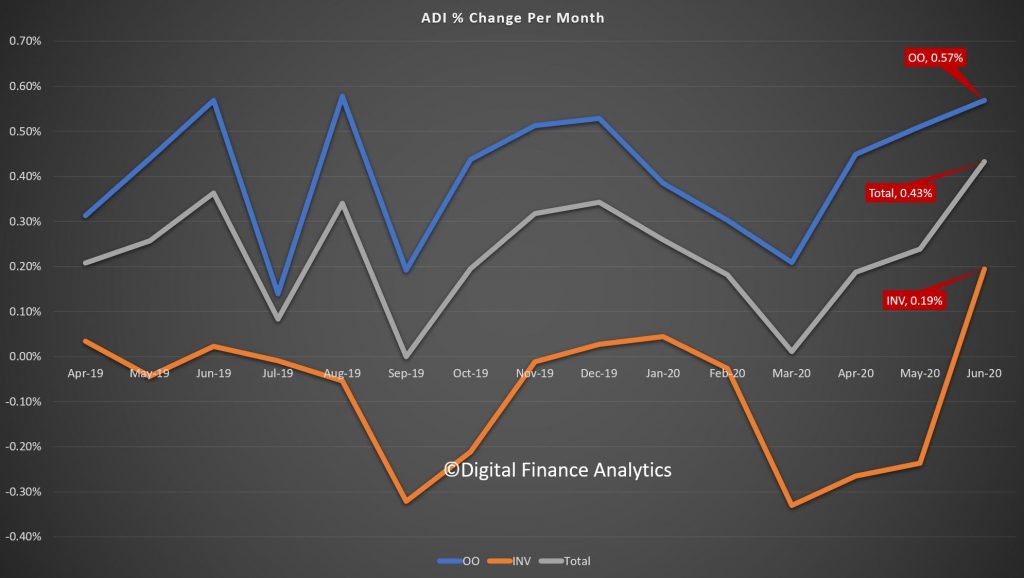
The stock data from APRA, relating to the ADI’s (banks etc.) revealed that total owner occupied housing lending rose 0.57% to $1.12 trillion, while investment lending rose 0.19% to $0.64 trillion. As a result total lending for housing from ADI’s was up 0.43% to $1.76 trillion. A record. Investment lending was 36.2%, dropping again. And remember, around 11% (~$200 billion) of borrowing households are on repayment holidays, so balances are automatically rising as a result. Something which I note few are commenting on.
The change over time shows that as the lock downs were eased in June, demand for credit was higher, something which we suspect will be temporary. And of course refinancing is 40% higher, and we know that many drew down additional equity through the transaction. More on that in a later post.
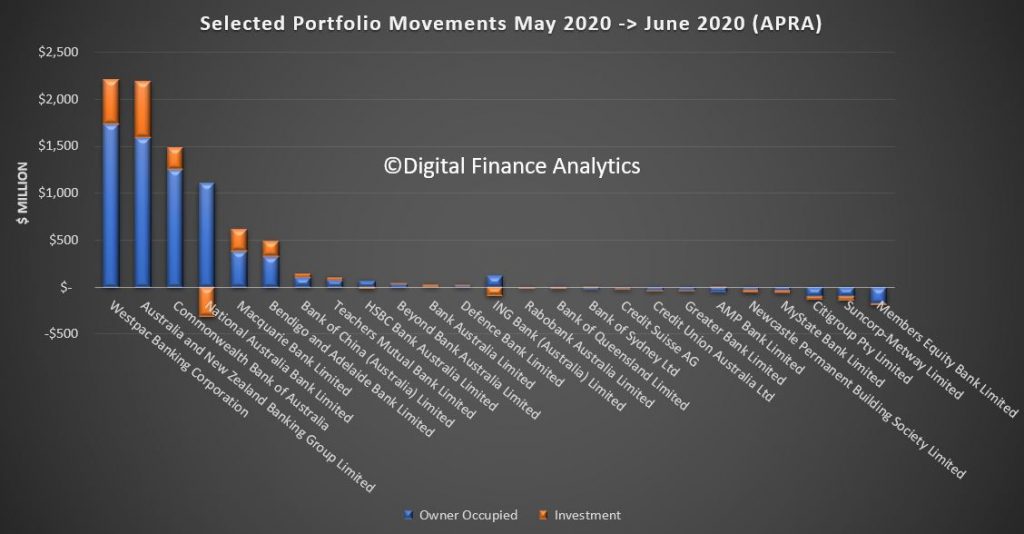
Westpac led the pack according to the bank level data, with growth that matched CBA, although CBA wrote more investor loans. NAB dropped investor loan balances according to the APRA report, while Members Equity and Suncorp dropped both investor and owner occupied balances. The cheap loans offered by the big four makes it hard for smaller players to compete as they fight for market share scraps in a difficult market. The 60 basis point drop in funding, thanks to the RBA, is of course helping to drive rates lower.
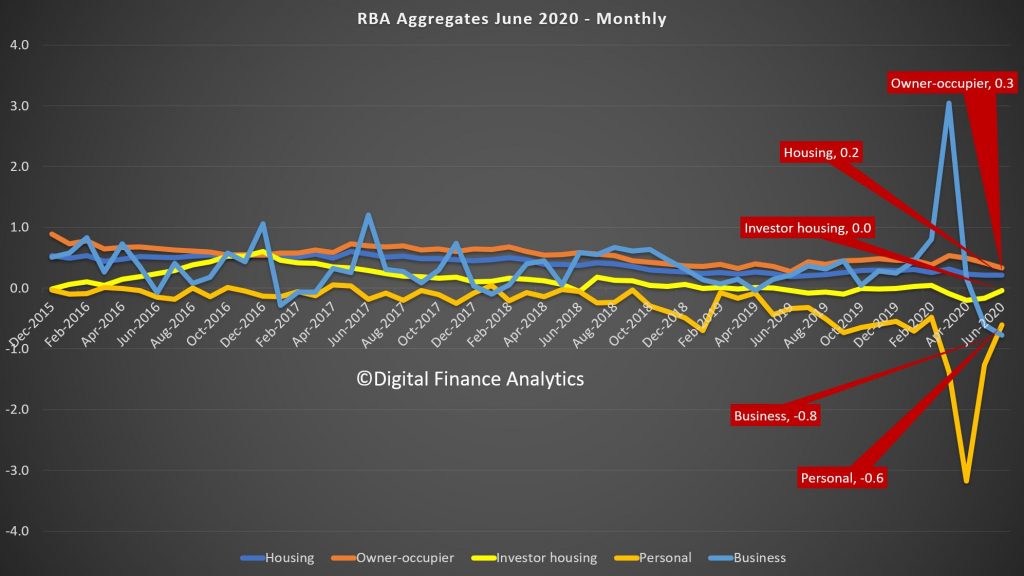
The RBA series, which includes the non-banks shows a somewhat similar story with the monthly housing for owner occupied higher, at 0.3% up, investment lending flat, and total housing up 0.2%. Business lending and personal credit were both lower.
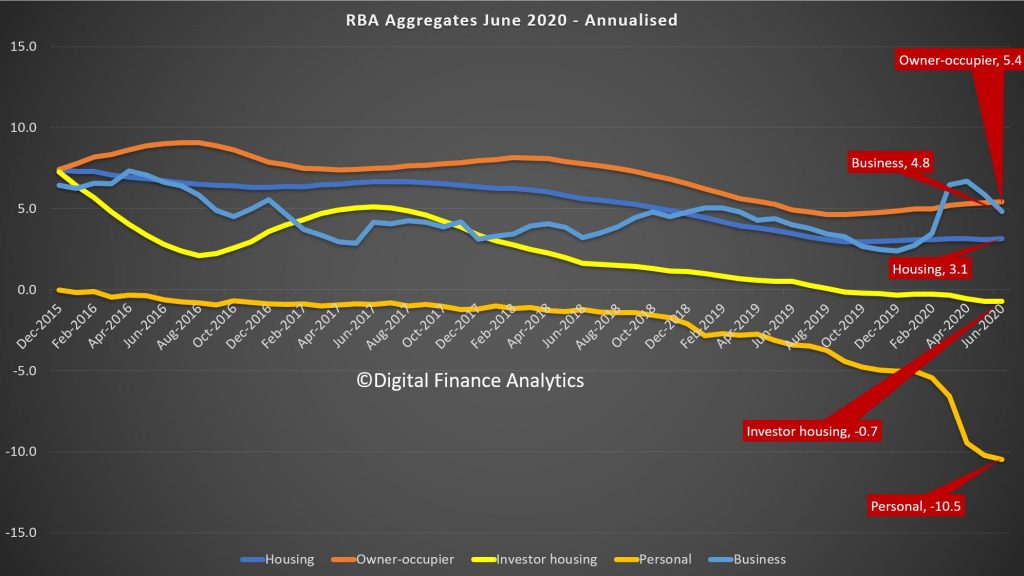
The less noisy annual trends revealed that annualised growth of owner occupied loans is still an amazing 5,4%, while investor lending is down 0.7%, leading to average housing lending at 3.1%. Business credit is 4.8% but that was upped by drawn downs at the start of the virus phase, and is now lower, and personal lending is down 10.5%.
The total credit number was down to 2.9% and we suspect will continue to head south, while the broad money measure was up to 10.2% – thanks to the RBA interventions, JobSeeker, JobKeeper, Super withdrawals, and other stimulus measures. The question now becomes where will the money flow – to drive prices higher as people buy more, or into the financial system to drive stocks and other financial assets higher? One leads to inflation, the other to deflation – I suspect we will follow the Japan route but we will see.
