
The U.S. housing market has garnered attention recently but for the wrong reason amid numerous signs of some weakening. Parts of the housing market have likely peaked while others haven’t, including new-home sales and construction, which pack the biggest GDP and employment punch.
 Source: Mortgage News Daily.
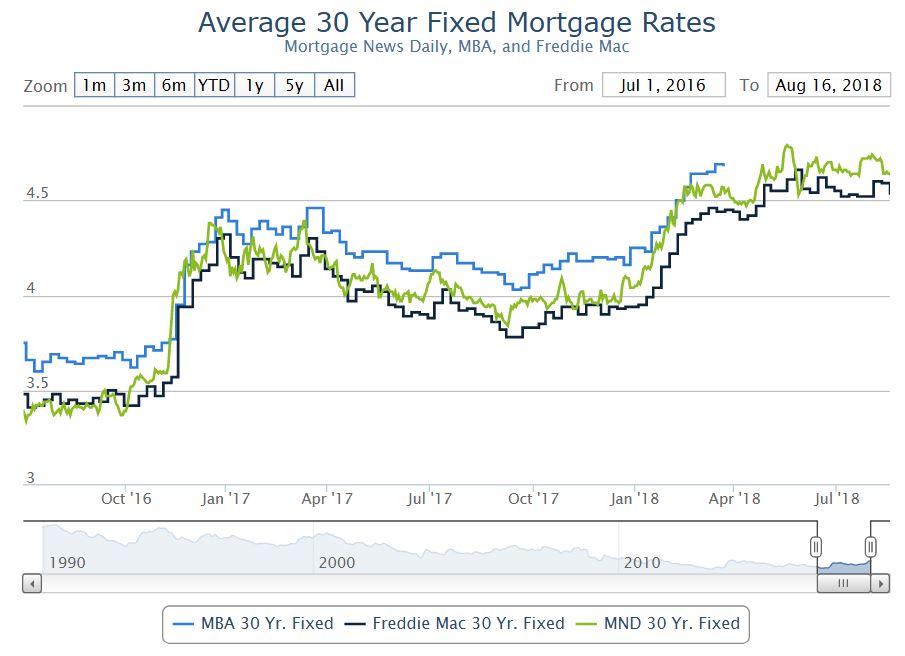
Before assessing where housing is headed, it’s important to identify the possible culprits in the recent weakness in sales and construction. Common theories being tossed around blame the tax legislation that reduced the incentive to be a homeowner by increasing the standard deduction, lowering the deduction for a new mortgage, and capping the deductible amount of state and local taxes (which include property taxes) at $10,000 per year. More time is needed to assess the law’s impact on housing, since evidence is lacking. Sales of higher-priced homes, which would be most vulnerable, have been climbing. The tax legislation’s drag on housing will likely play out by reducing home sales and pushing some households to rent instead of buy, potentially putting upward pressure on rents.
We believe that affordability issues, mainly mortgage rates, are a more credible reason for housing’s recent slump. Affordability is a function of house prices, mortgage rates and income. Earlier this year, we noted that there was evidence that the housing market’s sensitivity to mortgage rates is increasing. The recent weakness in housing is consistent with this, since past increases in mortgage rates have been sufficient enough to be a drag.
To assess the impact, we ran through our U.S. macro model a scenario of a permanent increase in mortgage rates of 1 percentage point in the first quarter. That would be roughly the average of the gain during the taper tantrum and following the presidential election. The results show that the hit to residential investment is noticeable over the course of the subsequent year; real residential investment would be 7% lower than the baseline —enough to shave 0.1 to 0.2 percentage point off GDP growth for the year.
So far, mortgage rates have risen by 60 basis points this year, so the hit is smaller than our exercise, but it supports our view that higher interest rates are hurting housing.
Though there are headwinds, new-home sales and construction haven’t peaked, as fundamentals remain supportive. To estimate the underlying demand for new housing units, we broke it up into its main components, the trend in household formations, demand for second homes, and scrappage or obsolescence. The biggest source of demand is household formations, which have been running around 1.3 million per annum recently and this should continue over the next couple of years.
Demand for second homes tends to grow with the total number of housing units. We estimate that demand is running around 200,000 per annum. Housing units are scrapped from the housing stock each year because of demolition, disaster and disrepair. We estimate scrappage at 200,000 per year.
Even though underlying demand for new housing units is 1.7 million, housing starts should exceed that. Each year some housing units are started but never completed; assuming this is 1% of total housing starts—likely conservative—that would be an additional 17,000 starts. Underlying demand is about 25% below housing starts in the first half of this year. To close this gap over the next two years, would require homebuilding to rise 15% per annum. However, given the constraints facing builders this is unlikely. Alternatively, closing the gap in four years would require approximately an 8% gain per annum. Therefore, residential investment won’t be booming but it will be respectable.