Do you feel that, overall, you’re “better off” than you were in the past? Or that things are getting worse, or have plateaued?
We now have the data to get us a pretty good answer to that question, right down to the detail by “family types”, as categorised by the Household, Income and Labour Dynamics in Australia (HILDA) Survey. Starting in 2001, this longitudinal survey now tracks more than 17,500 people in 9,500 households.
The interactive below lets you drag and drop your family members into the house to see what the HILDA data reveal.
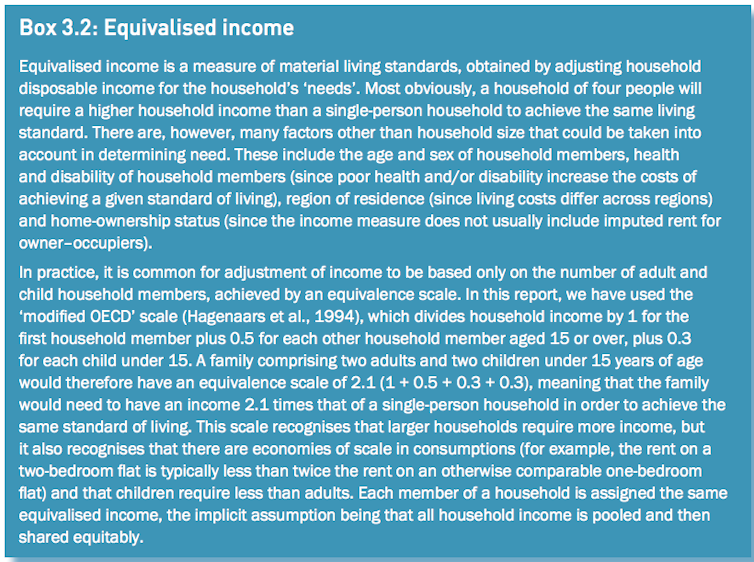
One measure we’re showing is what economists call “equivalised income”. That’s different to your total household income; here’s how the HILDA report explains it:

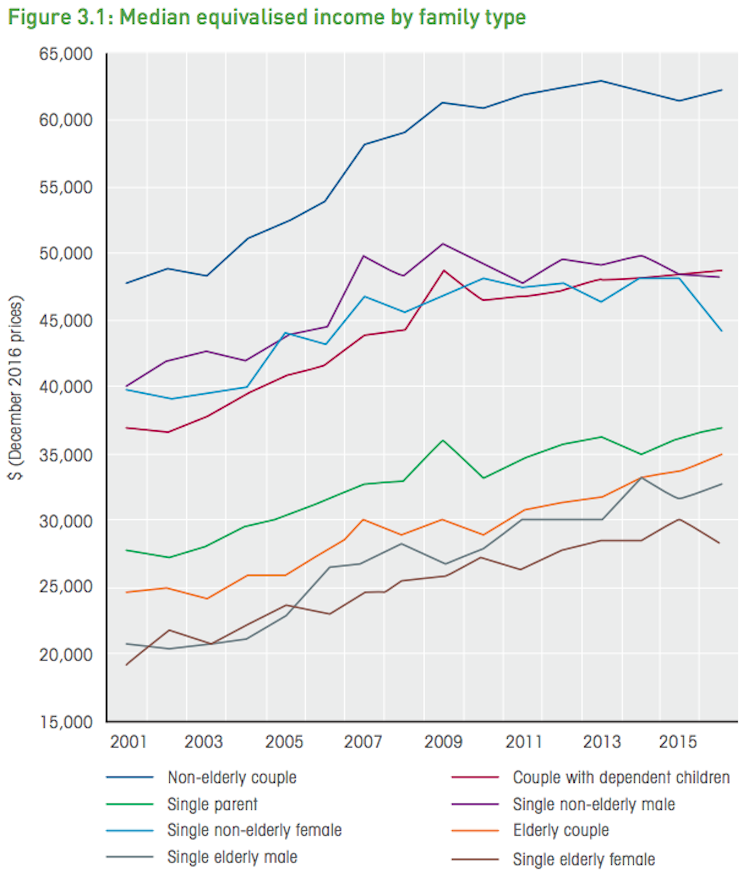
Overall, median equivalised incomes have gone up since 2001 for all family types, but some have fared better than others, as this chart from the full HILDA report shows:

For the purposes of interpreting the HILDA data, you might need to be a bit flexible when deciding which “family type” applies to you. For example, a household with two single, adult sisters living together will be classified as two single-person “families”, even though they might see themselves as a family unit.
And it’s worth remembering, as the HILDA report notes:
… some households will contain multiple “families”. For example, a household containing a non-elderly couple living with a non-dependent son will contain a non-elderly couple family and a non-elderly single male. Both of these families will, of course, have the same household equivalised income. Also note that, to be classified as having dependent children, the children must live with the parent or guardian at least 50% of the time. Consequently, individuals with dependent children who reside with them less than 50% of the time will not be classified as having resident dependent children.
