The Monthly Banking Statistics from APRA, released late last week, shows some interesting trends across the loans portfolios of individual banks in the sector. It of course does not include the non-banks. A number of smaller players are likely to gain APRA’s attention.
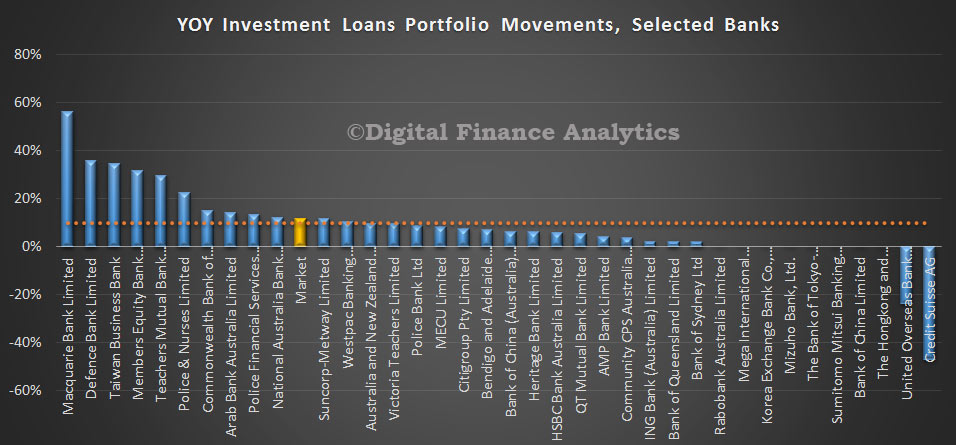
Looking first at the year on year portfolio movements for investment home loans, (of interest given APRA’s recent statements “strong growth in lending to property investors — portfolio growth materially above a threshold of 10 per cent will be an important risk indicator for APRA supervisors in considering the need for further action”), we see a market average (Jan-Jan) of 12%. But there are significant differences between players, with several above 20% growth, CBA at 15%, NAB at 12%, Suncorp at 11% and Westpac at 10%.
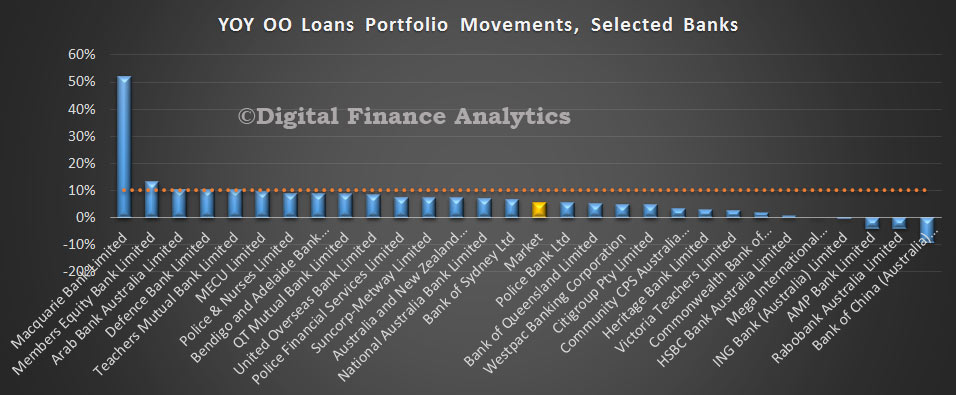
 Looking at owner occupied loans, the market grew at 5.6%, with significant portfolio variations, including Members Equity at 13%, Bendigo and Adelaide at 9%, and Suncorp at 7%. Remember, these are net portfolio movements, (allowing for new loans, and existing loan run-off. Macquarie stands out, but that is because of the $1.5 billion portfolio of non-branded mortgages they purchased from ING in September.
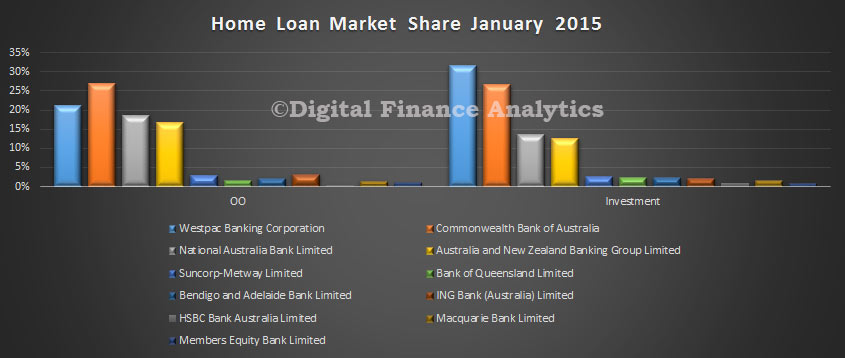
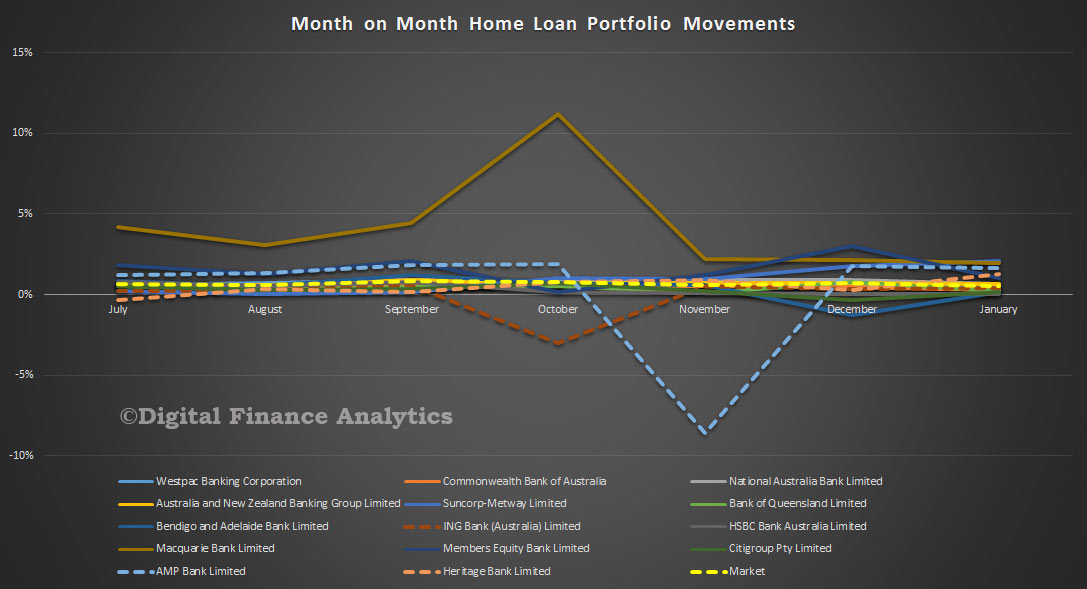
 In January, the portfolio grew by 0.42% for owner occupied loans to $859,645 bn, whilst investment loans grew 0.76% to $462,358 bn. Investment loans make up 35% of the bank’s portfolios. Total lending was up by $7,107 Bn. Looking at the current share of loans, there was little change in mix, with CBA the largest owner occupied loans provider, and Westpac the largest investment loan provider.
 We see Macquarie, AMP and Heritage Buildoing Society growing their loan portfolios the fastest last month.
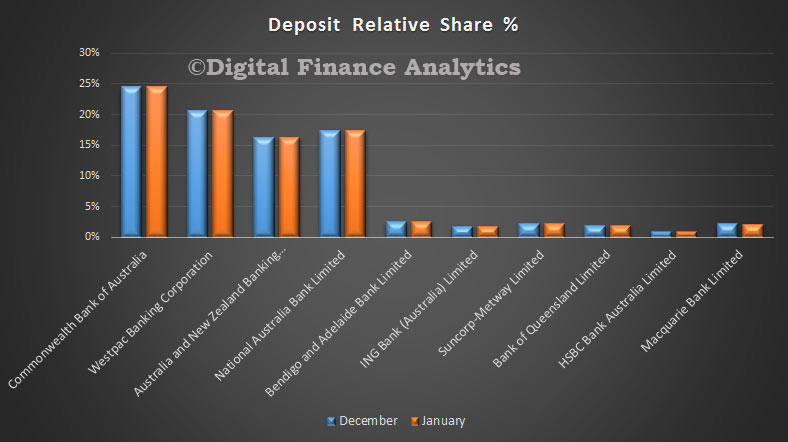
 Turning to deposits, they grew by 0.61% in the month, up $10,948 bn, to $1,807,882 bn. There was little change in the overall portfolio, with CBA still holding nearly a quarter of the market.
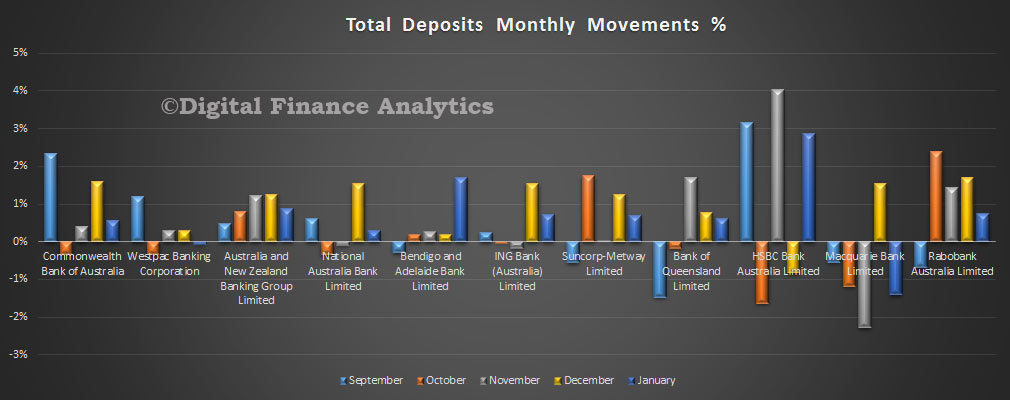
 However, looking at the portfolio movements, we see the smaller players, like Bendigo ING, Rabobank and HSBC growing faster compared with the main players. This represents differential deposit discounting which has been in play, thanks to beguine wholesale markets, and competition for deposits easing – bad news for depositors, and rates continue to fall.
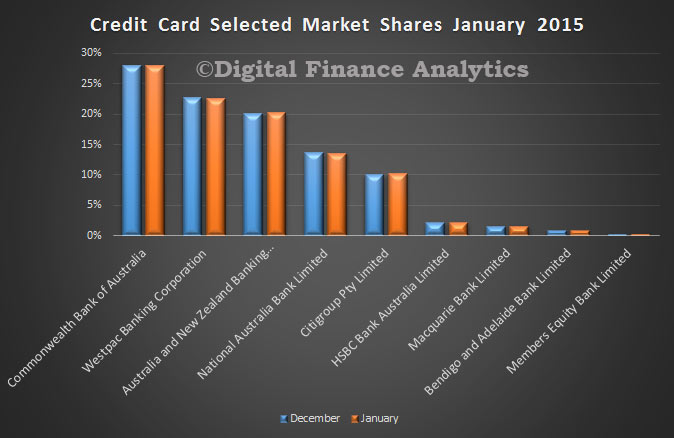
 Finally, credit card balances fell slightly in the month (after the Christmas splurge) down $824 bn to $41,002 bn. Little change in the footprint of the major players.