Macquarie presented their full year results to 31 March 2018. The 2H18 result was $1,309m, up 5% on 1H18 and 12% higher on 2H17. This represents a return on equity of 16.9%, up 1% from 1H18. The earnings per share rose 5% to $3.88.
They were helped by some one off items and tax benefits, but they to seem to manage to continue the upswing – especially with assistance from the capital markets division. They continue to outperform against their guidance.
Looking at 2H18 business mix their annuity-style businesses contributed $1,357m, down 35% on 1H18 and 16% on 2H17. But their capital markets facing businesses contributed $1,042m, up 83% on 1H18, and 37% on 2H17.
Overall there was an increase in 2H18 NPAT, notwithstanding net profit contribution from operating groups being down 10%, due to lower corporate costs as a result of higher earnings on capital, lower profit share, lower provisions and lower tax.
Profits from the FY18 was $5,061m, up 8% on FY17, with annuity-style business up 6% to $3,451m, and capital markets facing businesses up 11% to $1,610m.
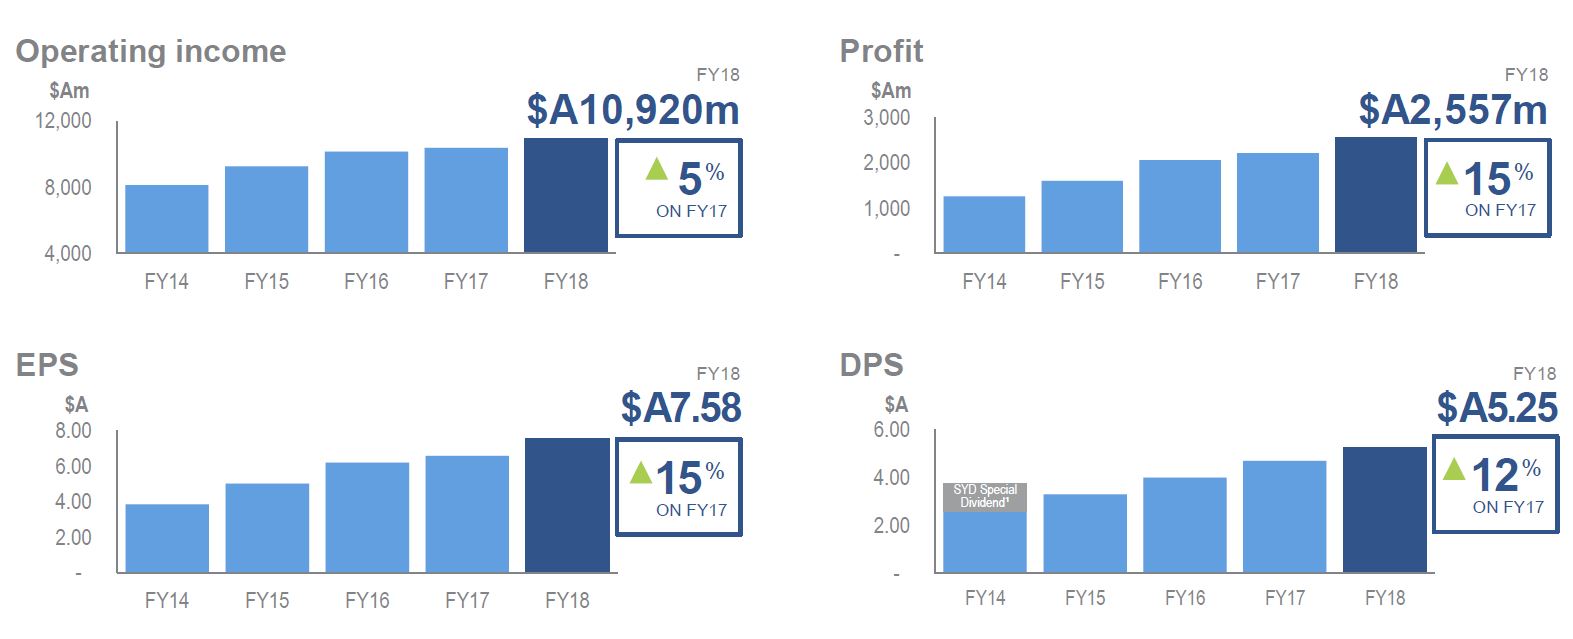 Annuity-style businesses represent approximately 70% of the Group’s performance.
Assets under management were $A496.7 billion, up $A15.0b since Mar 17, largely due to positive market movements and favourable currency
movements, partially offset by net asset realisations in MIRA (Includes divestment of Thames Water by MIRA-managed funds and ceasing asset services to consortia investors ($A25b).
International income was 67% of total income, with 33% of total income. A 10% movement1 in AUD is estimated to have approx. 7% impact on NPAT.
They reported a strong capital position, wiht APRA Basel III Group capital at March 18 of $19.1 billion.
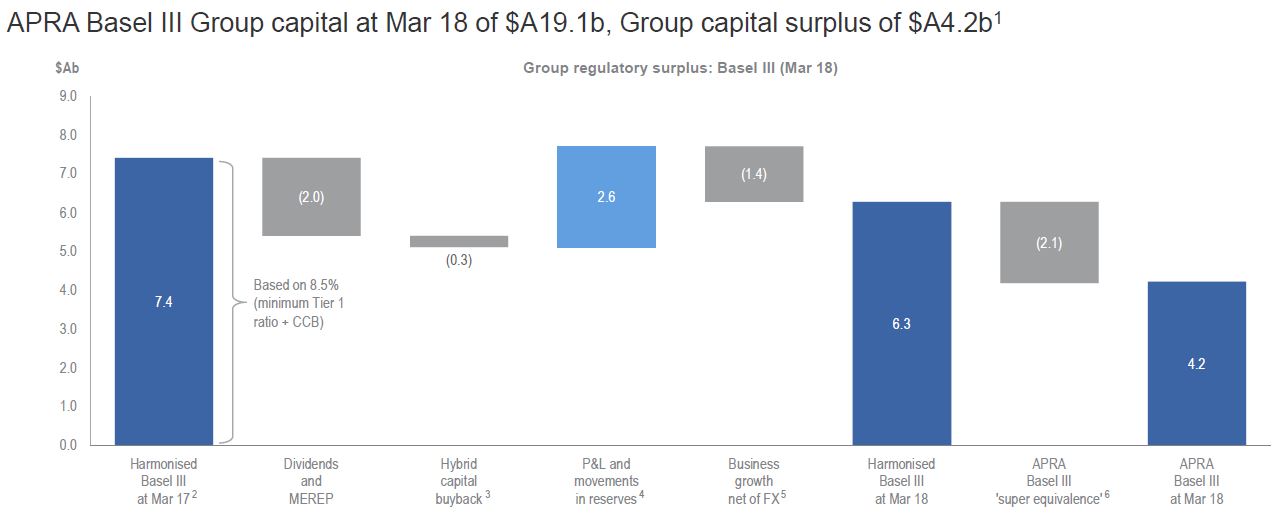
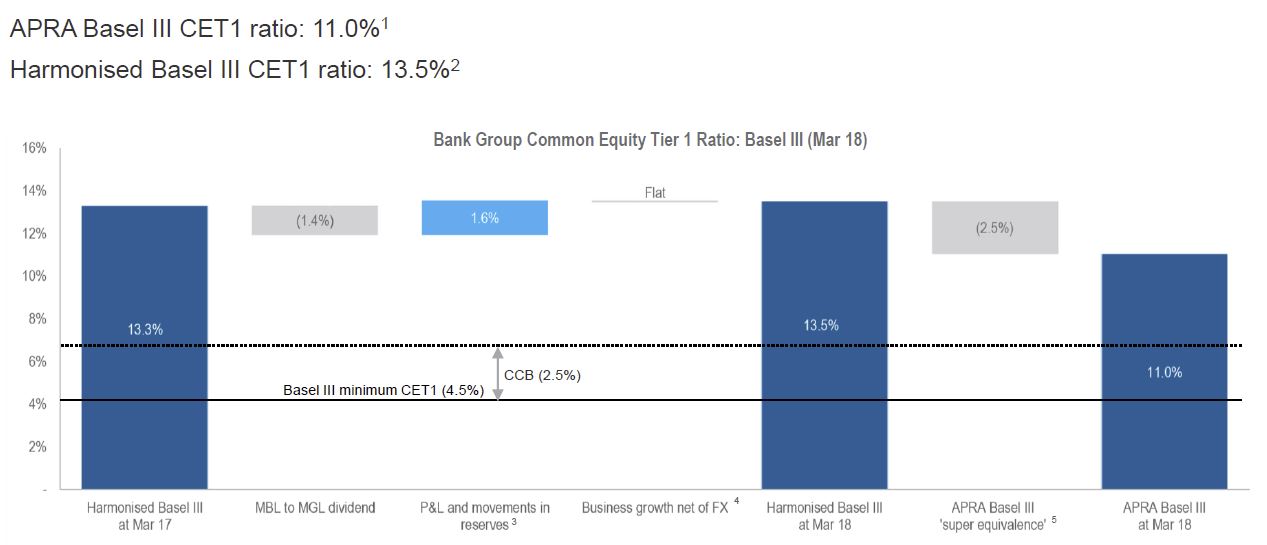 Given significant business growth in FY18, Macquarie did not purchase any shares under the share buyback program announced at the 1H18 result announcement; the program remains in place, with any share purchases subject to a number of factors including the Group’s capital surplus position, market conditions and opportunities to deploy capital by the businesses.
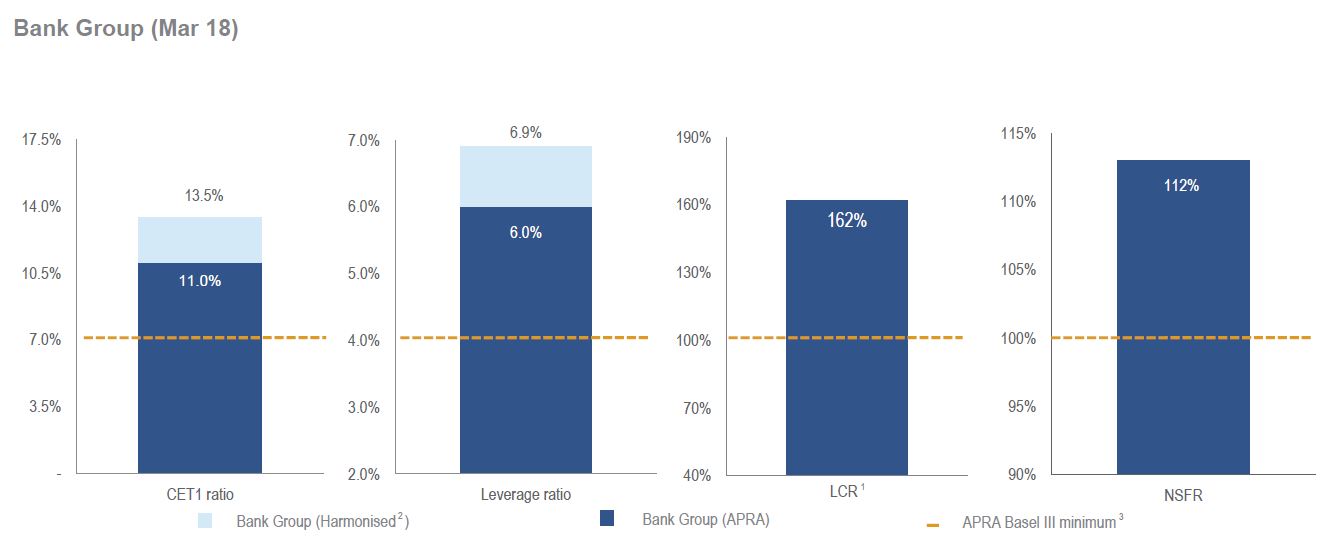
They have strong key ratios.
 Looking at the Group entities, MacCap provided the largest contribution.
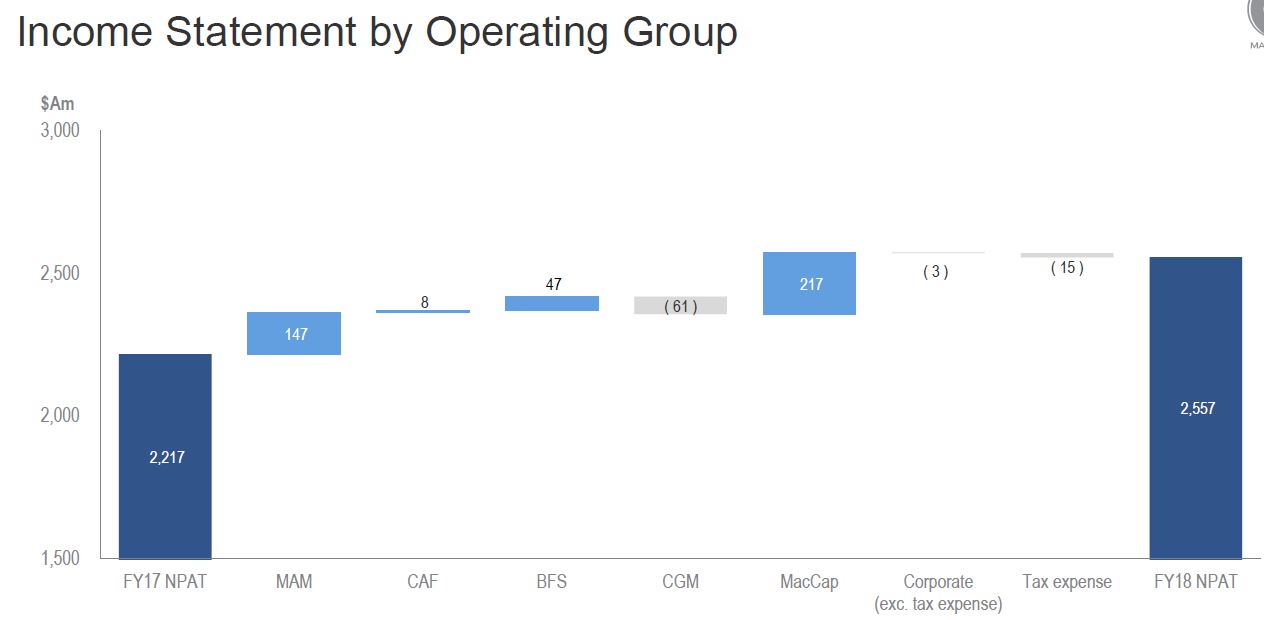 Macquarie Asset Management reported base fees of $A1,608m, broadly in line with FY17, with an increased fees from positive market movements in MIM AUM and investments made by MIRA-managed funds, but partially offset by asset realisations by MIRA-managed funds, net flow impacts in the MIM business and foreign exchange.
Performance fees of $A595m, up on FY17, and included performance fees from MEIF3, MQA and other managed funds, Australian managed accounts and Listed Equities. FY17 included performance fees from a broad range of funds, Australian managed accounts and from co-investors in respect of infrastructure assets. Investment and other income of $A766m, up on FY17, including increased equity accounted income as a result of the sale of a number of underlying assets as well as gains from the sale of infrastructure debt but partially offset by reduced gains from the sale and reclassification of certain infrastructure investments and lower distribution income
Impairments and provisions of $A177m largely reflects the write-down of MIRA’s investment in MIC
Total operating expenses of $A1,107m, up 5% on FY17 largely driven by increased employment expenses as a result of higher average headcount.
Corporate and Asset Finance reported net interest and trading income of $A582m, down 18% on FY17 mainly as a result of the reduction in the Principal Finance portfolio. Net operating lease income of $A929m, up 3% on FY17 due to improved underlying income from the Aviation, Energy and Technology portfolios.
Impairments and provisions expense of $A15m, down from $A111m in FY17 driven by the partial reversal of collective provisions, driven by net loan repayments, and the improved credit performance of underlying portfolios, but partially offset by the impairment of a legacy Asset Finance business and impairments of certain Aviation assets
Other income of $A352m, up 29% on FY17 including gains generated from Principal Finance investments in Europe and the US, The sale of the US commercial vehicles financing business and prior year primarily related to a gain realised on the sale of an interest in a toll road in the US by the Principal Finance business
Total operating expenses of $A679m, up 7% on FY17 mainly due to increased deal and project related expense.
Banking and Financial Services reported net interest and trading income of $A1,182m, up 13% on FY17 with a 6% growth in average Australian loan volumes and 7% growth in average BFS deposits, though partially offset by $A16m allocation of the Australian Government Major Bank Levy that
came into effect from 1 Jul 17. Fee and commission income of $A466m, in line with FY17, with wealth Management fee income increased 7% driven by platform commissions from higher funds on the Wrap and Vision platforms which increased 14% on FY17 and decrease in life insurance income following the sale of Macquarie Life’s risk insurance business in Sep 16. There was a net gain on disposal of businesses of $A2m down from $A192m in FY17, which benefited from the net overall gain on sale of Macquarie Life’s risk insurance business to Zurich Australia Limited and the US mortgages portfolio.
Impairments and provisions expense of $A26m, down on FY17, which included higher impairment of equity investments and impairments of intangibles relating to the Core Banking platform and higher business lending provisions taken on a small number of loans.
Total operating expenses of $A1,086m, down 4% on FY17 which was impacted by nonrecurring expenses. Underlying expenses were $A34m higher and included a 4% increase in average headcount to support growth.
Commodities and Global Markets reported commodities income of $A1,093m, down 3% on FY17, with risk management products down 6% on FY17 reflecting mixed results across the commodities platform with continued subdued volatility impacting client hedging activity and trading opportunities in Global Oil, partially offset by strong results in North American Gas and Power, Bulk Commodities and continued growth in Commodity Investor Products. Lending and financing income down 9% on FY17 largely due to wind down in legacy portfolios in the oil and gas sectors and a reduced contribution from metals financing. Inventory management, transport and storage income up 22% on FY17 mainly driven by significant
opportunities for the North American Gas and Power business to benefit from price dislocations across regions. However, the timing of income recognition in relation to tolling agreements and capacity contracts results in a net $A144m of income being recognised in future years.
Credit, interest rate and foreign exchange income of $A508m, down 18% on FY17 driven by reduced client activity in an environment of sustained low volatility and tighter credit spreads, unfavourable market conditions impacting trading opportunities, partially offset by strong client activity in structured foreign exchange products. Equities up 17% on FY17 reflecting more favourable conditions in Asia, a moderate increase in volatility and
strong demand for warrants and structured client capital solutions. Fee and commission income of $A893m, up 4% on FY17 driven by demand for advisory and structured solutions primarily in Asia and North America. • Investment and other income down on a strong FY17 which included gains on the sale of a number of investments in energy and related sectors
Impairments and provisions down on FY17 which was impacted by certain underperforming commodity related loans.
Expenses of $A1,997m were broadly in line with FY17, with impact of the Cargill acquisitions partially offset by cost synergies following the merger of CFM and MSG.
Macquarie Capital reported fee income was broadly in line with FY17, including M&A: lower fee income across most regions except Europe, ECM: reflected a sustained period of lower deal activity in Australia, DCM: higher fee income reflected increased market share and client activity in the US. There was stronger investment-related income (ex non-controlling interests), including higher revenue from asset realisations across most regions, primarily in the green energy, conventional energy and infrastructure sectors together with gains in the insurance and technology sectors, Increase in equity accounted income primarily due to the improved underlying performance of investments but partially offset by higher funding costs for balance sheet positions due to increased activity, including the acquisition of GIG
Lower provisions for impairment and net operating expenses increased 9% on FY17 reflecting transaction, integration and ongoing costs associated with the acquisition of GIG and higher operating expenses from increased investing activity
