
The latest RBA Statement on Monetary Policy moves the dial a little in terms of expectations, but also is still predicting better economic outcomes down the track, if a little further away than originally expected (again).
 By 2020, GDP could be somewhere between 1 and 5.5% – that should about cover it!
They call out risks relating to the amount of debt in the household sector, and the prospect of higher funding costs, and lower consumption should home prices fall. So there are a number of important items in the economic cross currents, and I am going to focus there today.
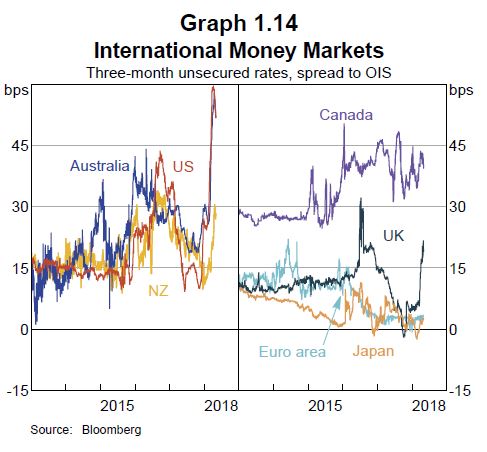
First, the highlight that US funding costs are on the rise, as US dollar money markets have increased.
 They highlight that these developments have had a notable knock-on effect on Australian money markets. “In part, this is because Australian banks raise a portion of their funding in US markets to finance their domestic assets. So they have responded to higher US rates by seeking to borrow more in domestic markets, which has place upward pressure on rates in Australia. Similar effects, although less pronounced, can be seen on rates
in the United Kingdom and New Zealand. By contrast, banks in the euro area and Japan tend to raise funds in US dollar markets in order to fund US dollar assets, and so have less scope to substitute into domestic funding sources”.
 “Higher bank bill swap (BBSW) rates affect bank funding costs in a number of ways. First, BBSW rates flow through to the rates banks pay on their new short- and long-term wholesale debt. In addition to this effect, bank bond
yields have increased by around 20 basis points since the start of the year.
Second, the higher BBSW rates increase some of the costs associated with hedging the risks on banks’ debt. Banks tend to issue fixed-rate bonds and then swap a sizeable share of these fixed interest rate exposures into floating rate exposures. This better aligns the interest rate exposure from their funding with their assets (which consist largely of variable interest rate loans). In doing this, the banks typically end up paying BBSW rates on their hedged liabilities, which flow through to the cost of funding.
Third, rates on wholesale deposits tend to be closely linked to BBSW rates, so the cost of these deposits is rising. Wholesale deposits include deposits from large corporations, pension funds and the government, and account for around 30 per cent of banks’ debt funding. Over the year to date, retail deposit rates have decreased slightly, mostly reflecting declines in the rates on online saving accounts. Most, but not all, of these decreases occurred
before the recent increase in BBSW”.
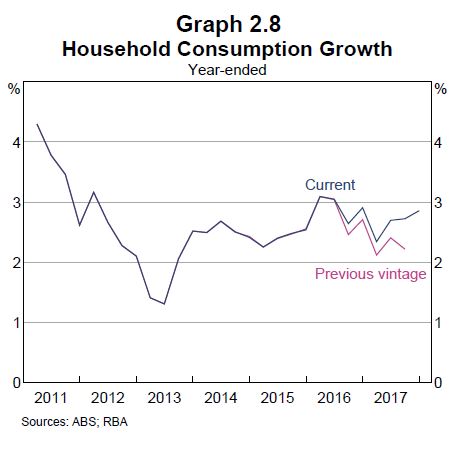
 They suggest that “revisions” to the household consumption series shows a higher level of spend than previously thought. “Household consumption grew strongly in the December quarter and revisions to previous data
show that consumption growth held up better than previously thought in the second half of 2017 (Graph 2.8). Over the year, consumption grew by almost 3 per cent. Upward revisions to household consumption were particularly large for discretionary categories of expenditure, which tend to be more sensitive to household finances. Spending on overseas travel by Australian residents (which is classified as imports) was a major source of these revisions, while upward revisions to food and health expenditure
also lifted essential expenditure. More recent indicators suggest that household consumption growth was steady in early 2018: growth in retail sales held up in the first two months of the year. Measures of households’
sentiment towards their personal finances remain above their long-run averages, after increasing since the middle of 2017”.
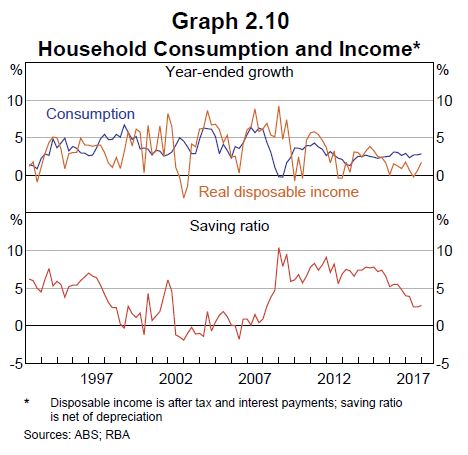
 “Household consumption grew at a faster rate than household disposable income over 2017; the household saving ratio is reported to have declined, although it stabilised towards the end of the year as income growth picked up (Graph 2.10). Growth in real household disposable income was below average over 2017 at 1.7 per cent, largely because of low wages growth. The prospect of continued low growth in household income remains a key risk to the outlook for household consumption, especially given high levels of household debt. Slower growth in household net wealth, particularly in an environment of below-average income growth, adds to uncertainty about the outlook for consumption”.
 “New dwelling construction declined by 5 per cent over 2017. This follows a few years in which new dwelling construction increased to high levels, supported by low interest rates, strong population growth and higher
housing prices in the eastern states. The recent decline in residential construction activity has been concentrated in detached housing, while higher-density construction activity has remained at high levels (Graph 2.14). Alterations and additions appear to have been less responsive to the cycle in new dwelling construction than in previous episodes”.
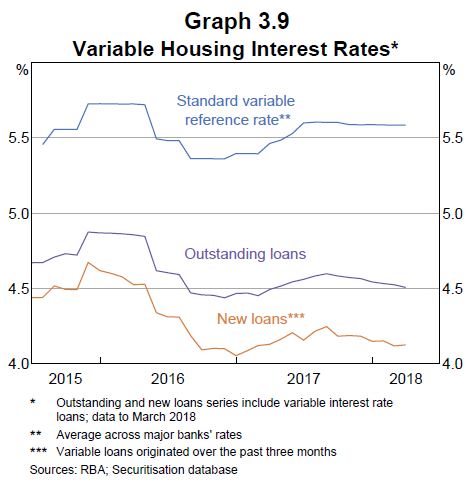
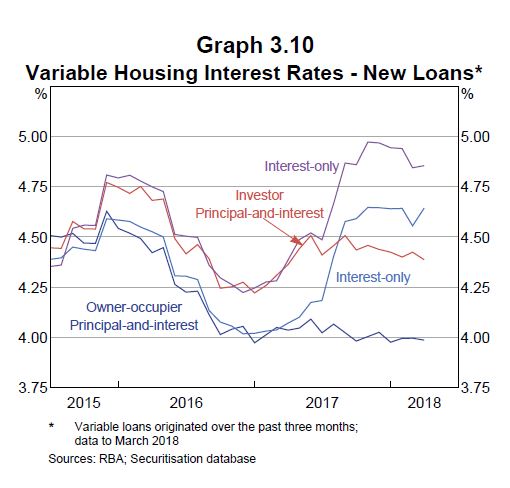
 Turning to mortgage rates, they confirm that new loans tend to be at lower variable rates than the average for outstanding loans. Moreover, new IO borrowers continue to pay a premium above the interest rate on new principal-and-interest (P&I) home loans.
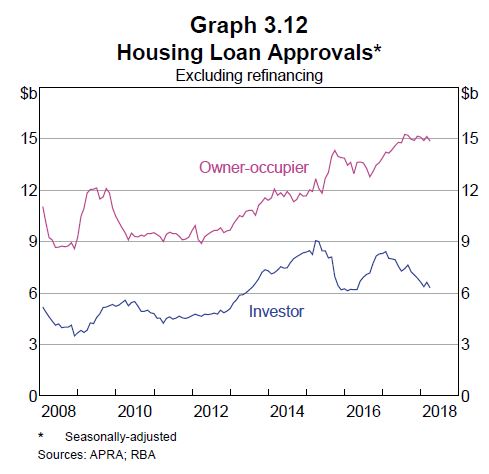
 “The value of housing loan approvals (excluding refinancing) has continued to decline over recent months, to be 8 per cent below the recent peak in August 2017. This has been driven by investors, with owner-occupier approvals remaining relatively steady since mid 2017 (Graph 3.12). The decline in investor approvals has been primarily concentrated in New South Wales”.
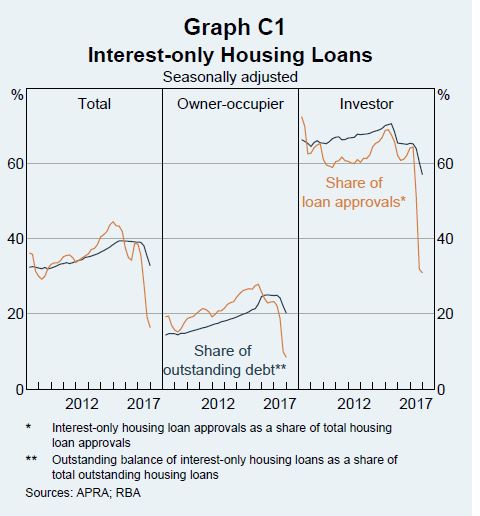
 They reviewed interest only loans (again) and concluded that “Currently it appears that the share of borrowers who will not be able to afford higher P&I repayments and are not eligible to alleviate their situation by refinancing is small. Liaison with the banks suggests that there are a few borrowers needing assistance to manage the transition. Over the past year, some banks have reported in liaison that there has been a small deterioration in asset quality. For some borrowers this has tended to be only temporary as they take some time to adjust their financial affairs to cope with the rise in scheduled payments. For a small share of borrowers though, it reflects difficulty making these higher repayments. That share could increase in the event that an adverse shock led to a deterioration in overall economic conditions”.
 The forecasts for domestic output growth are broadly similar to those presented in the February Statement. GDP growth is expected to strengthen a little over the next year or so as the drag from mining investment comes to an end and accommodative monetary policy provides ongoing support for sustained growth in household income and consumption, and non-mining business investment. However, the economy is not expected to encounter broad-based capacity constraints for some time.
 “There is also uncertainty about how much any decline in spare capacity will build into wage pressures and inflation. Wages and employment growth are
key components of household income growth, and uncertainty about the outlook for household income growth translates into uncertainty about
household consumption and so GDP. Another key source of risk to consumption growth is that high levels of debt are likely to increase the
sensitivity of households’ consumption decisions to changes in their income or wealth.
Household indebtedness is high; and debt levels relative to income have edged higher because household credit growth has outpaced weak income growth over recent years. Steps taken by regulators to strengthen household balance sheets have led to a moderation in the growth in the riskier types of lending to households, but risks remain. Even if overall household indebtedness currently appears sustainable, a highly indebted household sector is likely to be more sensitive to changes in income, wealth or interest rates. For example, a highly indebted household facing weaker-than-expected growth in disposable income or wealth is more likely to respond by reducing consumption. Consumption growth may also be weaker for a time if indebted households choose to pay down debt more quickly rather than consume out of additional income.
Housing assets account for around 55 per cent of total household assets, so weaker housing prices could be a factor that leads to weaker consumption growth than is currently forecast. National housing prices have eased following several years of strong price growth. To date, the cooling of conditions in the established housing market does not appear to have dampened consumption growth. Although the earlier gains in national housing wealth may not have encouraged much additional consumption, it is possible that households’ consumption and saving decisions could be more sensitive to an easing in housing price growth.
Tighter lending standards could also affect the outlook for domestic growth. While APRA recently announced plans to remove the investor loan
benchmark, the change in dynamics in the housing market and the high level of public scrutiny of lending decisions could see some tightening in the
supply of credit. This could affect the outlook for consumption and dwelling investment”.