
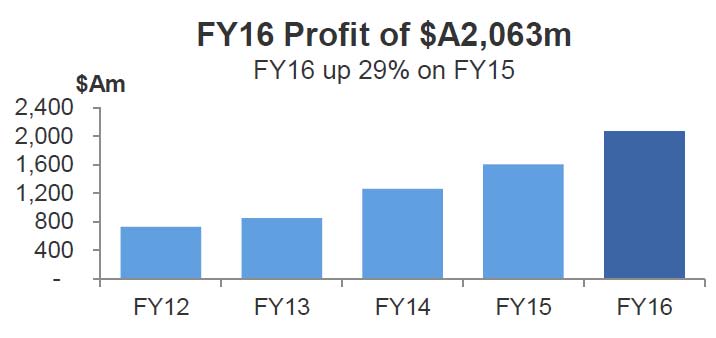
Macquarie Group announced a record net profit after tax attributable to ordinary shareholders of $A2,063 million for the full year ended 31 March 2016 (FY16), up 29 per cent on the full year ended 31 March 2015 (FY15) and in line with expectations.
However, profit for the second half of the year (2H16) was $A993 million, up seven per cent on 2H15 albeit down seven per cent on a strong first half (1H16) result. Looking under the hood, there was more pressure in the second half, with revenue growth lower than expected, offset by falls in remuneration and tax. Indications for FY17 suggest they see continued pressure and results will be “broadly in line” with FY16.
 Macquarie announced final ordinary dividend of $A2.40 per share (40 per cent franked), up from the 1H16 ordinary dividend of $A1.60 per share (40 per cent franked). The total ordinary dividend payment for the year of $A4.00 per share, is up from $A3.30 in the prior year. This represents an annual ordinary dividend payout ratio of 66 per cent.
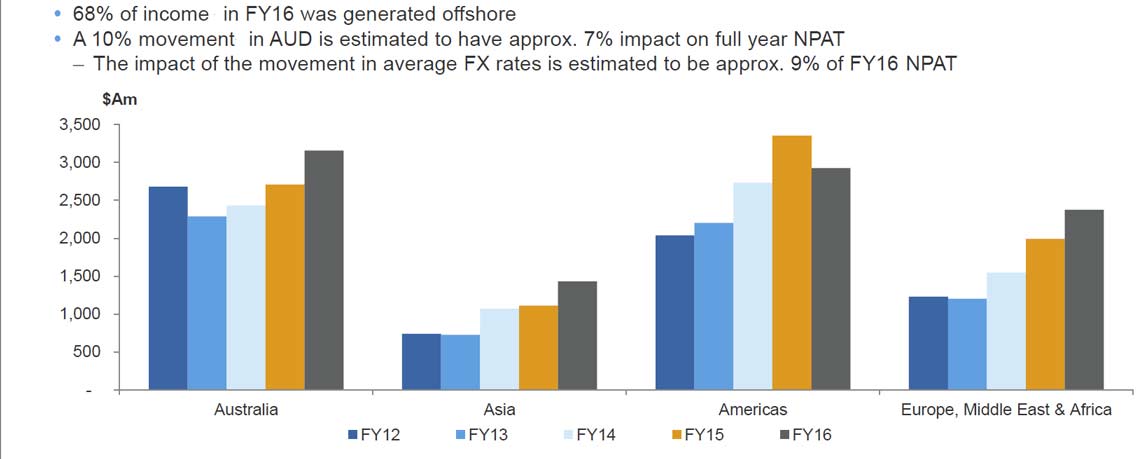
While Macquarie continued to build on the strength of its Australian franchise, its international income accounted for 68 per cent of the Group’s total income for FY16. Total international income was $A6,734 million for the year ended 31 March 2016, an increase of four per cent from $A6,461 million in the prior year.
 Macquarie’s annuity-style businesses’ (Macquarie Asset Management (MAM), Corporate and Asset Finance (CAF) and Banking and Financial Services (BFS)) which represent more than 70 per cent of the Groups’ performance, each reported record net profit contributions for the year, with combined net profit contribution increasing by $A277 million, or 10 per cent on FY15.
Macquarie’s capital markets facing businesses’ (Macquarie Securities Group (MSG), Macquarie Capital and Commodities and Financial Markets (CFM)) combined net profit contribution decreased by $A34 million, or three per cent on FY15.
Macquarie’s assets under management (AUM) at 31 March 2016 were $A478.6 billion, down two per cent from $A486.3 billion at 31 March 2015, due to a decrease in insurance assets and asset realisations, partially offset by higher asset valuations, additional investments and positive flows.
Net operating income of $A10,135 million for FY16 was up nine per cent, while total operating expenses of $A7,120 million were up six per cent on the prior year.
Key drivers of the change from the prior year were:
- A 14 per cent increase in combined net interest and trading income to $A4,346 million, up from $A3,819 million in FY15. This resulted from improved trading opportunities in MSG driven by increased market volatility particularly in China in the first half of the year; the impact of the depreciation of the Australian dollar, improved interest income in CAF Lending, growth of the motor vehicle portfolio in CAF; strong volume growth in Australian mortgages, business lending and deposits in BFS; and a strong contribution from the commodities platform in CFM. CFM’s customer flow was underpinned by volatility in global commodity prices and strong client flows in foreign exchange and interest rates markets due to ongoing market volatility. These factors were partially offset by lower income as a result of challenging market conditions and subdued client risk appetite in secondary markets which, in turn, were influenced by a sell-off in US credit markets
- A three per cent increase in fee and commission income to $A4,862 million, up from $A4,739 million in FY15, primarily resulting from an increase in base fees driven by the impact of the depreciation of the Australian dollar, market movements, raisings and investments and positive prior year flows partially offset by lower fee revenue from insurance assets; an increase in brokerage and commission in MSG due to the impact of the depreciation of the Australian dollar; and an increase in performance fees recognised in MAM
- A 32 per cent increase in other operating income and charges to $A923 million, from $A699 million in FY15, primarily due to an increase in net operating lease income due to the acquisition of an aircraft portfolio from AWAS Aviation Capital Limited during the year and the impact of the depreciation of the Australian dollar, partially offset by the divestment of the North American railcar operating lease portfolio in January 2015; net gains on sale of investments in MAM, including the partial sale of a holding in MIC, and gains in MacCap on listed and unlisted investments, partially offset by increased impairment charges in MacCap in relation to a number of non-related underperforming principal investments and loans; and the underperformance of certain commodity-related loans in CFM
- Total operating expenses increased six per cent, driven by a two per cent increase in employment expenses due to the impact of the depreciation of the Australian dollar on offshore expenses, an increase in trading-related activity in MSG; and an increase in investment in technology projects to support business growth particularly in BFS.
Staff numbers were 14,372 at 31 March 2016, up from 14,085 at 31 March 2015.
The income tax expense for FY16 was $A927 million, up three per cent from $A899 million in the prior year. The effective tax rate of 31.0 per cent was down from 35.9 per cent in FY15 reflecting the nature and geographic mix of income, as well as tax uncertainties.
Total customer deposits increased by 9.8 per cent to $A43.6 billion at 31 March 2016 from $A39.7 billion at 31 March 2015. During FY16, $A22.5 billion of new term funding was raised covering a range of sources, tenors, currencies and product types.
Liquidity Coverage Ratio (LCR) requirements came into effect from 1 January 2015, with disclosure required from 1 July 2015. For the quarter ended March 2016 the Bank Group’s average LCR was 173 per cent .
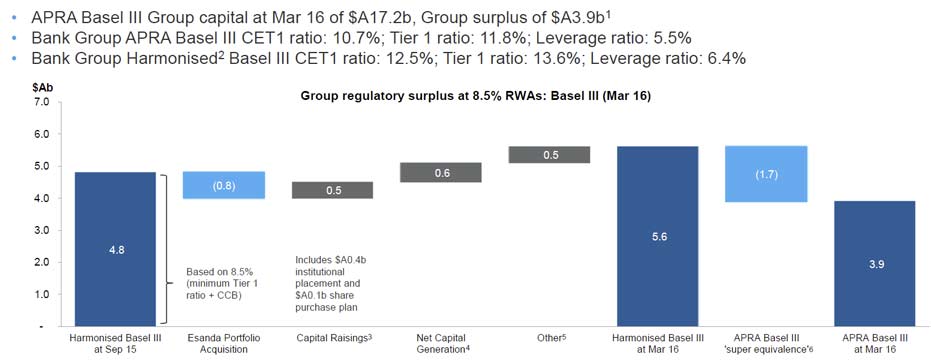
Macquarie Group remains very well capitalised with APRA Basel III Group capital of $A17.2 billion and Group surplus of $A3.9 billion at 31 March 2016. The Bank Group APRA Basel III Common Equity Tier 1 capital ratio was 10.7 per cent at 31 March 2016, up from 9.7 per cent at 31 March 2015.
 Macquarie intends to purchase shares, to satisfy the MEREP requirements of approx. $A440 million, subject to the New Arrangements noted below. The buying period for the MEREP will commence on 17 May 2016 and is expected to be completed by 8 July 2016. No discount will apply for the 2H16 DRP and the shares are to be acquired on-market.
APRA announced on 29 March 2016 that it has deferred finalising the capital components of the Level 3 framework for Conglomerates. APRA has advised it will consult on any new Level 3 capital requirements, but does not anticipate doing so earlier than mid-2017, with implementation being no earlier than 2019. An update will be provided following the publication of any proposed rules.
The Basel Committee has recently proposed a number of changes to the calculation of risk weighted assets, most of which are under consultation. Any impact on capital is dependent on upon the final form of these proposals and local implementation by APRA.
APRA have released a discussion paper on the Net Stable Funding Ratio (NSFR) which is yet to be incorporated into local standards. While the impact remains uncertain, Macquarie expects to meet the overall requirements of the NSFR.
Macquarie Asset Management delivered a net profit contribution of $A1,644 million, up 13 per cent on the prior year. MAM’s base fee income of $A1,569 million for FY16 increased 14 per cent from $A1,372 million in the prior year, mainly driven by the impact of the Australian dollar and market movements, raisings and investments in Macquarie Infrastructure and Real Assets (MIRA) and positive prior year fund flows in Macquarie Investment Management (MIM). These were partially offset by lower fee revenue from insurance assets. Performance fee income of $A693 million for FY16 increased four per cent from $A667 million in the prior year, including performance fees from various MIRA listed and unlisted funds, MIM Listed Equities, Delaware and hedge funds, as well as performance fee income from MIRA co-investors in respect of a UK asset.
Corporate and Asset Finance delivered a net profit contribution of $A1,130 million, up two per cent on the prior year. The improved result was largely driven by the impact of the depreciation of the Australian dollar and the acquisition of an aircraft portfolio from AWAS Aviation Capital Limited during the year and increased lending activity. These increases were partially offset by the non-recurrence of gains in the prior year on the restructure of a railcar logistics operating lease facility, the disposal of the North American railcar operating lease portfolio and the sale of the Macquarie Equipment Finance US Operations. CAF’s asset and loan portfolio increased 37 per cent from $A28.8 billion at 31 March 2015 to $A39.4 billion at 31 March 2016, due to acquisitions which continue to transition as well as organic growth.
Banking and Financial Services delivered a net profit contribution of $A350 million, up 23 per cent on the prior year. During the year, BFS benefited from increased income as a result of strong volume growth in Australian mortgages, business lending, deposits and the Wrap platform, partially offset by increased costs associated with the investment in technology projects to support growth in the business, including the Core Banking program. The Australian mortgage portfolio increased to $A28.5 billion, up 16 per cent on 31 March 2015, representing approximately two per cent of the Australian market. Macquarie funds on platform closed at $A58.4 billion on 31 March 2016, an increase of 22 per cent on 31 March 2015.
Macquarie Securities Group delivered a net profit contribution of $A268 million, significantly up from $A64 million in the prior year. In the first half of the year, MSG benefited from favourable market and trading conditions in Australia and Asia, driving strong growth in trading revenues. In the second half of the year, market concerns including increasing US interest rates, continued falls in commodity prices, and a Chinese-led slowdown in global growth negatively impacted levels of client activity and trading opportunities within markets.
Macquarie Capital delivered a profit contribution of $A451 million, up five per cent on the prior year, predominately due to a higher net contribution from principal assets, partially offset by increased operating expenses. Impairment charges recognised in the current year relate to a number of non-related underperforming principal investments across a range of sectors and regions. During FY16, Macquarie Capital advised on 395 transactions valued at $A176 billion including acting as joint lead manager and joint underwriter on NAB’s $A5.5 billion accelerated renounceable entitlement offer; joint bookrunner and placing agent for the $US4.3 billion H-share placement of Haitong Securities Co. Ltd; developer, equity sponsor and financial adviser on KentuckyWired; and adviser to NAB on the demerger of 75 per cent of Clydesdale & Yorkshire Banking Group, and Joint Global Co-ordinator on the simultaneous £400 million London IPO of the remaining 25 per cent on the main market of the London Stock Exchange and Australian Securities Exchange.
Commodities and Financial Markets delivered a net profit contribution of $A576 million, down 31 per cent on the prior year, driven by a decline in trading activity in the fourth quarter. The result reflected the impact of the depreciation of the Australian dollar, a strong contribution from the commodities platform, challenging credit market conditions particularly in the northern hemisphere and non-recurrence of fee income from the Freeport LNG Terminal transaction recognised in the prior year. Energy Markets was a significant contributor to CFM’s overall result with revenues generated across the global energy platform, particularly from Global Oil and North American Gas and Power, as continued volatility in global commodity prices underpinned increased customer activity. Further provisions for impairment were taken on certain underperforming commodity-related loans in the Metals and Energy Capital portfolio.