
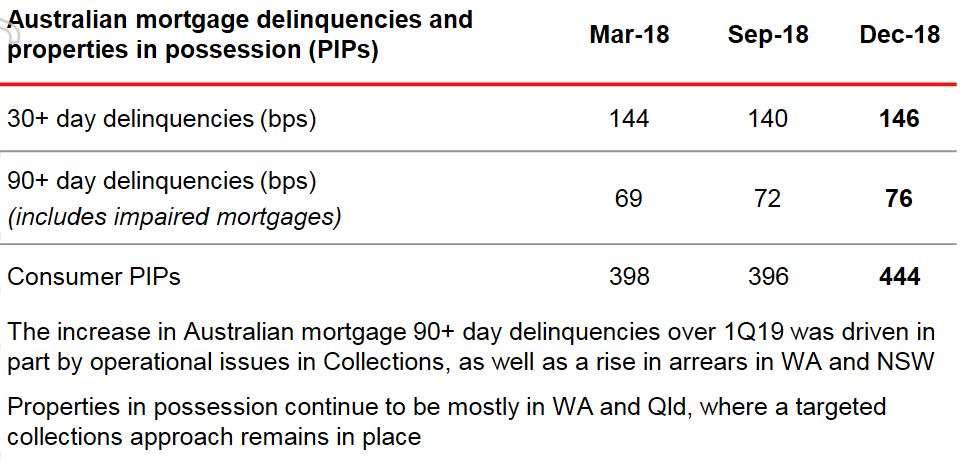
Westpac released their Pillar 3 report for December 2018, plus data on asset quality funding and capital. Of most interest to me was their mortgage data, which shows loan volume growth slowing, and rising delinquencies. The number of properties in possession rose from 396 to 444 in a quarter!
They said their audited statutory net profit for 1Q19 was $1.95 billion, comparable to 2H18.
They reported net interest margins excluding treasury was higher following repricing last year. There was a weaker contribution from treasury.
Provisions were $4,066 million compared with Sep 18’s $3,053.

On 1 October 2018 Westpac adopted AASB 9 and AASB 15. The models for implementation of these standards are still to be finalised and so current changes associated with implementation are preliminary and may change. These will be finalised with Westpac’s First Half 2019 results.
Some transitional impacts from the adoption of AASB 9 have included: i) an increase in collectively assessed provisions of $974 million; ii) a reduction in retained earnings and an increase in deferred tax assets; iii) a $3.9 billion reduction in risk weighted assets; iv) a rise in reported stressed assets; and• v) a 2 basis point increase in the CET1 capital ratio.
Impairment charge was $204 million. $30m pre-tax in insurance claims for Sydney hailstorms are expected.
Westpac showed the slowing in mortgage lending we are seeing across the majors.

Mortgage Interest only lending was 32% of portfolio at 31 Dec 2018 (down from 35% at 30 Sep 2018). Investor lending growth, using APRA extended definition, 0.8% pa

They have a portfolio of IO loans, some at 10 years plus. 16% expire this year.

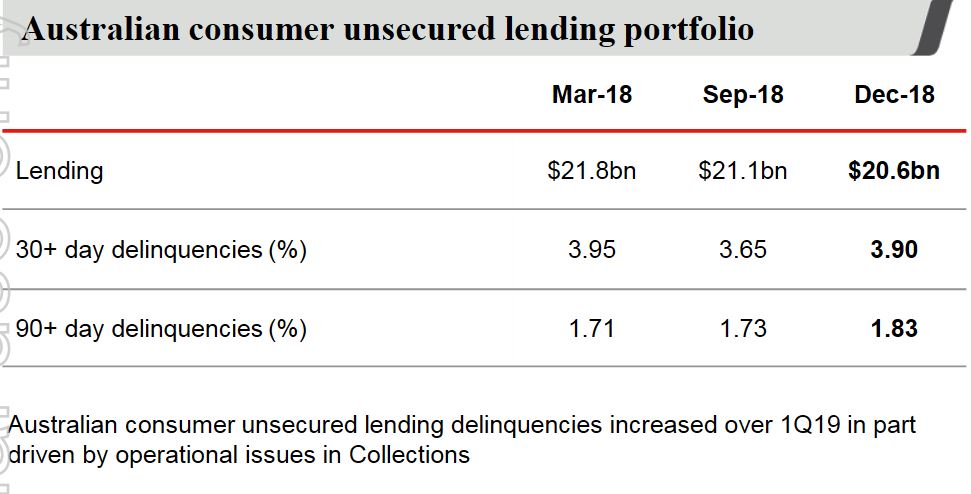
Australian mortgage delinquencies were 4 basis points higher over the quarter while Australian unsecured delinquencies were also higher, up 10 basis points. The number of properties in possession rose from 396 to 444 in a quarter!


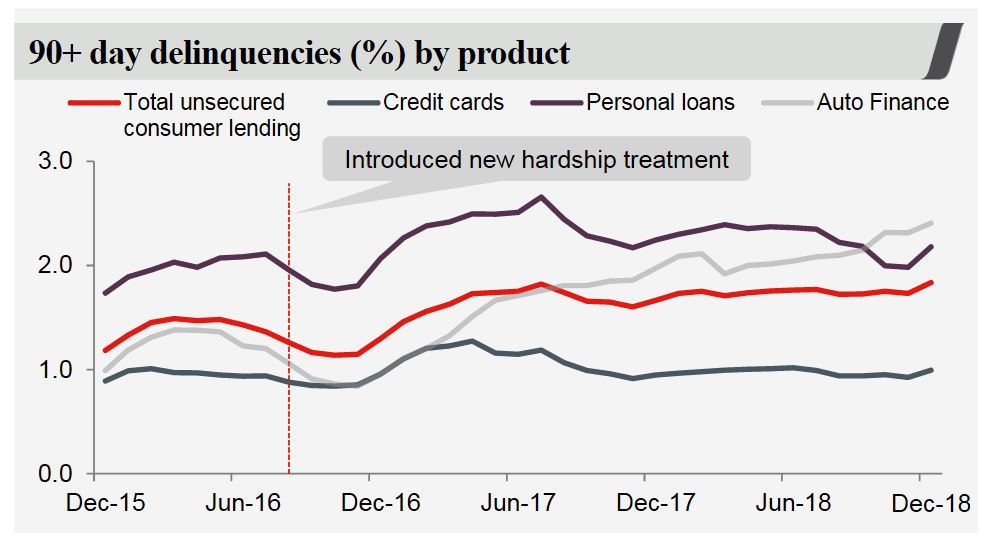
Australian unsecured 90+ day delinquencies increased to 1.83% (up 10bps over the quarter)

The Group’s common equity Tier 1 (CET1) capital ratio was 10.4% at 31 December 2018. The ratio was lower than the 10.6% reported for September 2018 after payment of Westpac’s final dividend (net of DRP), which reduced the CET1 capital ratio by 69 bps. Excluding the dividend payment, the CET1 capital ratio increased 49 basis points.

Liquidity coverage ratio (LCR) 128%, net stable funding ratio (NSFR) 112%
$16bn of term funding was raised during 4 months to 31 January 2019
Finally, a warning about capital.
Australia’s big banks may struggle to raise the amount of extra capital they require under new rules proposed by the country’s banking regulator, a senior executive at Westpac Banking Corporation said in an interview published on Monday.
The mooted requirements, which the country’s four largest lenders said would mean they need to raise between A$67 billion and A$83 billion over four years ($48 billion to $60 billion) are sound in principle but tough to achieve, Westpac treasurer Curt Zuber told the Australian Financial Review newspaper.
“As we go through cycles, it is potentially problematic for the banks to get the volumes they need in an economic way for the system which allows for the balance we want to achieve,” he said.