The latest DFA household survey results for May 2020, from our rolling 52,000 survey reveals a slight fall in households in mortgage stress, from over 38% last month to 37.5%. This still means 1.4 million households are experiencing cash flow issues, despise the Government support programmes and Bank repayment holidays. The full pack is available for download.
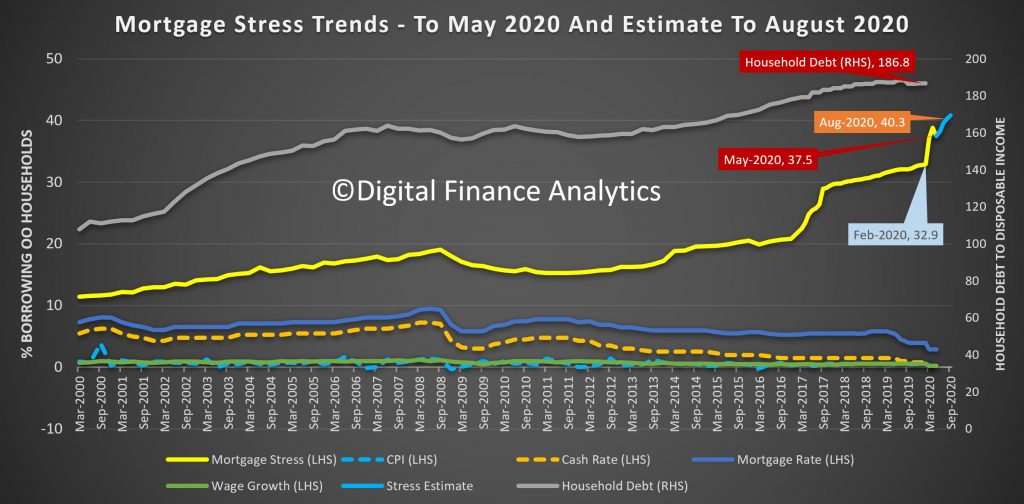
Before COVID, the rate was up to 32.9%, thanks to rising costs and flat incomes, and the rate would have been significantly higher without JobSeeker, JobKeeper and Bank repayment holidays. Ahead, of the September “cliff” when the supports are removed we are projecting a further rise to 40.3%, though if the supports are tapered, this might be lower in reality.
To assess mortgage stress we do not use a set percentage of income going on mortgage repayments, rather we look at total cash flow – money in and money out. If households are under water they are deemed to be in stress. More than 10% under water, then severe stress. Of course they may have assets like deposits, or put more on credit cards, but generally households under pressure spend less, hunker down, and some, 2-3 years later end up selling or even defaulting. Stress indicators are an early warning sign of potential issues ahead.
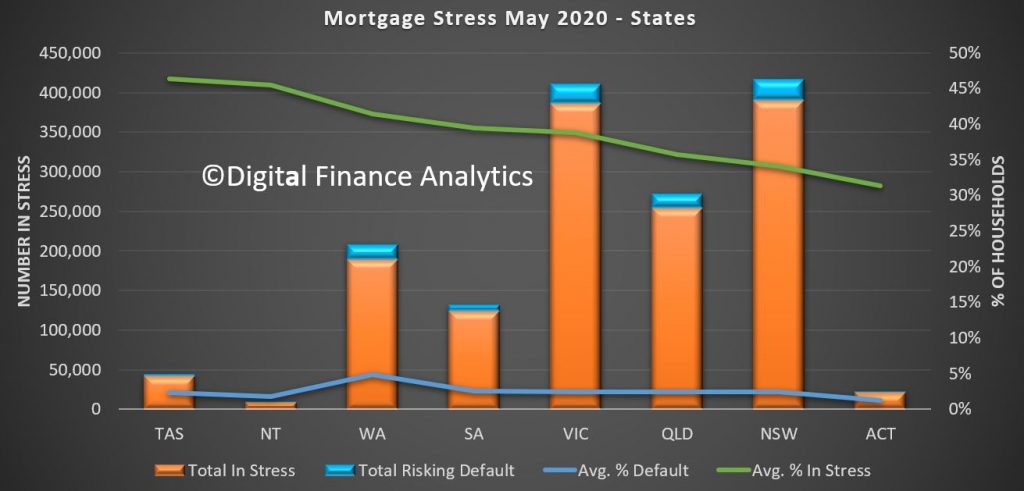
Across the states, Tasmania has highest proportion of households in stress (a function of lower incomes,recently rising home prices and mortgages and a stalled tourist sector in the state). The largest counts are found in NSW and VIC, whereas the highest default projection rates are found in WA.
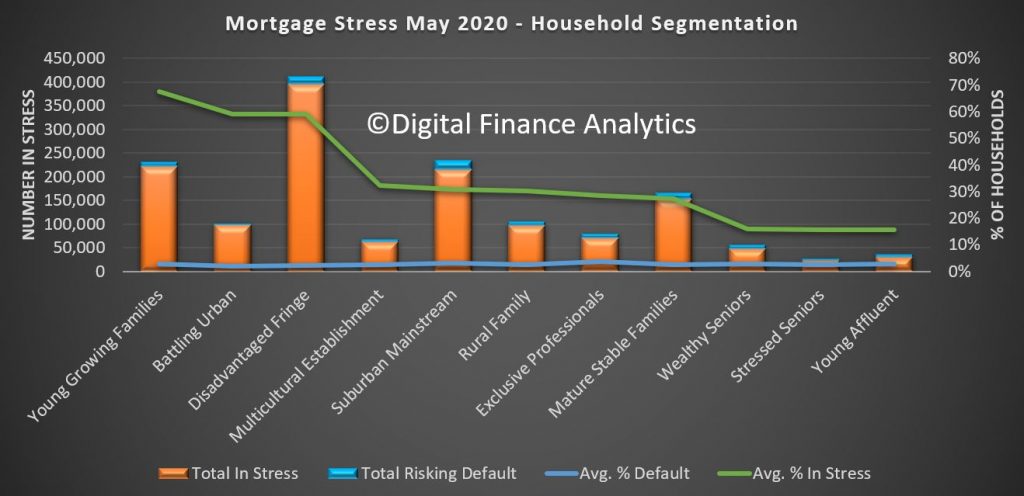
Across our segments, young growing families, including first time buyers, are the most stressed. However we also see a rise in “affluent stress”
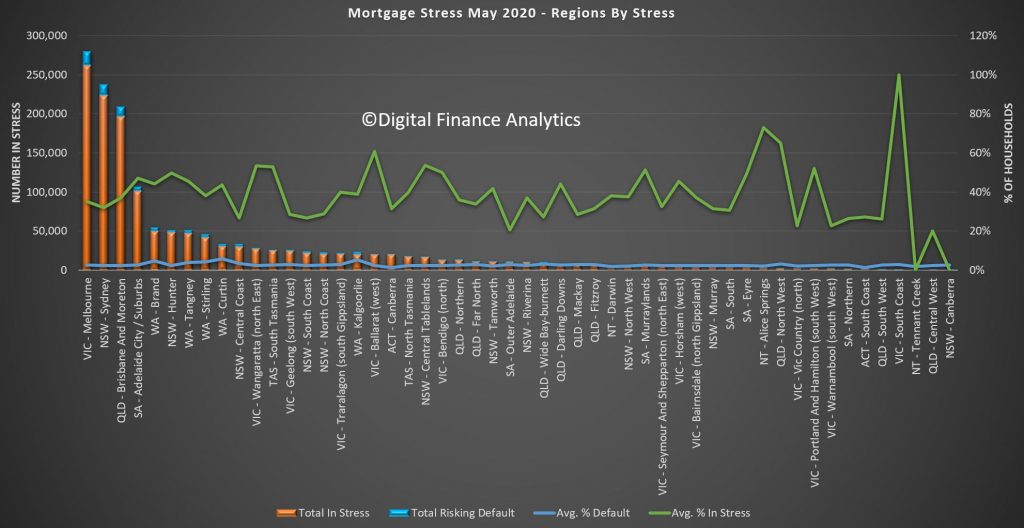
Stress exists across the regions, this is not just a major City story. In fact some of the most stressed areas include regional Victoria and New South Wales. The percentages of households in stress do vary.
Nationally the most stressed post codes include Ballarat 3350, Hillside and Sydneham 3037, 6030 which includes Clarkson and Tamala Park, and 3030 Werribee and Point Cook. Many of these areas include large swathes of relatively newly built property on small urban estates. Cranbourne 3977 carries the largest number of households risking default.
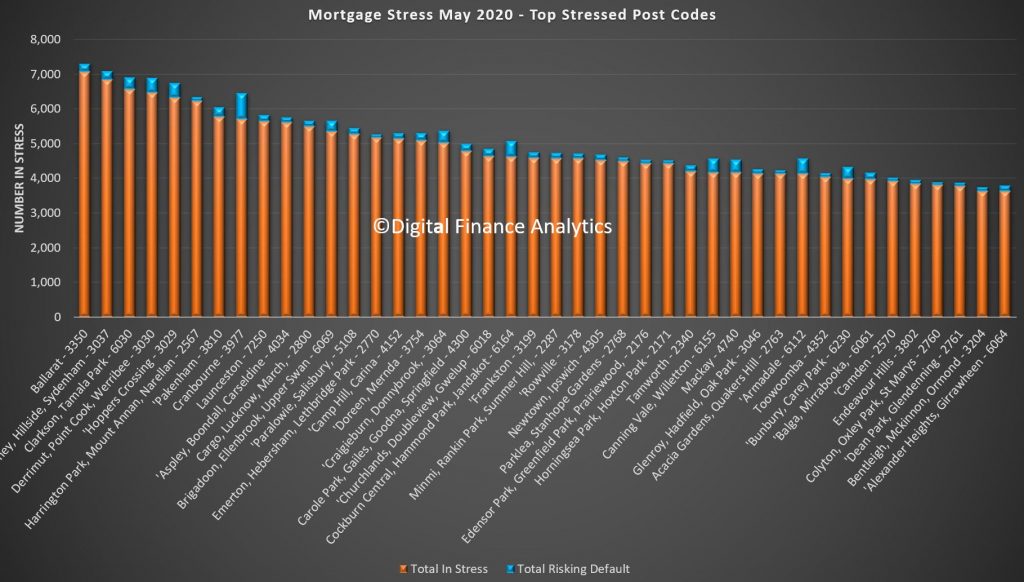
You can look at the detail behind our analysis. Click on the image to load or save the PDF file. You will need to have Acrobat installed.
You can also watch our live show where we discuss mortgage stress and report on a range of individual households.
Finally, I discussed our research with Nucleus Wealth in their Podcast Series:
