
NAB has released their FY16 results. Given the transactions in the year (the effect of the operations and loss on sale for both CYBG and 80% of NAB Wealth’s life insurance business), we have to read these results carefully.
Cash earnings were $6.48 billion, an increase of $261 million or 4.2%, and above expectations. They were helped by lower tax on foreign businesses, as well as provisioning adjustments and trading related income. CET1 ratio at 9.8% was higher than expected.
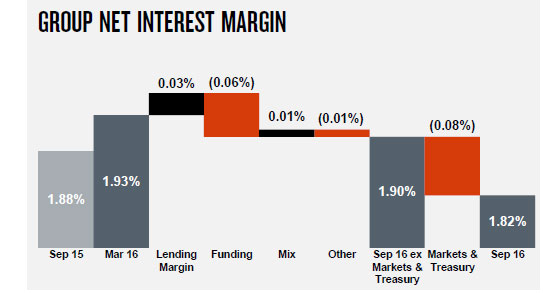
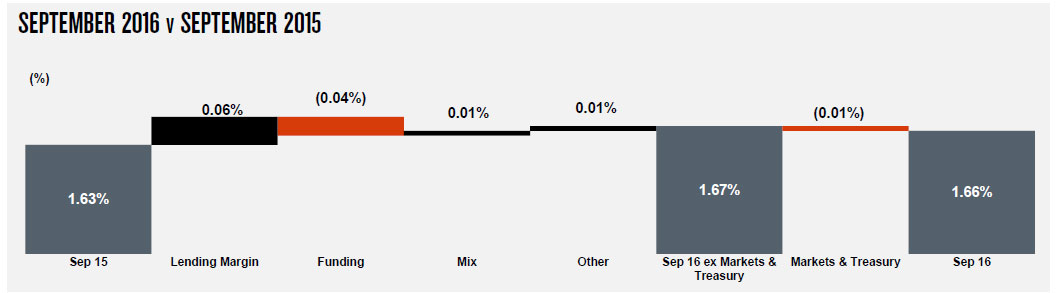
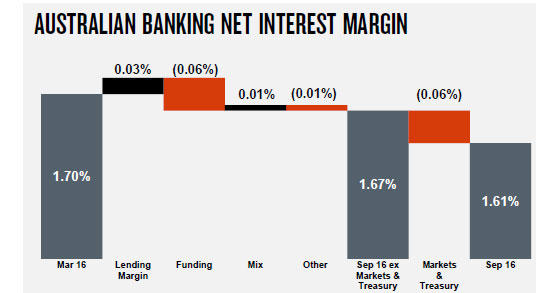
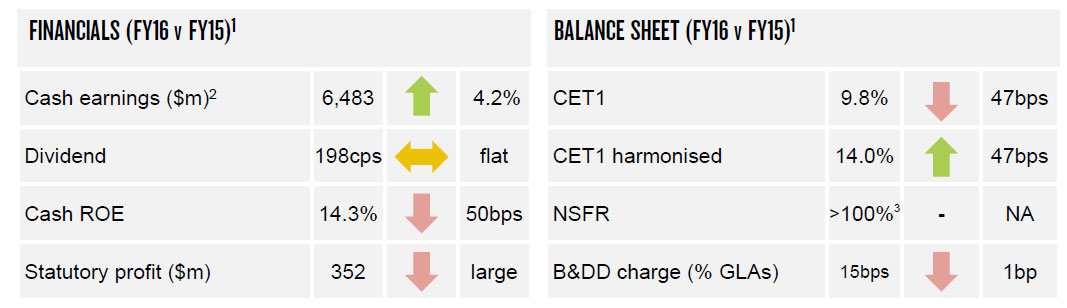 However, the group net interest margin fell 2 basis point, thanks to higher funding and treasury costs.
 The cash ROE was 14.3%, down 50 basis points.
On a statutory basis, net profit attributable to the owners of the Company was $352 million, down 94.4% reflecting the loss on sale for both CYBG and 80% of NAB Wealth’s life insurance business. Excluding discontinued operations, statutory net profit decreased 5.6% to $6.42 billion.
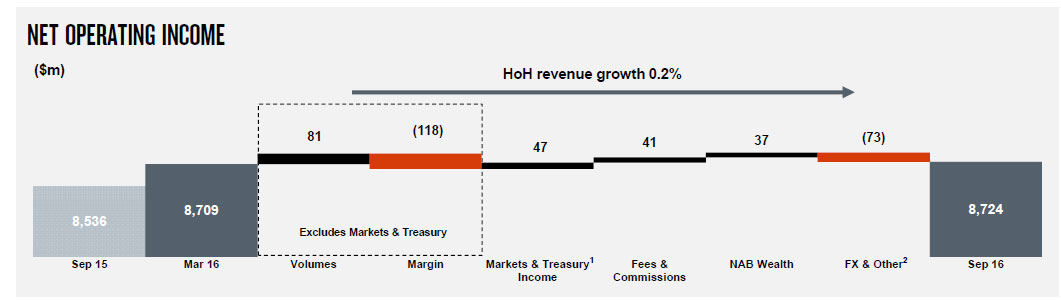
On a cash earnings basis, Revenue increased 2.5%. Excluding gains in the March 2015 half year from a legal settlement and the UK Commercial Real Estate loan portfolio sale and SGA asset sales, revenue rose approximately 3.7%, benefitting from higher lending balances and stronger Markets and Treasury income. Group net interest margin (NIM) declined 2 basis points mainly due to higher funding costs.
Expenses rose 2.2%. Key drivers include higher personnel costs and increased technology related amortisation and project spend, partly offset by productivity savings. Expenses in the September 2016 half year were tightly managed, declining 1.9% compared to the March 2016 half year.
 The charge for Bad and Doubtful Debts (B&DDs) rose 7.0% to $800 million. The increase primarily reflects higher specific charges relating to the impairment of a small number of large single name exposures in Australian Banking.
The ratio of Group 90+ days past due and gross impaired assets to gross loans and acceptances of 0.85% at 30 September 2016 was 7 basis points higher compared to 31 March 2016 mainly reflecting increased impairment of New Zealand dairy exposures of which the majority are currently classified as no loss based on collective provisions and security held.
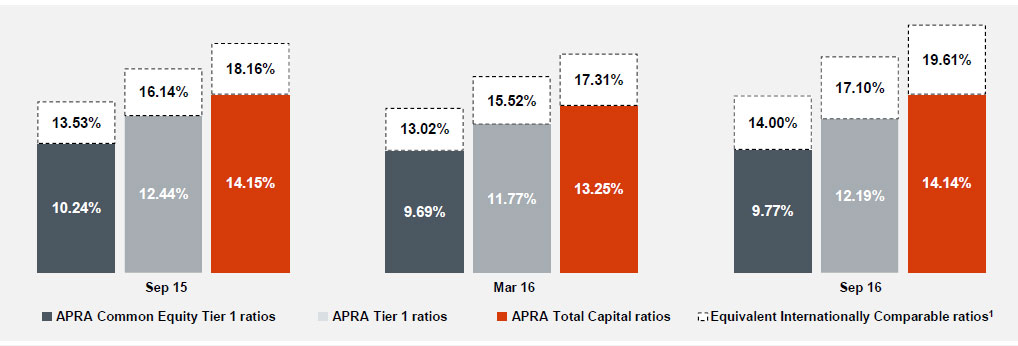
The Group’s Common Equity Tier 1 (CET1) ratio was 9.8% as at 30 September 2016, an increase of 8 basis points from 31 March 2016 reflecting the sale of 80% of NAB Wealth’s life insurance business and strong capital generation, largely offset by the impact of higher mortgage risk weights from 1 July 2016. The Group’s CET1 target ratio remains between 8.75% – 9.25%, based on current regulatory requirements.
 The final dividend is 99 cents per share fully franked, unchanged from the 2016 interim and 2015 final dividends.
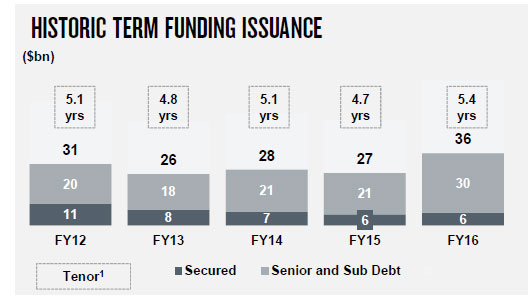
The Group maintains a diversified funding profile and has raised $36.4 billion of term wholesale funding in the 2016 financial year. The weighted average term to maturity of the funds raised by the Group over the 2016 financial year was 5.4 years.
 The stable funding index was 91% at 30 September 2016, 2 percentage points higher than at 31 March 2016.
The Group’s quarterly average liquidity coverage ratio as at 30 September 2016 was 121%.
Looking at the segmentals:
Australian Banking cash earnings were $5,472 million, an increase of 7% reflecting higher revenue and lower B&DD charges. Revenue rose 5% benefitting from stronger Markets and Treasury performance, combined with higher volumes of housing and business lending and a 3 basis point lift in NIM, year on year. Home lending in Australia grew above system in recent months, having been below the market earlier in the year.
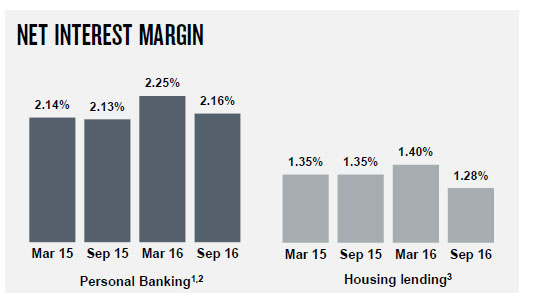
 Housing NIM declined in the second half, though this includes the impact of cost of funds methodology changes between Housing Lending and Deposits products, resulting in a 4bps NIM decline in the Sep 16 half year. However they also said, post the August cash rate cut, margins in the mortgage book have improved, around 15 basis points.
 Personal Banking NIM includes the impact of this cost of funds methodology changes between Housing Lending and Deposits products, resulting in a 2bps NIM decline in the Sep 16 half year.
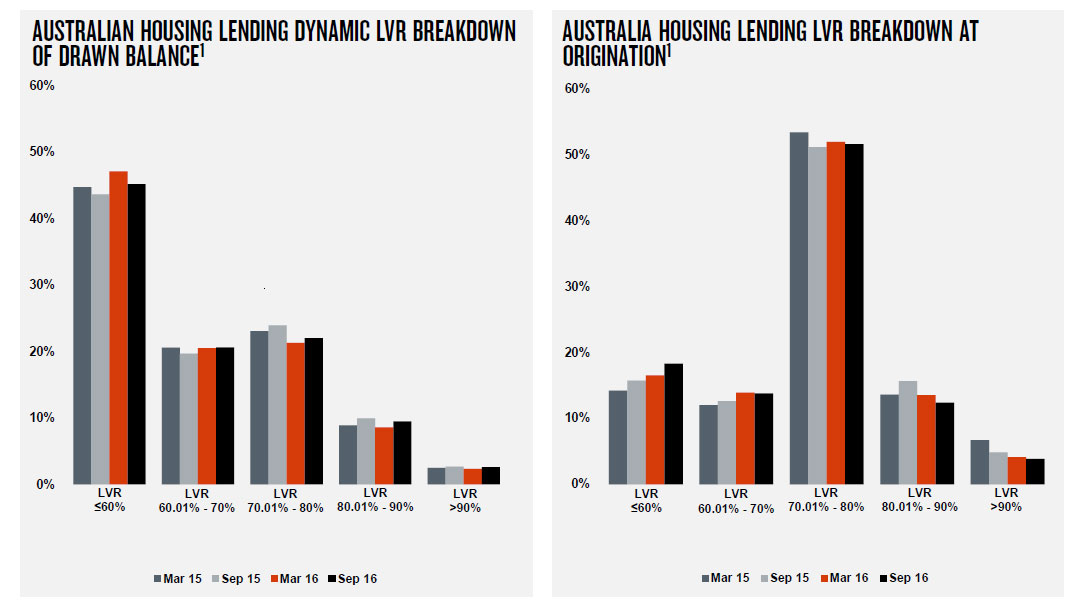
 Looking in more detail at their mortgage book, 31.9% of home loans are interest only. The average portfolio LVR is 45.1% on a dynamic basis. 34.4% of loans are via brokers, and 42.3% of loans are for investment purposes.
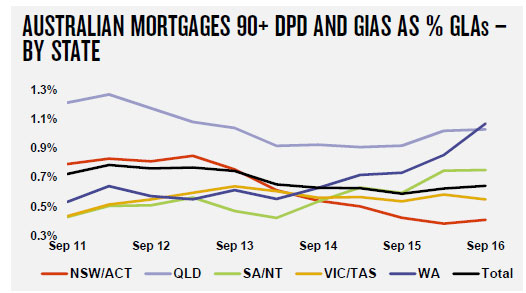
 Past 90 day home loan delinquency shows a rise in WA, but only a small lift across the portfolio to 0.52%. Loss rate is 0.03%, up slightly from March 2016.
 62.3% of home loan borrowers are paid ahead, and the average number of months ahead is 15.
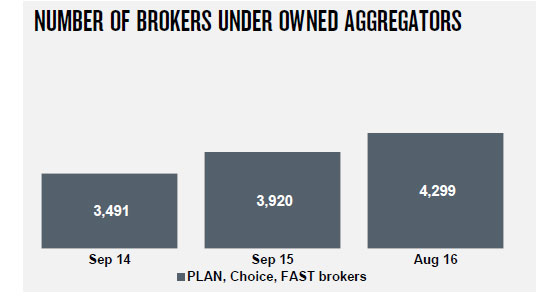
NAB has 4,299 brokers under their owned aggregators.
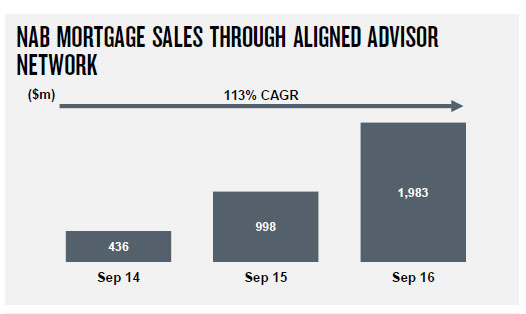
 They also source mortgages via their aligned advisor network.
 Revenue for Business Banking increased 2% and for Personal Banking increased 7%. Expenses rose 4% due mainly to personnel cost increases, but over the September 2016 half year decreased 1%. B&DD charges of $639 million fell 4% reflecting improved credit quality in the broader business lending portfolio partly offset by higher specific charges arising from a small number of large single name impairments.
NZ Banking local currency cash earnings of NZ$836 million rose 2% over the year. The key drivers were improved revenue and lower B&DD charges reflecting favourable economic conditions outside the dairy sector. Revenue rose 1% with improved lending volumes and fee income, partly offset by a decline in NIM due to competitive pressure and higher funding costs. Expense growth was contained to 1% despite continued investment in the Auckland focused growth strategy.
NAB Wealth cash earnings increased 13% to $356 million reflecting stronger revenue and lower expenses. Net income rose 2% benefitting from higher average funds under management (FUM), up 12% given strong investment markets, positive net funds flow and the inclusion of JBWere FUM from January 2016. Expenses declined 4% reflecting lower regulatory and compliance spend combined with tight control of discretionary costs.