
The February data from APRA for ADI’s and the credit aggregates from the RBA were released today. The headline news is the rate of housing credit growth continued to slow.
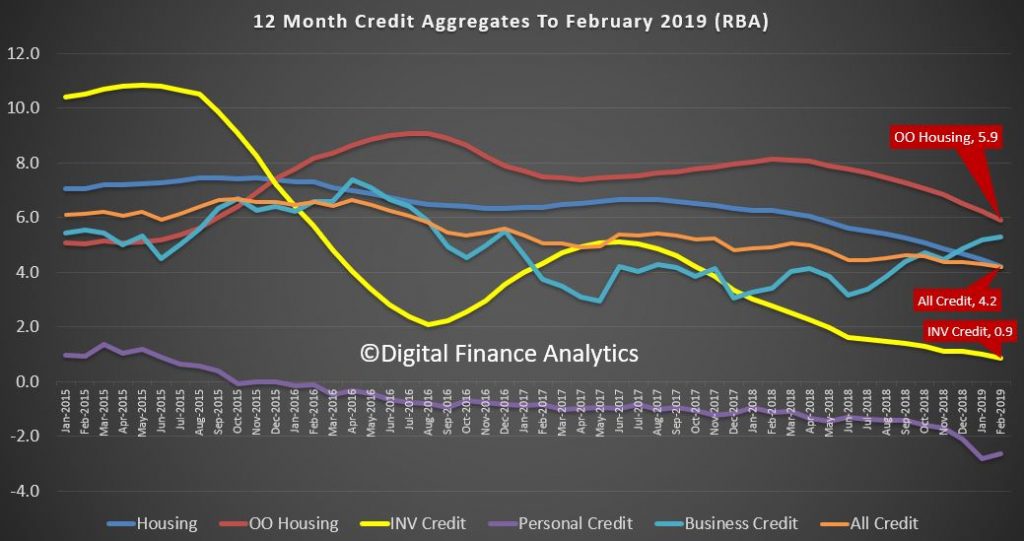
This is quite starkly shown in the RBA’s 12 month series, with total credit annualised growth now standing at 4.2%. Housing credit also fell to the same 4.2% level, from 4.4% a month ago. The fall continues. Within the housing series, lending for owner occupation fell below 6% – down to 5.9% and investment housing lending fell to 0.9% annualised.
The seasonally adjusted RBA data showed that last month total credit for housing grew by 0.31%, up $5.6 billion to $1.81 trillion, another record. Within in that owner occupied lending stock rose 0.42%, seasonally adjusted to $1.22 trillion, up $5.11 billion. Lending for investment property rose 0.09%, or $0.5 billion to $595 billion. Personal credit fell slightly, down 0.07% and business credit rose 0.42% to $960 billion, up $4.06 billion.
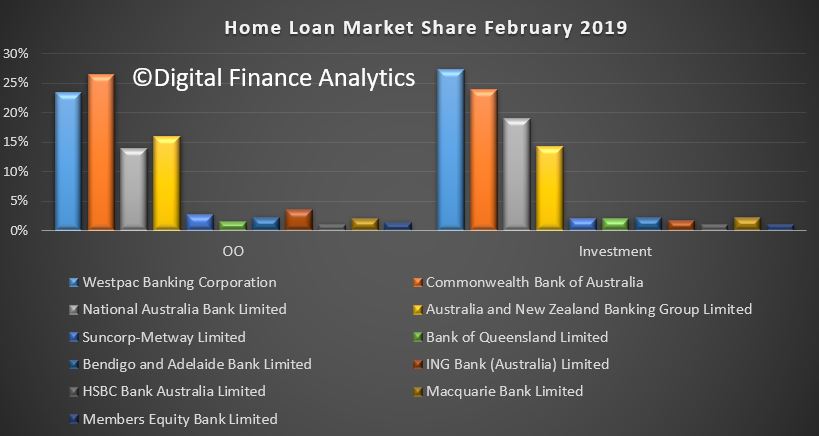
The APRA data revealed that ADI growth was lower than the RBA aggregates. Some of this relates to seasonal adjustments plus, as we will see a rise in non-bank lending. The proportion of investment loans less again to 33.3% of loans outstanding.
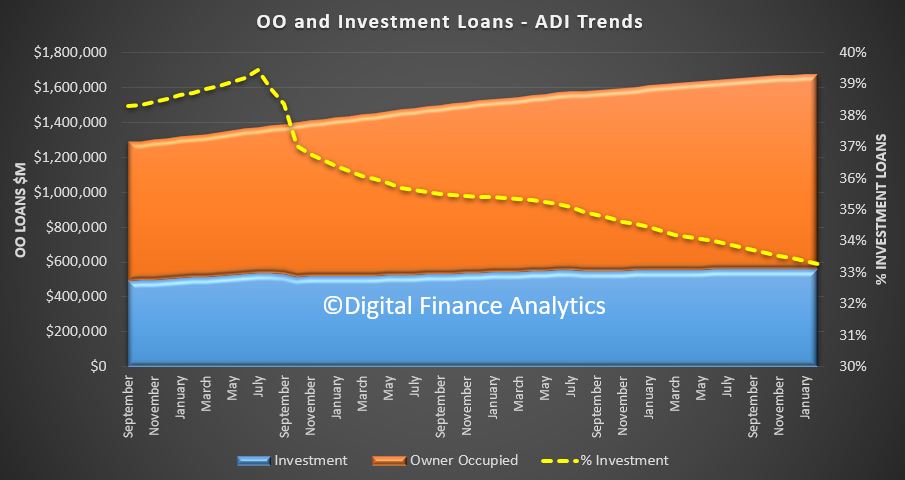
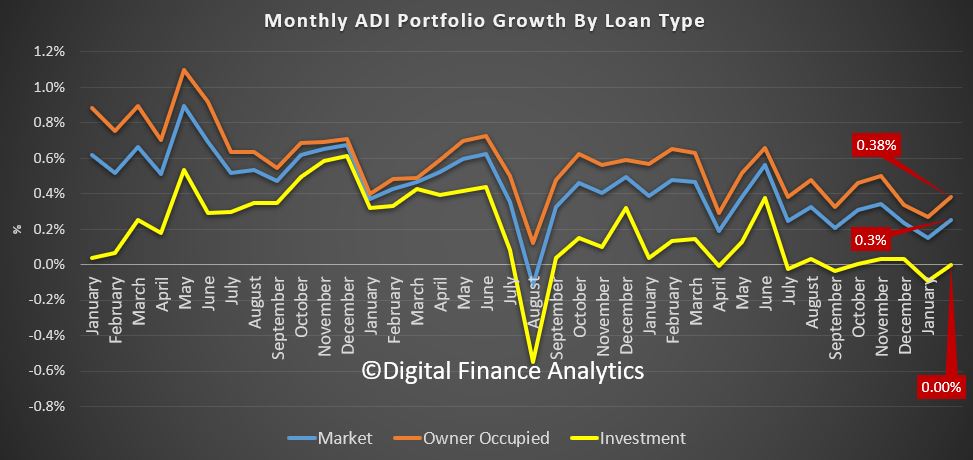
Total owner occupied loans were $1.11 trillion, up 0.38%, or $4.2 billion, while investor loans were $557 billion, flat compared with last month. This shows the trends month on month, with a slight uptick in February compared to January, as holidays end and the property market spluttered back to life. The next couple of months will be interesting as we watch for a post-Hayne bounce in lending and more loosening of the credit taps, but into a market where demand, is at best anemic.
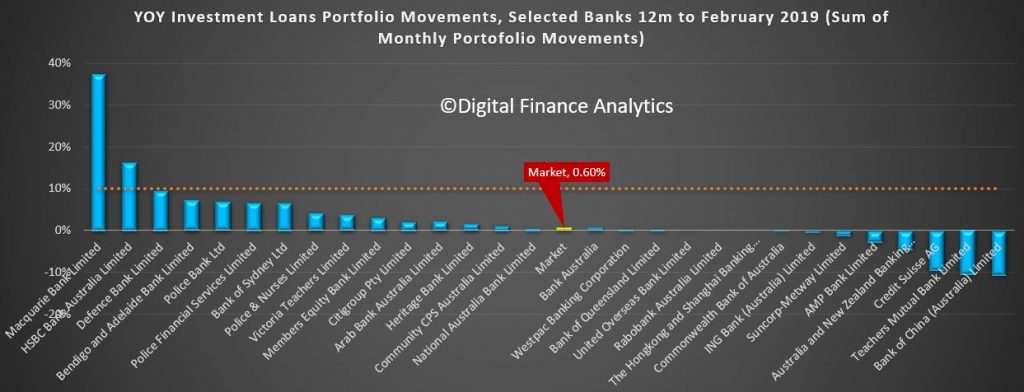
The portfolio movements are interesting (to the extent the data is reported accurately!), with HSBC growing its footprint by more that one billion across both investor and owner occupied lending. Only Westpac, among the big four grew their investor loans, with ANZ reporting a significant slide (no surprise they said they had gone too conservative, and recently introduce a 10-year interest only investor loan). Macquarie and Members Equity grew their books, with the focus on owner occupied loans.
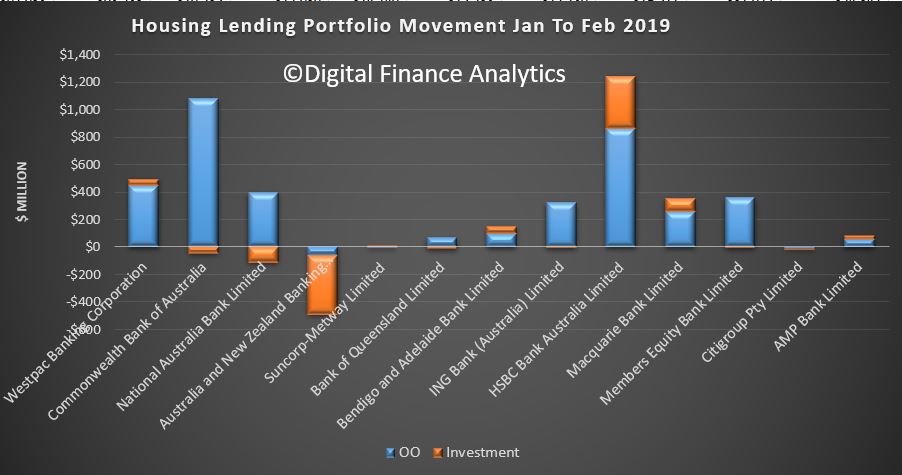
The overall portfolios did not vary that much, with CBA still the largest owner occupied lender, and Westpac the largest investor lender.
The 12 month investor tracker whilst obsolete in one sense as APRA has removed their focus on a 10% speed limit, is significant, in that the market is now at 0.6% annualised.
But the final part of the story is the non-bank lending. This has to be derived, and we know the RBA data is suspect and delayed. But the gap between the RBA and APRA data shows the trends.
Non Bank annualised owner occupied credit is growing at 17.6%, and investor lending at 4.8%. It is clear the non-banks, with their weaker capital requirements, and greater funding flexibility are making hay. Total non bank credit for housing is now around $142 billion or around 7.8% of housing lending. This ratio has been rising since December 2016, and kicked up in line with the tighter APRA rules being applied to the banks.
We have out doubts that APRA is looking hard enough at these lending pools, especially as we are seeing the rise of higher risk “near-prime” offers to borrowers who cannot get loans from the banks.
So to conclude the rate of credit momentum continues to ease – signalling more home prices ahead. The non-banks sector, currently loosely regulated by APRA is growing fast, and just the before the US falls around the GFC, risks are higher here. And finally, and worryingly, household debt is STILL growing… so more stress and financial pressure ahead.
Meanwhile, look at all the newspapers talking about all the $12 million sales of homes around Bondi. Also how one couple only ONE paid over $325,000 on reserve on a house in the North Shore. They make everything seem fine, because Real Estate.com and Domain pay tons of money to advertise with them. Behind the scenes everything is circling the toilet slowly going down the drain, prices, loan applications, credit etc. Start playing the “Hush” song or Coles anthem, “Down down deeper and down” for the Aussie real estate market. But, shhhhh now, maybe no-one will notice. Lets all put our head in the sand and pretend it’s not happening, like the drying up of the Darling River.