
APRA belatedly released their monthly banking statistics to the end of November today. Only a couple of days after the month end, but then who’s counting… (I am!!)
These statistics give us the monthly stock of assets and liabilities by the banks, and as normal we will focus in on the residential mortgage section of the data. We can of course compare this data with that from the RBA, which did come out on the last working day of December, and which we already discussed. See The Debt Machine Is Alive And Well
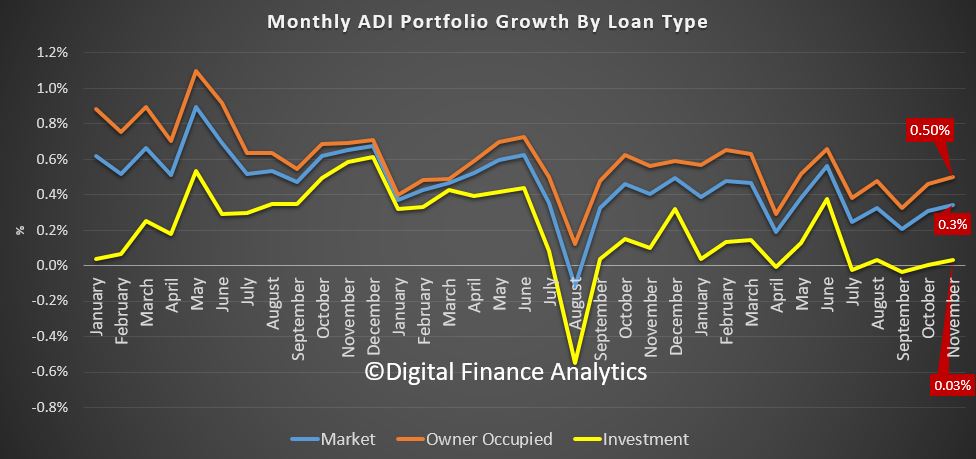
According to APRA, the original mortgage loan portfolios for the banks rose by 0.344%, or $5.69 billion over the month to a new record of $1.664 trillion dollars. Within that, owner occupied loans rose by 0.5% or $5.5 billion dollars to $1.1 trillion dollars, while loans for property investment rose 0.034%, or $188 million to $557.6 billion. 33.52% of all loans are for investment purposes, and this continues to slide, given the new market conditions.
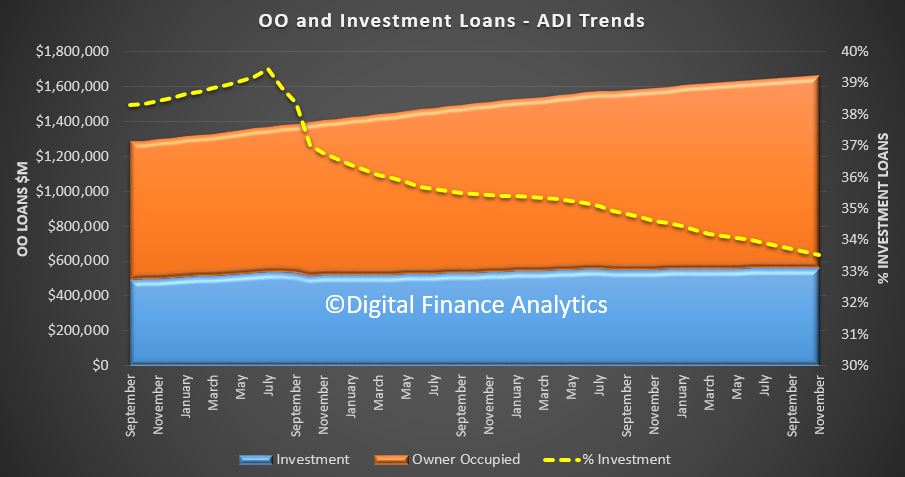
The monthly trend tracker highlights that owner occupied loans are growing significantly faster than investment loans.
Looking at the monthly portfolio movements among the banks, we see that among the big four, Westpac and ANZ saw a significant fall in the value of their investment loan portfolio, while CBA and NAB grew theirs. Macquarie continues to stand out as a lender writing a significant share of investment loans. CBA wrote the largest share of owner occupied loans, and we also see ING also focussing on owner occupied loans.
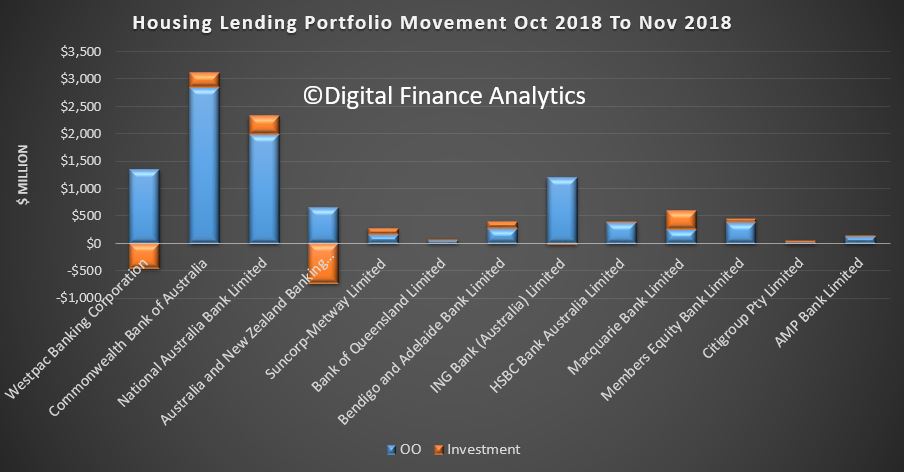
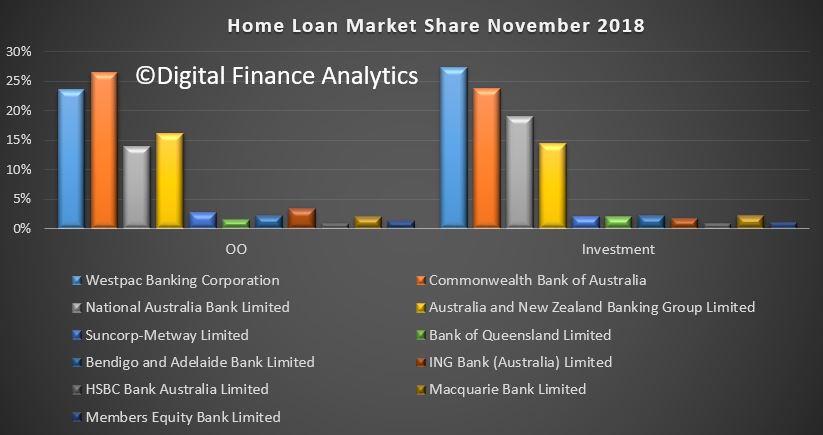
Overall, the banks portfolios are only moving at the margin, with CBA maintaining its position as the largest owner occupied lender, and Westpac the largest investor lender.
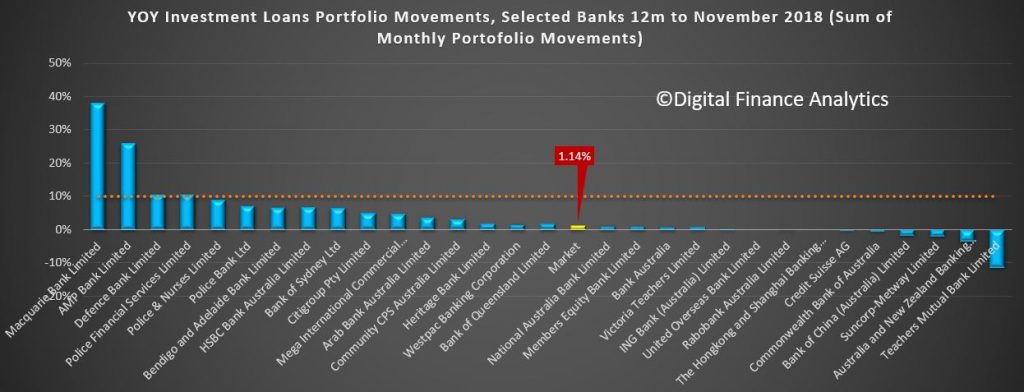
One other interesting (if obsolete) view is the relative growth in investor lending over the past 12 months. This was a focus of APRA but of course is now not being actively used as a control tool. Nevertheless, the data shows that AMP and Macquarie stand out with the largest portfolio growth, to November, while some of the majors are now in negative territory, including ANZ and CBA. Bendigo and Adelaide Bank are writing a greater relative share than the majors now. The market average across the year (sum of the monthly movements now stands at 1.14%. What a difference from a couple of years ago, APRA’s macroprudential intervention has certainly had an effect, despite being several years too late!).
One final data point, we can estimate the relative share of non-bank lending by comparing the RBA data and the APRA data. As discussed before this is tricky, given the delays in the non-bank data, and the fact that not all the non-banks are included in the dataset. That said, we can use the DFA tracker to show the relative movement between the banks and non-banks.
This makes interesting reading, and underscores that fact that the non-banks have been growing faster than the ADI’s in recent times. Non-Bank owner occupied annual lending is running at around 15.6% compared with a year ago, while investor lending grew around 1.9%. This compares with the market average from the RBA of 0.9% for investor lending and 6.4% for owner occupied lending. Its fair to conclude therefore than non-banks are lending like fury, compared with the ADI’s, a symptom of easy non-bank funding, different capital requirements, and a greater willingness to lead.
This is a sure sign of more trouble ahead, as we know that some borrowers rejected by the banks, because of their not meeting the tighter lending standards now in force are being swept up by the non-banks, where they often will pay a higher mortgage rate! This is something I discussed with Tony Locantro in our recent video – from first hand experience!.