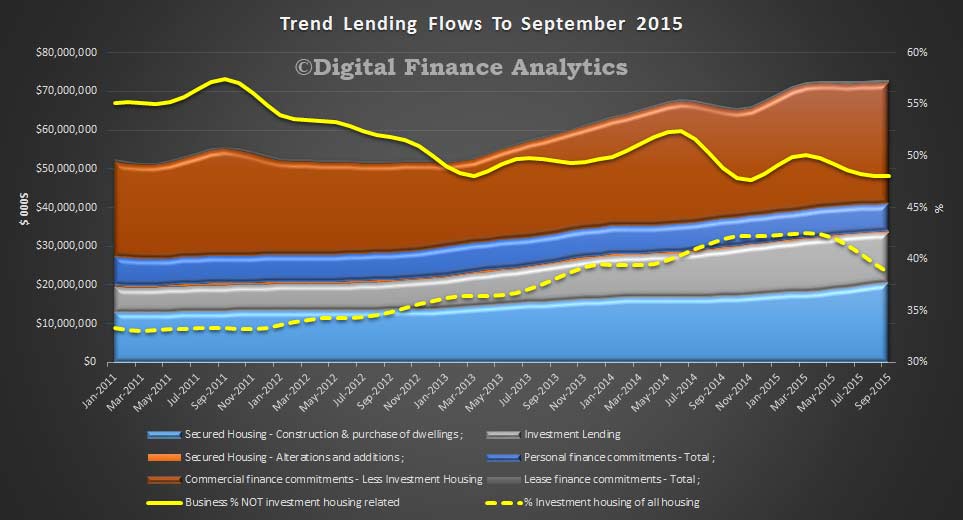
The data from the ABS today, provides a view of all finance for September, and contains a number of significant points. Trend data (which irons out the noise month by month) shows that lending for owner occupied housing was $20.6 bn, up 2% from last month ($20.2 bn). Personal finance was down 1.1% from $7.3 bn to $7.2 bn, whilst commercial finance – which includes investment home lending – was down by 0.4% from $44.4 bn to $44.3 bn.
However, looking in more detail, and separating out investment lending from other commercial lending, we see that investment housing was $12.9 bn, down from $13.2 bn last month. The relative proportion of new loans for investment housing in the month sat at 38.6%, down from 39.6% last month. So owner occupied lending is now dish of the day.
We also see that business lending, net of investment housing, fell from 48.1% to 48%, although the value rose a little from $31.2 bn to $31.3 bn. We continue to see the relative share of lending to the commercial sector falling, which is not healthy for future growth prospects. The banks prefer to lend against residential property as the current capital adequacy ratios still makes this more attractive than commercial lending, and loss rates are lower, so net margins remain strong. Firms are still holding off from investing, and many who would borrow are finding the terms, and costs prohibitive. We will discuss this further in the next report on the business sector, to be released shortly.
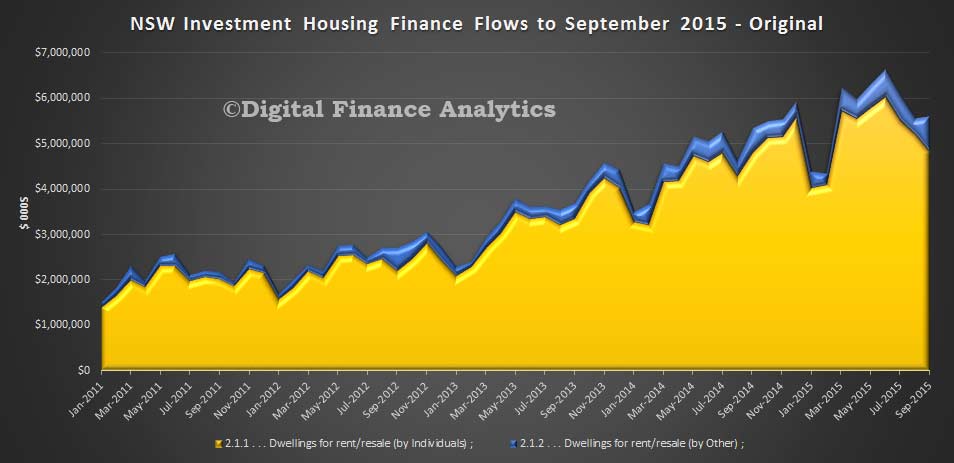
The other data point, which is quite stunning, is the fall in investment lending in NSW. Looking at the original data we see that it fell from a peak monthly flow of more than $6 bn in June to $5.5 bn, supported by a relative growth in investment by entities other than individuals, which would include self-managed superannuation funds and other commercial entities. Momentum looks set to fall further, in the investment sector, whilst owner occupied lending is set to grow. Indeed the trend line for owner occupied loans in the graph above, shows a clear movement up, as banks reset their sites on attracting owner occupied business and refinance – this explains all the heavy discounts currently available for owner occupied loans in the market at the moment, funded by hikes in rates to existing borrowers.