Fitch Ratings “Global Housing and Mortgage Outlook” suggests House price growth is expected to moderate across the Asia-Pacific region in 2015, driven by government regulatory pressures, tightened affordability and gradual interest-rate rises. The growth slowdown will be led by Australia, where national house prices are forecast to rise 4% in 2015, down from 7% in 2014, and in Hong Kong, where Fitch expects prices to be flat as compared to the 10% growth in 2014.
These forecasts are featured in Fitch’s latest Global Housing and Mortgage Outlook, published on 14 January. Of the six APAC countries included in the report, only Korea is expected to have price gains that exceed that in 2014; even then, it is forecast to be just 2%.
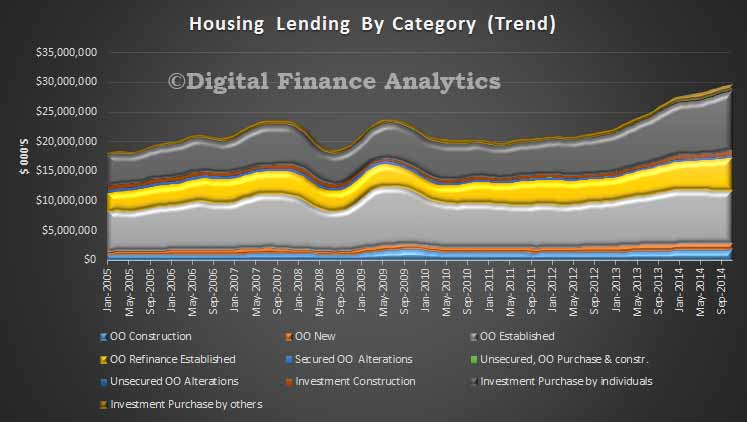
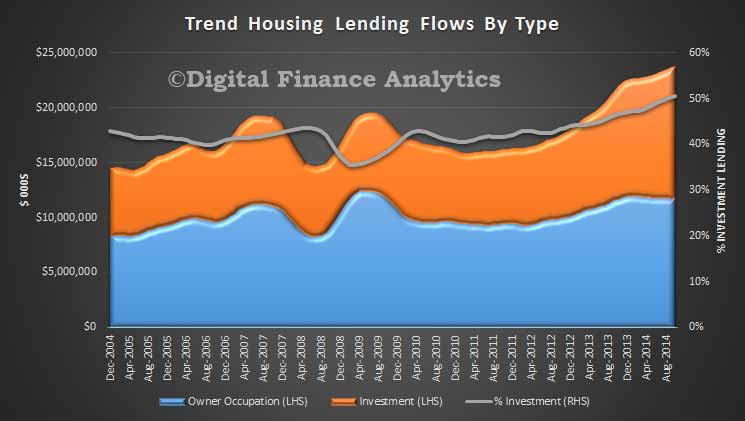
Australia will see house-price increases slow in 2015, down to 3%-4% in Sydney and Melbourne, and flat in Perth. Affordability pressures will remain in Australia’s largest cities, with price rises continuing to outstrip income growth, and home prices approaching the affordability ceiling. Lending volumes will continue to grow as investment activity is expected to remain high; investment loans are expected to continue to account for 50% of new lending. That said, as rental yields drop to less than 3.5%, Fitch stresses that housing investors’ buying sentiment could be vulnerable to weakening if other asset classes offer better returns.
Government policy action, pressured affordability and the likelihood of interest-rate rises in the long term will continue to be key themes for the housing and mortgage outlook in the APAC region. A gradual increase in mortgage rates is expected in 2015 and 2016 in Australia, New Zealand, Hong Kong and Singapore, all of which show relatively high interest rate sensitivity. At the same time, governments and regulatory authorities are targeting soft landings for the housing market in several economies including New Zealand, Hong Kong and Singapore, which have seen rapid price growth over the past decade.
Hong Kong is a case in point, where Fitch believes macro-prudential measures will lead to a marked slowdown in price growth. Home prices are forecast to be to be flat this year versus a 10% increase in 2014, and an average gain of 15% over the previous decade. The government’s cooling measures should stabilise affordability at current levels, though home prices already are highly stretched relative to incomes. Fitch maintains that Hong Kong does risk a downturn, considering the combination of the stretched affordability, rising rates, and the large involvement of speculative investments in the sector.
Similar macro-prudential measures in Singapore and New Zealand are having the desired impact on markets by dampening house price movements.
Singapore and Australia, Japan and South Korea are expected to see government measures to support the housing sector, in contrast to Hong Kong.