This release provides information on the prevalence and nature of adverse impacts from COVID-19 experienced by businesses operating in Australia in mid-March 2020.
Approximately half of the Australian businesses surveyed (49%) had experienced an adverse impact as a result of COVID-19 during the mid-March data collection period and 86% of businesses expected to be impacted in future months. The collection period pre-dated the Australian Government’s announcement of Phase 1 Social Distancing Measures.
Adverse impacts were most prevalent in Accommodation & food services with over three quarters of businesses (78%) already reporting impacts and 96% of businesses reporting that they expected impacts in coming months. Businesses in Professional, scientific & technical services (21%), Electricity, gas and water supply (34%) and businesses in Mining (37%) were the least likely to have been adversely impacted by COVID-19 in the collection period.
A reduction in local demand was the most common impact experienced (82%) and was also the most common impact expected in coming months (81%). Of impacted businesses, over a third had experienced staff shortages (36%) and 59% expected to experience staff shortages in coming months.
The White House and Senate leaders reached a deal early Wednesday morning USA time on a massive stimulus package they hope will keep the nation from falling into a deep recession because of the coronavirus crisis, reports The Hill.
The agreement caps five days of intense negotiations that started Friday morning when Senate Majority Leader Mitch McConnell
(R-Ky.) convened Republican and Democratic colleagues, with talks
stretching late into the evening each of the following four days.
The
revamped Senate proposal will inject approximately $2 trillion into the
economy in the form of tax rebates, four months expanded unemployment
benefits and a slew of business tax-relief provisions. The deal includes
$500 billion for a major corporate loan program through the Federal
Reserve, a $367 billion small business rescue package, $130 billion for
hospitals and $200 billion for other “domestic priorities,” such as
transportation, veterans, child care and seniors.
The
bill will give a one-time check of $1,200 to Americans who make up to
$75,000. Individuals with no or little tax liability would receive the
same amount, unlike the initial GOP proposal that would have given them a
minimum of $600.
“At last we have a
deal. … the Senate has reached a bipartisan agreement,” McConnell
declared during a speech on the Senate floor after 1:30 a.m.
“We are going to pass this legislation later today,” he added.
Hundreds of billions of dollars
in buffer capital for the Treasury Department will allow the Fed to hand
out an additional $4 trillion in loans to distressed companies such as
U.S. airlines and Boeing, the nation’s leading airplane manufacturer.
Their stocks have been hit the hardest in the recent stock-market
selloff that had erased the gains made since President Trump took
office.
The Fed loan program,
which Democrats bashed as a corporate bailout program and Mnuchin’s
“slush fund,” was one of the biggest sticking points during the late
rounds of the negotiations.
Republicans
argued the Treasury Department needed $500 billion to help the Fed
inject enough liquidity into the economy, while Democrats were enraged
over a provision they said would let Mnuchin provide loans and
guarantees and then wait six months before disclosing who got the
assistance.
The S&P 500 Futures was little changed after the news.
This trifecta of risks – uncontaminated medical emergencies, insufficient economic-policy arsenals, and geopolitical white swans – will be enough to tip the global economy into persistent depression and a runaway financial-market meltdown. After the 2008 crash, a forceful (though delayed) response pulled the global economy back from the abyss. We may not be so lucky this time.
From Project Syndicate. The shock to the global economy has been both faster and more severe than the 2008 global financial crisis (GFC) and even the Great Depression. In those two previous episodes, stock markets collapsed by 50% or more, credit markets froze up, massive bankruptcies followed, unemployment rates soared above 10%, and GDP contracted at an annualized rate of 10% or more. But all of this took around three years to play out. In the current crisis, similarly dire macroeconomic and financial outcomes have materialized in three weeks.
Earlier
this month, it took just 15 days for the US stock market to plummet
into bear territory (a 20% decline from its peak) – the fastest such
decline ever. Now, markets are down 35%,
credit markets have seized up, and credit spreads (like those for junk
bonds) have spiked to 2008 levels. Even mainstream financial firms such
as Goldman Sachs, JP Morgan and Morgan Stanley expect
US GDP to fall by an annualized rate of 6% in the first quarter, and by
24% to 30% in the second. US Treasury Secretary Steve Mnuchin has warned that the unemployment rate could skyrocket to above 20% (twice the peak level during the GFC).
In other words, every component of aggregate demand – consumption, capital spending, exports – is in unprecedented free fall. While most self-serving commentators have been anticipating a V-shaped downturn – with output falling sharply for one quarter and then rapidly recovering the next – it should now be clear that the crisis is something else entirely. The contraction that is now underway looks to be neither V- nor U- nor L-shaped (a sharp downturn followed by stagnation). Rather, it looks like an I: a vertical line representing financial markets and the real economy plummeting.
Not
even during the Great Depression and World War II did the bulk of
economic activity literally shut down, as it has in China, the United
States, and Europe today. The best-case
scenario would be a downturn that is more severe than the GFC (in terms
of reduced cumulative global output) but shorter-lived, allowing for a
return to positive growth by the fourth quarter of this year. In that
case, markets would start to recover when the light at the end of the
tunnel appears.
But the best-case scenario assumes several conditions. First, the US, Europe, and other heavily affected economies would need to roll out widespread testing, tracing, and treatment measures, enforced quarantines, and a full-scale lockdown of the type that China has implemented. And, because it could take 18 months for a vaccine to be developed and produced at scale, antivirals and other therapeutics will need to be deployed on a massive scale.
Second,
monetary policymakers – who have already done in less than a month what
took them three years to do after the GFC – must continue to throw the
kitchen sink of unconventional measures at the crisis. That means zero
or negative interest rates; enhanced forward guidance; quantitative
easing; and credit easing (the purchase of private assets) to backstop
banks, non-banks, money market funds, and even large corporations
(commercial paper and corporate bond facilities). The US Federal Reserve
has expanded its cross-border swap lines to address the massive dollar liquidity shortage
in global markets, but we now need more facilities to encourage banks
to lend to illiquid but still-solvent small and medium-size enterprises.Subscribe now
Third,
governments need to deploy massive fiscal stimulus, including through
“helicopter drops” of direct cash disbursements to households. Given the
size of the economic shock, fiscal deficits in advanced economies will
need to increase from 2-3% of GDP to around 10% or more. Only central
governments have balance sheets large and strong enough to prevent the
private sector’s collapse.
But
these deficit-financed interventions must be fully monetized. If they
are financed through standard government debt, interest rates would rise
sharply, and the recovery would be smothered in its cradle. Given the
circumstances, interventions long proposed by leftists of the Modern Monetary Theory school, including helicopter drops, have become mainstream.1
Unfortunately
for the best-case scenario, the public-health response in advanced
economies has fallen far short of what is needed to contain the
pandemic, and the fiscal-policy package currently being debated is
neither large nor rapid enough to create the conditions for a timely
recovery. As such, the risk of a new Great Depression, worse than the
original – a Greater Depression – is rising by the day.
Unless
the pandemic is stopped, economies and markets around the world will
continue their free fall. But even if the pandemic is more or less
contained, overall growth still might not return by the end of 2020.
After all, by then, another virus season is very likely to start with
new mutations; therapeutic interventions that many are counting on may
turn out to be less effective than hoped. So, economies will contract
again and markets will crash again.
Moreover,
the fiscal response could hit a wall if the monetization of massive
deficits starts to produce high inflation, especially if a series of
virus-related negative supply shocks reduces potential growth. And many
countries simply cannot undertake such borrowing in their own currency.
Who will bail out governments, corporations, banks, and households in
emerging markets?
In any case, even if the pandemic and the economic fallout were brought under control, the global economy could still be subject to a number of “white swan” tail risks. With the US presidential election approaching, the crisis will give way to renewed conflicts between the West and at least four revisionist powers: China, Russia, Iran, and North Korea, all of which are already using asymmetric cyberwarfare to undermine the US from within. The inevitable cyber attacks on the US election process may lead to a contested final result, with charges of “rigging” and the possibility of outright violence and civil disorder
Similarly, as I have argued previously, markets are vastly underestimating the risk of a war between the US and Iran this year; the deterioration of Sino-American relations is accelerating as each side blames the other for the scale of the health emergency. The current crisis is likely to accelerate the ongoing balkanization and unraveling of the global economy in the months and years ahead.
The US has an estimated $16 trillion dollar Market for Residential & Commercial Mortgage-Backed Securities .
The business model of a mortgage REIT is to buy long-term residential and/or commercial mortgage-backed securities and leverage them up by borrowing short-term, including in the repo market if they can, while posting the RMBS or CMBS as collateral. A mortgage REIT makes money off the spread between the borrowing rates and the yields of the mortgage bonds, and they multiply their profits through leverage.
As Wolf Street says, during the Good Times, it was like free money, and the mortgage REITs paid big-fat yields. But suddenly, the Good Times were up.
Everyone was trying to unload them, and their prices dropped, and therefore collateral values dropped, and financing counterparties sent out margin calls to get more cash or collateral to make up for the dropping collateral values. And then all heck broke loose.
On Monday, TPG RE Finance Trust — sponsored by private-equity giant TPG which had spun it off in an IPO in 2017 — announced
that it had still been able to meet margin calls by posting cash
collateral, but “if the requirements to post additional cash collateral
continue to be material,” there is “no certainty” it would be able to
meet future margin calls. To preserve liquidity, it would “delay” paying
its previously announced dividend.
TPG RE’s shares [TRTX] plunged 30% on Monday and 13% on Tuesday to $4.30 and are down nearly 80% from last glory-day February 20.
“The Company is engaging in active
discussions with its lenders and other potential sources of financing,
but it cannot predict whether it will be able to agree to terms with
such parties on an expedited basis,” it said.
And it’s going for a government bailout, it said: “The Company is also monitoring the potential availability of government programs.” Taxpayer to the fore.
On the same day, AG Mortgage Investment Trust, announced that it had not been able to meet margin calls “as a result of market disruptions created by the COVID-19 pandemic.” Shares [MITT] plunged another 24% today, to $2.14, having collapsed from over $16 on February 20.
“In recent weeks, due to the turmoil in
the financial markets resulting from the global pandemic of the COVID-19
virus, the Company and its subsidiaries have received an unusually high
number of margin calls from financing counterparties,” it said
It was able to meet margin calls until
Friday March 20, when it “missed the wire deadline” and notified the
financing counterparties that it would fulfill the margin calls on
Monday March 23 but would not be able to meet the anticipated future
margin calls.
AG Mortgage said that it’s trying to get the financing counterparties to enter into a forbearance agreement and not take ownership of its securities that back the margin loans.
On Tuesday, it was mortgage REIT Investco Mortgage Capital that issued an announcement that it had failed to meet margin calls on Monday, blaming “the turmoil in the financial markets resulting from the global pandemic”
The announcement caused the already beaten down shares of Investco Mortgage Capital [IVR] to crash another 53% to $2.52. Back on February 20, they were still over $18. Investco Mortgage Capital added:
Through Friday, March 20, 2020, the Company had timely met all margin calls received. However, on Monday afternoon, March 23, 2020, the Company notified its financing counterparties that it was not in a position to fund the margin calls that it received on March 23, 2020, and that the Company did not expect to be in a position to fund the anticipated volume of future margin calls under its financing arrangements in the near term as a result of market disruptions created by the COVID-19 pandemic.
It said it is trying to get the counterparties to enter into a forbearance agreement and not take ownership of the securities that back the margin loans. And “to preserve liquidity,” it said it would also “delay” paying the already announced dividends on its common stock, and on its three series of preferred stock.
Also on Tuesday MFA Financial announced that it had received “an unusually high number of margin calls from financing counterparties,” and that by the close of business on Monday, it couldn’t meet those margin calls.
Its shares (MFA) had started out the day
in the positive at just under $3 and then plunged 87% during the day, to
$0.36. On February 20, before the market chaos started, shares were
still over $8 a share. MFA Financial blamed the repo-market where it
“had experienced higher funding costs,” and the mortgage market turmoil
triggered by COVID-19.
And MFA Financial said:
On March 23, 2020, the Company notified its financing counterparties that it does not expect to be in a position to fund the anticipated volume of future margin calls under its financing arrangements in the near term as a result of market disruptions created by the COVID-19 pandemic.
If MFA fails to meet the margin calls, the
financing counterparties can take ownership of the securities that
secured the margin loan. The company is now trying to get its financing
counterparties to enter into forbearance agreements, where the
counterparties would refrain from exercising their rights and remedies
they have in case of default, but it could not “predict” whether these
talks would succeed.
Salvatore Babones, Associate Professor at The University of Sydney and I discuss the changing face of international education in the light of his recent published paper.
Are universities facing an existential threat, and do Australian cultural norms get in the way of responding effectively?
First a quick reminder that there is a third party webinar being run tomorrow Thursday. The promoter says there are still spaces. Here is the link. It appears some had issues with completing the registration, but I understand this is now fixed. Contact me via the DFA Blog is you have any issues.
In addition, I will be recording a show with Harry in the next few days, and that will be showing on the DFA channels. If there are questions you would like me to ask, again send them via the DFA Blog.
I caught up with Guy Standing, Professorial Research Associate at SOAS University of London, a Fellow of the British Academy of Social Sciences, and co-founder and now honorary co-president of the Basic Income Earth Network (BIEN), an international NGO that promotes basic income.
His latest and new book is Battling Eight Giants: Basic Income Now.
Today in one the richest countries in the world, 60% of households in poverty have people in jobs, inequality is the highest it has been for 100 years, climate change threatens our extinction and automation means millions are forced into a life of precarity. The solution? Basic Income.
Here, Guy Standing, the leading expert on the concept, explains how to solve the new eight evils of modern life, and all for almost zero net cost. There is a better future, one that makes certain all citizens can share in the wealth of the modern economy. Far from being a new idea, Standing shows how the roots of basic income go back to the Charter of the Forest, one of two foundational documents of the state – the other, sealed on the same day, being the Magna Carta.
His recent books include Basic Income: And How We Can Make It Happen (2017), The Corruption of Capitalism: Why Rentiers Thrive and Work Does Not Pay (2016); with others, Basic Income: A Transformative Policy for India (2015); A Precariat Charter: From Denizens to Citizens (2014); and The Precariat: The New Dangerous Class (2011), which has been translated into 23 languages.
[Note: to comply with YT I edited certain words and replaced them with more generic ones, but did not change the meaning in 5 separate places]. The full non edited version is available via the DFA podcast edition. The link to that will be pinned to the video.
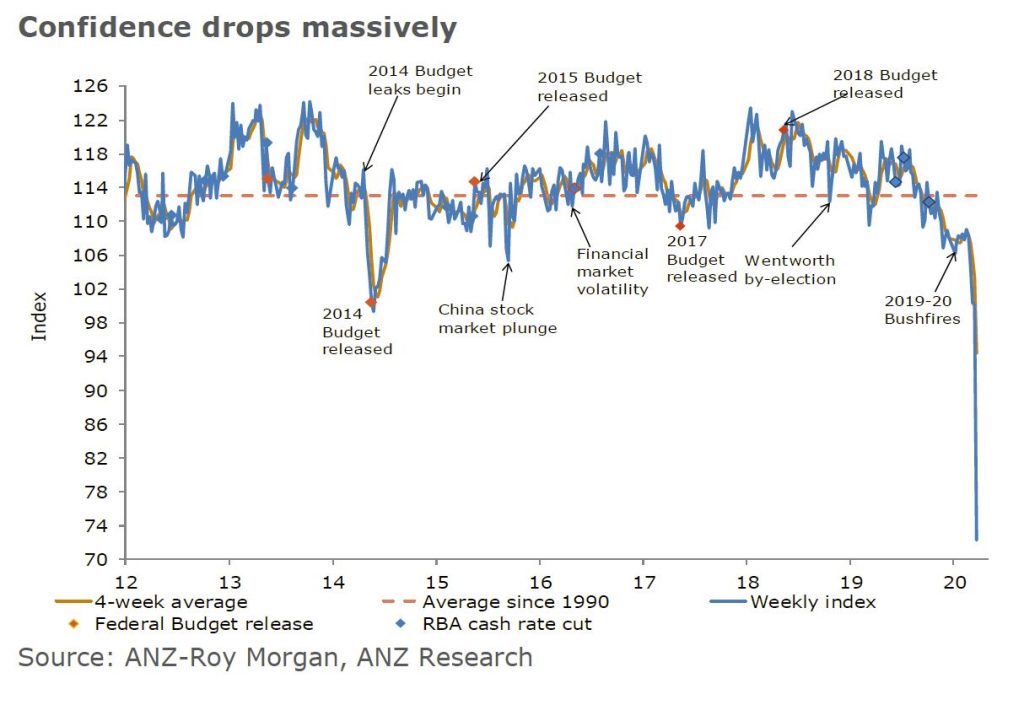
The ANZ-Roy Morgan Consumer Confidence index fell by a massive 27.8% last week. This fall has bought the headline index to just above the all-time lows recorded in 1990. Confidence is 17% below the lowest point seen during the global financial crisis (Oct 2008).
All the sub-components of the survey plunged. ‘Current financial conditions’ fell 23.9% while ‘future financial conditions’ dropped 25.8%.
The economic conditions subindices were also down sharply, with ‘current economic conditions’ falling 37.1% and ‘future economic conditions’ declining by 19.1%.
‘Time to buy a major household item’ fell the most, dropping by 37.2%. The four-week moving average for ‘inflation expectations’ was stable at 4.0%.
They do warn that they made a change in the survey methodology, away from face-to-face to phone and online interviews. It is possible that this impacted the results, though the consistency of the responses suggests this is unlikely.
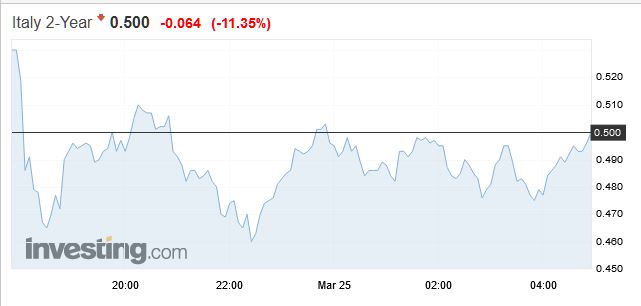
To prevent its bond yields from rising, Italy needs a bailout now, not later. Specifically, it needs a dedicated firewall of at least €500 billion . This is because if bond yields were to rise too high too quickly, Italian public finances will deteriorate, and Italy will then be increasingly unable to roll over its debt.
The European Central Bank is the only authority with the wherewithal to finance this bailout. But they won’t at the moment.
The bond market has been pricing an implicit ECB guarantee concerning Italian sovereign debt. Thus, should the ECB fail to act this could become another global credit crisis trigger. So the ECB is basically being held hostage by the bond markets.
At present, the ECB only has the authority to purchase an additional €150 billion of Italian debt before it breaches the self-imposed 33% issuer limit. German and Dutch hawks on the ECB governing council have expressed opposition to even contemplating any breach of this ceiling. This impending bailout will test European political unity shortly.
The ECB must ride to the rescue over the objections of the fiscally upright German and Dutch council members, assuming all of the repugnant moral hazard that comes with that. The only alternative is an Italian default and subsequent “Italexit” that would send shockwaves reverberating throughout financial markets worldwide. And it would blow-up the Eurozone in a heart beat.